. 2024 Dec 10:12:tkae049.
doi: 10.1093/burnst/tkae049. eCollection 2024.

Type I collagen extracellular matrix facilitates nerve regeneration via the construction of a favourable microenvironment

Affiliations

Type I collagen extracellular matrix facilitates nerve regeneration via the construction of a favourable microenvironment

Panjian Lu et al. Burns Trauma. .

Abstract

Background: The extracellular matrix (ECM) provides essential physical support and biochemical cues for diverse biological activities, including tissue remodelling and regeneration, and thus is commonly applied in the construction of artificial peripheral nerve grafts. Nevertheless, the specific functions of essential peripheral nerve ECM components have not been fully determined. Our research aimed to differentially represent the neural activities of main components of ECM on peripheral nerve regeneration.

Methods: Schwann cells from sciatic nerves and neurons from dorsal root ganglia were isolated and cultured in vitro. The cells were seeded onto noncoated dishes, Matrigel-coated dishes, and dishes coated with the four major ECM components fibronectin, laminin, collagen I, and collagen IV. The effects of these ECM components on Schwann cell proliferation were determined via methylthiazolyldiphenyl-tetrazolium bromide (MTT), Cell Counting Kit-8, and 5-ethynyl-2'-deoxyuridine (EdU) assays, whereas their effects on cell migration were determined via wound healing and live-cell imaging. Neurite growth in neurons cultured on different ECM components was observed. Furthermore, the two types of collagen were incorporated into chitosan artificial nerves and used to repair sciatic nerve defects in rats. Immunofluorescence analysis and a behavioural assessment, including gait, electrophysiology, and target muscle analysis, were conducted.

Results: ECM components, especially collagen I, stimulated the DNA synthesis and movement of Schwann cells. Direct measurement of the neurite lengths of neurons cultured on ECM components further revealed the beneficial effects of ECM components on neurite outgrowth. Injection of collagen I into chitosan and poly(lactic-co-glycolic acid) artificial nerves demonstrated that collagen I facilitated axon regeneration and functional recovery after nerve defect repair by stimulating the migration of Schwann cells and the formation of new blood vessels. In contrast, collagen IV recruited excess fibroblasts and inflammatory macrophages and thus had disadvantageous effects on nerve regeneration.

Conclusions: These findings reveal the modulatory effects of specific ECM components on cell populations of peripheral nerves, reveal the contributing roles of collagen I in microenvironment construction and axon regeneration, and highlight the use of collagen I for the healing of injured peripheral nerves.

Keywords: Chitosan nerve conduit; Collagen I; Collagen IV; Extracellular matrix; Peripheral nerve regeneration; Regenerative microenvironment; Scaffold.


Conflict of interest statement

None declared.

Figures

Graphical Abstract
Graphical Abstract
Figure 1
Figure 1
Effects of ECM components on Schwann cell growth. (a, b) Average growth curves of Schwann cells. n = 3 biological replicates. (c) Relative viability of Schwann cells grown on plates coated with 10 μg/ml Matrigel, fibronectin, laminin, collagen I, or collagen IV was normalized to that of the noncoated control. n = 3 biological replicates. p < 0.0001 for 10 μg/ml Matrigel, p = 0.0012 for 10 μg/ml fibronectin, p < 0.0001 for 10 μg/ml laminin, p< 0.0001 for 10 μg/ml collagen I, and p = 0.0002 for 10 μg/ml collagen IV vs the noncoated control. (d) Relative viability of Schwann cells grown on plates coated with 100 μg/ml Matrigel, fibronectin, laminin, collagen I, or collagen IV was normalized to that of the noncoated control. n = 3 biological replicates. p < 0.0001 for 100 μg/ml Matrigel, and p = 0.0041 for 100 μg/ml laminin vs the noncoated control. **p < 0.01; ***p < 0.001; ****p < 0.0001. ECM extracellular matrix
Figure 2
Figure 2
Effects of ECM components on Schwann cell proliferation. (a, c) Relative proliferation rates of Schwann cells grown on plates coated with 10 μg/ml Matrigel, fibronectin, laminin, collagen I, or collagen IV normalized to the noncoated control. Red represents EdU-positive cells and blue represents nucleus. n = 3 biological replicates. Scale bar: 100 μm. p = 0.0288 for 10 μg/ml laminin, p = 0.0068 for 10 μg/ml collagen I, and p = 0.0062 for 10 μg/ml collagen IV vs the noncoated control. (b, d) Relative proliferation rates of Schwann cells grown on plates coated with 100 μg/ml Matrigel, fibronectin, laminin, collagen I, or collagen IV normalized to the noncoated control. n = 3 biological replicates. Scale bar: 100 μm. *p < 0.05; **p < 0.01. ECM extracellular matrix
Figure 3
Figure 3
Effects of ECM components on Schwann cell movement. (a, c) Remaining cleaned areas of Schwann cells. n = 3 biological replicates. Scale bar: 100 μm. p = 0.0102 for 10 μg/ml Matrigel vs the noncoated control. (b, d) Remaining cleaned areas of Schwann cells. n = 3 biological replicates. Scale bar: 100 μm. p = 0.0033 for 100 μg/ml Matrigel, p < 0.0001 for 100 μg/ml laminin, and p = 0.0226 for 100 μg/ml collagen IV vs the noncoated control. (e) Average travel distances of Schwann cells. n = 3 biological replicates. (f) Average travel distances of Schwann cells. n = 3 biological replicates. (g) Movement velocities of Schwann cells. n > 35 Schwann cells. p < 0.0001 for 10 μg/ml Matrigel, p < 0.0001 for 10 μg/ml fibronectin, p < 0.0001 for 10 μg/ml collagen I, and p = 0.0134 for 10 μg/ml collagen IV vs the noncoated control. (h) Movement velocities of Schwann cells. n > 35 Schwann cells. p = 0.0002 for 100 μg/ml Matrigel and p < 0.0001 for 100 μg/ml collagen I vs the noncoated control. *p < 0.05; **p < 0.01; ***p < 0.001; ****p < 0.0001. ECM extracellular matrix
Figure 4
Figure 4
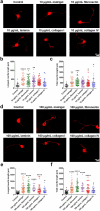
Effects of ECM components on neuron growth. (a) NF200 immunostaining of neurons. Scale bar: 100 μm. (b) Longest neurite length of neurons. n > 15 neurons. p < 0.0001 for 10 μg/ml Matrigel, p = 0.0010 for 10 μg/ml fibronectin, p = 0.0011 for 10 μg/ml laminin, and p < 0.0185 for 10 μg/ml collagen I vs the noncoated control. (c) Total neurite length of neurons. n > 15 neurons. p = 0.0016 for 10 μg/ml Matrigel, p = 0.0008 for 10 μg/ml fibronectin, p = 0.0300 for 10 μg/ml laminin, p = 0.0344 for 10 μg/ml collagen I, and p = 0.0238 for 10 μg/ml collagen IV vs the noncoated control. (d) NF200 immunostaining of neurons. Scale bar: 100 μm. (e) Longest neurite length of neurons. n > 15 neurons. p < 0.0001 for 100 μg/ml Matrigel, p < 0.0001 for 100 μg/ml fibronectin, p < 0.0001 for 100 μg/ml laminin, p < 0.0001 for 100 μg/ml collagen I, and p = 0.0291 for 100 μg/ml collagen IV vs the noncoated control. (f) Total neurite length of neurons. n > 15 neurons. p < 0.0001 vs the non coated control. *p < 0.05; **p < 0.01; ***p < 0.001; ****p < 0.0001. ECM extracellular matrix
Figure 5
Figure 5
Effects of collagen I and collagen IV on Schwann cell migration and nerve regeneration. (a) NF200 and S100 immunostaining of longitudinal sections of regenerated sciatic nerves 14 days after gap bridging. Green indicates NF200 staining, red indicates S100 staining, and blue indicates Hoechst staining. Asterisks indicate the front edge of the regenerated axons. Arrows point to Schwann cells migrating from the proximal nerve stump, whereas arrowheads point to Schwann cells migrating from the distal nerve stump. Boxed areas are displayed at a higher magnification. Scale bars represents 1000 μm in the main image and 100 μm in the enlarged image. (b) Distance of regenerated axons located from the starting point of the proximal nerve stump to the front of extension 14 days after gap bridging. n = 4 rats. p = 0.0193 for collagen I vs saline and p = 0.0214 for collagen I vs collagen IV. (c) Distance of Schwann cell migration from the proximal nerve stump. n = 4 rats. p = 0.0024 for collagen l vs saline and p = 0.0016 for collagen I vs collagen IV. (d) Distance of Schwann cell migration from the distal nerve stump. n = 4 rats. p = 0.0155 for collagen I vs saline and p = 0.0018 for collagen I vs collagen IV. (e) Representative images of 2D and 3D footprint strengths 4 weeks after gap bridging. RH, right hind limb (normal side); LH, left hind limb (injury side). (f) Maximum contact area of the left hind limb. n = 3 rats. p = 0.0493 for collagen I vs collagen IV. (g) Ratio of max contact max intensity (LH/RH). n = 3 rats. p = 0.0110 for collagen I vs saline and p = 0.0184 for collagen I vs collagen IV. (h) Sciatic functional index values of each group. n = 3 rats. (i) Representative electromyography image of the injured side and compound muscle action potential (CMAP) amplitudes for each group at 4 weeks after gap bridging. n = 3 rats. p = 0.0367 for collagen I vs collagen IV. (j) Statistical results of the wet weight ratio of the gastrocnemius muscle 4 weeks after gap bridging. n = 3 rats. p = 0.0260 for collagen l vs saline and p = 0.0280 for collagen I vs collagen IV. *p < 0.05 vs saline; **p < 0.01 vs saline; #p < 0.05 vs collagen IV; ##p < 0.01 vs collagen IV
Figure 6
Figure 6
Effects of collagen I and collagen IV on blood vessel formation. (a, b) Immunostaining of the vessels inside the scaffold 14 days after gap bridging. Red indicates CD34 staining and blue indicates Hoechst staining. Boxed areas in (a) are displayed at a higher magnification in (b). Scale bars represents 1000 μm in (a) and 500 μm in (b). (c) Area of vessels inside the scaffold. n = 4 rats. p = 0.0020 for collagen I vs saline and p = 0.0003 for collagen I vs collagen IV. (d) Total length of vessels inside the scaffold. n = 4 rats. p = 0.0008 for collagen I vs saline and p < 0.0001 for collagen I vs collagen IV. (e) Number of junctions of vessels inside the scaffold. n = 4 rats. p < 0.0001 for collagen I vs saline, p = 0.0286 for collagen IV vs saline, and p < 0.0001 for collagen I vs collagen IV. **p < 0.01 vs saline; ***p < 0.001 vs saline; ****p < 0.0001 vs saline; #p < 0.05 vs collagen IV; ###p < 0.001 vs collagen IV; ####p < 0.0001 vs collagen IV
Figure 7
Figure 7
Effects of collagen I and collagen IV on fibroblast accumulation. (a) Immunostaining of fibroblasts inside the scaffold 14 days after gap bridging. Green indicates P4HB staining, white colour indicates EdU staining, red indicates S100 staining, and blue indicates Hoechst staining. Arrowheads point to EdU-positive fibroblasts. Arrows point to EdU-positive Schwann cells. Scale bar: 50 μm. (b) Immunostaining of fibroblasts outside the scaffold 14 days after gap bridging. Green indicates P4HB staining and blue indicates Hoechst staining. Boxed areas are displayed at a higher magnification. The dashed line indicates the outer edge of the scaffold. Scale bars represent 1000 μm in the main image and 200 μm in the enlarged image. (c) Number of EdU-positive proliferating cells. n = 3 rats. p = 0.0002 for collagen IV vs saline and p = 0.0003 for collagen I vs collagen IV. (d) Ratio of proliferating cells to total cells. n = 3 rats. p = 0.0495 for collagen IV vs saline and p = 0.0252 for collagen I vs collagen IV. (e) Number of S100- and EdU-positive proliferating Schwann cells. n = 3 rats. (f) Number of P4HB- and EdU-positive proliferating fibroblasts. n = 3 rats. p = 0.0003 for collagen IV vs saline and p = 0.0004 for collagen I vs collagen IV. (g) Ratio of proliferating fibroblasts to total fibroblasts cells. n = 3 rats. p = 0.0053 for collagen IV vs saline and p = 0.0067 for collagen I vs collagen IV. (h) Thickness of the fibrous capsule outside the scaffold. Three points at the proximal, middle, and distal segments on the same side of the longitudinal section of each nerve conduit were measured. n = 4 rats. p < 0.0001 for collagen IV vs saline and p < 0.0001 for collagen I vs collagen IV. *p < 0.05 vs saline; **p < 0.01 vs saline; ***p < 0.001 vs saline; ****p < 0.0001 vs saline; #p < 0.05 vs collagen IV; ##p < 0.01 vs collagen IV; ###p < 0.001 vs collagen IV; ####p < 0.0001 vs collagen IV
Figure 8
Figure 8
Effects of collagen I and collagen IV on macrophage invasion. (a) Immunostaining of M2 macrophages inside the scaffold 14 days after gap bridging. Green indicates CD68 staining, red indicates CD206 staining, and blue indicates Hoechst staining. The M2 macrophages were CD68-positive and CD206-positive. Scale bar: 50 μm. (b) Number of M2 macrophages. n = 4 rats. p = 0.0316 for collagen l vs saline and p = 0.0438 for collagen l vs collagen IV. (c) Ratio of M2 macrophages to total macrophages. n = 4 rats. p = 0.0344 for collagen l vs saline and p = 0.0064 for collagen I vs collagen IV. (d) Immunostaining of M1 macrophages inside the scaffold 14 days after gap bridging. Green indicates iNOS staining, red indicates Iba1 staining, and blue indicates Hoechst staining. The M1 macrophages were Iba1- and iNOS-positive. Scale bar: 50 μm. (e) Number of M1 macrophages. n = 4 rats. p = 0.0001 for collagen IV vs saline and p < 0.0001 for collagen l vs collagen IV. (f) Ratio of M1 macrophages to total macrophages. n = 4 rats. p = 0.0021 for collagen l vs saline, p = 0.0027 for collagen IV vs saline and p < 0.0001 for collagen I vs collagen IV. *p < 0.05 vs saline; **p < 0.01 vs saline; ***p < 0.001 vs saline; #p < 0.05 vs collagen IV; ##p < 0.01 vs collagen IV; ####p < 0.0001 vs collagen IV
Figure 9
Figure 9
Temporal expression of genes encoding ECM components. (a) Relative expression of fibronectin-associated genes in rat sciatic nerves at 0, 1, 4, 7, and 14 days after nerve injury. Fn1, fibronectin 1; Elfn1, extracellular leucine-rich repeat and fibronectin type III domain containing 1; Fndc8, fibronectin type III domain containing 8; Fank1, fibronectin type 3 and ankyrin repeat domains 1; Lrfn4, leucine-rich repeat and fibronectin type III domain containing 4; and Flrt3, fibronectin leucine-rich transmembrane protein 3 were consistently upregulated. (b) Relative expression of laminin-associated genes in rat sciatic nerves at 0, 1, 4, 7, and 14 days after nerve injury. Lamb3, laminin, and beta 3 were consistently upregulated. (c) Relative expression of collagen-associated genes in rat sciatic nerves at 0, 1, 4, 7, and 14 days after nerve injury. Col6a4, collagen, type VI, alpha 4; Col7a1, collagen, type VII, alpha 1; Col8a1, collagen, type VIII, alpha 1; Col17a1, collagen, type XVII, alpha 1; Col18a1, collagen, type XVIII, alpha 1; and Col27a1, collagen, type XXVIII, alpha 1 were consistently upregulated. Red represents upregulation, green represents downregulation, and grey represents undetected. ECM extracellular matrix

References

    1. Bonnans C, Chou J, Werb Z. Remodelling the extracellular matrix in development and disease. Nat Rev Mol Cell Biol 2014;15:786–801. 10.1038/nrm3904. - DOI - PMC - PubMed
    1. Theocharis AD, Skandalis SS, Gialeli C, Karamanos NK. Extracellular matrix structure. Adv Drug Deliv Rev 2016;97:4–27. 10.1016/j.addr.2015.11.001. - DOI - PubMed
    1. Yi S, Ding F, Gong L, Gu X. Extracellular matrix scaffolds for tissue engineering and regenerative medicine. Curr Stem Cell Res Ther 2017;12:233–46. 10.2174/1574888X11666160905092513. - DOI - PubMed
    1. Prendergast ME, Davidson MD, Burdick JA. A biofabrication method to align cells within bioprinted photocrosslinkable and cell-degradable hydrogel constructs via embedded fibers. Biofabrication 2021;13:044108. 10.1088/1758-5090/ac25cc. - DOI - PMC - PubMed
    1. Diba M, Spaans S, Hendrikse SIS, Bastings MMC, Schotman MJG, van Sprang J. et al. . Engineering the dynamics of cell adhesion cues in supramolecular hydrogels for facile control over cell encapsulation and behavior. Adv Mater 2021;33:e2008111. 10.1002/adma.202008111. - DOI - PMC - PubMed

LinkOut - more resources