. 2024 Oct 28;14(19):7292-7308.
doi: 10.7150/thno.99323. eCollection 2024.

Circular RNA SCMH1 suppresses KMO expression to inhibit mitophagy and promote functional recovery following stroke

Affiliations

Circular RNA SCMH1 suppresses KMO expression to inhibit mitophagy and promote functional recovery following stroke

Yu Wang et al. Theranostics. .

Abstract

Rationale: Metabolic dysfunction is one of the key pathological events after ischemic stroke. Disruption of cerebral blood flow impairs oxygen and energy substrate delivery, leading to mitochondrial oxidative phosphorylation dysfunction and cellular bioenergetic stress. Investigating the effects of circSCMH1, a brain repair-related circular RNA, on metabolism may identify novel therapeutic targets for stroke treatment. Methods: CircSCMH1 was encapsulated into brain-targeting extracellular vesicles (EVs) mediated by rabies virus glycoprotein (RVG). Using a mouse model of photothrombotic (PT) stroke, we employed metabolomics and transcriptomics, combined with western blotting and behavioral experiments, to identify the metabolic targets regulated in RVG-circSCMH1-EV-treated mice. Additionally, immunofluorescence staining, chromatin immunoprecipitation (ChIP), pull-down, and western blotting were utilized to elucidate the underlying mechanisms. Results: The targeted delivery of circSCMH1 via RVG-EVs was found to promote post-stroke brain repair by enhancing mitochondrial fusion and inhibiting mitophagy through suppression of kynurenine 3-monooxygenase (KMO) expression. Mechanistically, circSCMH1 exerted its inhibitory effect on KMO expression by binding to the transcription activator STAT5B, thereby impeding its nuclear translocation. Conclusions: Our study reveals a novel mechanism by which circSCMH1 downregulates KMO expression, thereby enhancing mitochondrial fusion and inhibiting mitophagy, ultimately facilitating post-stroke brain repair. These findings shed new light on the role of circSCMH1 in promoting stroke recovery and underscore its potential as a therapeutic target for the treatment of ischemic stroke.

Keywords: KMO; STAT5B; circSCMH1; functional recovery; ischemic stroke.


Conflict of interest statement

Competing Interests: The authors have declared that no competing interest exists.

Figures
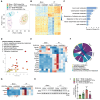
Figure 1
Figure 1
CircSCMH1 regulates metabolic disorders and inhibits KMO expression after cerebral ischemia. (A) Principal component analysis (PCA) of the metabolome in PT and sham mice overexpressing circSCMH1 or Vector (n = 8). Each symbol represents the data for an individual mouse. (B) Heatmap analysis of 346 differential metabolites in PT and sham mice overexpressing circSCMH1 or Vector (n = 8). (C) Metabolism-related KEGG pathway enrichment analysis of 148 differentially expressed genes ([log2(fold change)] ≥ 1 and P-value < 0.05). (D) Pathways altered in PT mice treated with circSCMH1 identified based on transcriptomic and metabolomics data. Metabolic pathways of interest are highlighted. (E) Heatmap analysis of 14 genes involved in metabolism identified in transcriptomic analyses (n = 3). (F) Chord diagrams visualizing the interrelationships between amino acids metabolism-related genes and amino acids metabolic pathways. (G) Heatmap analysis of 4 genes involved in amino acid metabolism identified in transcriptomic analyses (n = 3). (H, I) Western blotting analysis of post-stroke KMO expression in mice. Three representative immunoblots are presented from 6 mice/group. ***P < 0.001 versus the sham + RVG-Vector-EVs group; ###P < 0.001 versus the PT + RVG-Vector-EVs group using 2-way ANOVA followed by Holm-Sidak post hoc multiple comparisons test. CircSCMH1, circular RNA SCMH1; EVs, extracellular vesicles; KMO, kynurenine 3-monooxygenase; PCA, principal component analysis; PT, photothrombotic stroke; RVG, rabies virus glycoprotein.
Figure 2
Figure 2
The reparative post-stroke function of circSCMH1 is independent of KMO enzymatic activity. (A) Diagram of the kynurenine pathway. (B) CircSCMH1-treated mouse steady-state kynurenine metabolite tissue concentrations of tryptophan, kynurenine, 3-hydroxykynurenine, kynurenic acid, and 3-hydroxyanthranilic acid. n = 5 animals/group. **P < 0.01, ***P < 0.001 versus Sham + RVG-Vector-EVs group; #P < 0.05, ##P < 0.01 versus PT + RVG-Vector-EVs group using 2-way ANOVA followed by Holm-Sidak post hoc multiple comparisons test. EVs, extracellular vesicles; KMO, kynurenine 3-monooxygenase; PT, photothrombotic stroke; RVG, rabies virus glycoprotein.
Figure 3
Figure 3
KMO inhibition enhances functional recovery after ischemic stroke. (A) Schematic overview of LV-KMO, RVG-circSCMH1-EVs administration, and behavioral studies. (B-D) KMO eliminated the beneficial effect of circSCMH1 on behavioral recovery at different time points after stroke as measured by the grid-walking test, cylinder test, and adhesive removal test; L indicates left forepaw in the cylinder test; R, right forepaw in the cylinder test; B, both forepaws in the cylinder test. n = 15 animals/group. ***P < 0.001 versus the sham group; ###P < 0.001 versus the PT + RVG-Vector-EVs group; †††P < 0.001 versus the PT + RVG-circSCMH1-EVs + LV-Vector group using 2-way ANOVA followed by Holm-Sidak post hoc multiple comparisons test. EVs, extracellular vesicles; i.c.v., intracerebroventricular injection; i.v., intravenous injection; KMO, kynurenine 3-monooxygenase; LV, lentivirus; PT, photothrombotic stroke; RVG, rabies virus glycoprotein.
Figure 4
Figure 4
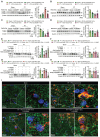
KMO inhibition after circSCMH1 treatment in PT mice regulates mitochondria dynamics. (A-C) Effect of RVG-circSCMH1-EVs on OPA1, MFN2 and DRP1 levels in mice on day 3 after PT (n = 6 for each group). ***P < 0.001 versus the Sham + RVG-Vector-EVs group; #P < 0.05, ##P < 0.01 versus the PT + RVG-Vector-EVs group; two-way ANOVA followed by the Holm-Sidak post hoc multiple comparison test. (D-F) Representative western blots showing OPA1, MFN2 and DRP1 levels in sham and PT mice after LV-Vector or LV-KMO administration with or without RVG-circSCMH1-EVs treatment (n = 6 for each group). **P < 0.01, ***P < 0.001 versus the Sham group; #P < 0.05, ##P < 0.01, ###P < 0.001 versus the PT + RVG-Vector-EVs group; †††P < 0.001 versus the PT + RVG-circSCMH1-EVs + LV-Vector group; two-way ANOVA followed by the Holm-Sidak post hoc multiple comparison test. (G) Representative confocal microscopy images of TOM20 (green, a mitochondrial outer membrane marker) in the peri-infarct cortex on day 3 after PT. DAPI, 4′,6-diamidino-2-phenylindole; DRP1, dynamin related protein 1; EVs, extracellular vesicles; KMO, kynurenine 3-monooxygenase; LV, lentivirus; MFN2, mitofusin 2; OPA1, OPA1 mitochondrial dynamin like GTPase; PT, photothrombotic stroke; RVG, rabies virus glycoprotein; TOM20, translocase of outer membrane 20.
Figure 5
Figure 5
CircSCMH1 inhibits mitophagy via suppressing post-stroke KMO expression. (A-D) Effect of RVG-circSCMH1-EVs on LC3B, SQSTM1, TOM20, and COX4I1 levels in mice at day 3 after PT (n = 6 for each group). **P < 0.01, ***P < 0.001 versus the Sham + RVG-Vector-EVs group; #P < 0.05, ##P < 0.01, ###P < 0.001 versus the PT + RVG-Vector-EVs group using two-way ANOVA followed by the Holm-Sidak post hoc multiple comparison test. (E-H) Representative western blots of LC3B, SQSTM1, TOM20 and COX4I1 levels after LV-Vector or LV-KMO administration with or without RVG-circSCMH1-EVs treatment (n = 6 for each group). *P < 0.05, **P < 0.01, ***P < 0.001 versus the Sham group; #P < 0.05, ##P < 0.01, ###P < 0.001 versus the PT + RVG-Vector-EVs group; ††P < 0.01, †††P < 0.001 versus the PT + RVG-circSCMH1-EVs + LV-Vector group using two-way ANOVA followed by the Holm-Sidak post hoc multiple comparison test. (I) Representative confocal microscopy images of TOM20 (green, a mitochondrial outer membrane marker) and LC3B in the peri-infarct cortex at day 3 after PT. COX4I1, cytochrome c oxidase subunit 4I1; DAPI, 4′,6-diamidino-2-phenylindole; EVs, extracellular vesicles; KMO, kynurenine 3-monooxygenase; LC3B, microtubule associated protein 1 light chain 3 beta; LV, lentivirus; PT, photothrombotic stroke; RVG, rabies virus glycoprotein; SQSTM1, sequestosome 1; TOM20, translocase of outer membrane 20.
Figure 6
Figure 6
Microglial activation is reduced by the inhibition of KMO expression. (A) Western blotting analysis of iNOS expression after LV-KMO and RVG-circSCMH1-EVs treatment in mice at day 3 after PT. Two representative immunoblots are presented from 6 mice/group. ***P < 0.001 versus the Sham group; ##P < 0.01, ###P < 0.001 versus the PT + RVG-Vector-EVs group; †P < 0.05 versus the PT + RVG-circSCMH1-EVs + LV-Vector group using two-way ANOVA followed by the Holm-Sidak post hoc multiple comparison test. (B-E) KMO abolished the inhibitory effect of RVG-circSCMH1-EVs on microglial reactivity in the peri-infarcted cortex on day 3 after PT in mice. Representative images of microglial immunostaining for Iba-1, followed by 3D reconstruction and Sholl analysis (B). Average soma volume (C), branch number (D), total branch length (E) (n = 4 mice/group, 40 cells/group). **P < 0.01, ***P < 0.001 versus the Sham group; ###P < 0.001 versus the PT + RVG-Vector-EVs group; †††P < 0.001 versus the PT + RVG-circSCMH1-EVs + LV-Vector group; two-way ANOVA followed by the Holm-Sidak post hoc multiple comparison test. EVs, extracellular vesicles; iNOS, inducible nitric oxide synthase; KMO, kynurenine 3-monooxygenase; LV, lentivirus; PT, photothrombotic stroke; RVG, rabies virus glycoprotein.
Figure 7
Figure 7
Astrocyte activation is reduced by the inhibition of KMO expression. (A) Western blot analysis of GFAP expression after LV-KMO and RVG-circSCMH1-EVs treatment in mice at day 3 after PT. Two representative immunoblots were presented from 6 mice/group. ***P < 0.001 versus the Sham group; ###P < 0.001 versus the PT + RVG-Vector-EVs group; ††P < 0.01 versus the PT + RVG-circSCMH1-EVs + LV-Vector group using two-way ANOVA followed by the Holm-Sidak post hoc multiple comparison test. (B-E) KMO abolished the inhibitory effect of RVG-circSCMH1-EVs on astrocyte reactivity in the peri-infarcted cortex on day 3 after PT in mice. Representative images of astrocyte immunostaining for GFAP, followed by 3D reconstruction and Sholl analysis (B). Average soma volume (C), branch number (D), total branch length (E) (n = 4 mice for each group, 40 cells for each group). ***P < 0.001 versus the Sham group; ###P < 0.001 versus the PT + RVG-Vector-EVs group; †††P < 0.001 versus the PT + RVG-circSCMH1-EVs + LV-Vector group using two-way ANOVA followed by the Holm-Sidak post hoc multiple comparison test. EVs, extracellular vesicles; GFAP, glial fibrillary acidic protein; KMO, kynurenine 3-monooxygenase; LV, lentivirus; PT, photothrombotic stroke; RVG, rabies virus glycoprotein.
Figure 8
Figure 8
CircSCMH1 decreases Kmo expression and binds to STAT5B. (A) Illustration of the consensus binding site between STAT5B and the Kmo promoter. (B) ChIP assay demonstrating the ability of STAT5B to bind to Kmo promoter. (C) Prediction of circSCMH1-STAT5B interaction using the catPAPID algorithm. (D) Interaction between circSCMH1 and STAT5B was measured by RNA pull-down assay in HT-22 cells. All data were presented as mean ± SEM of three independent experiments. *P < 0.05 versus the circControl group using Student's t-test. (E) Representative western blotting analysis of STAT5B levels after RVG-circSCMH1-EVs administration with or without PT treatment (n = 6 for each group). The significance was analyzed using two-way ANOVA followed by the Holm-Sidak post hoc multiple comparison test. (F-H) Western blotting analysis of STAT5B protein levels (F) and cytoplasmic (G) or nuclear (H) localization of STAT5B in HT-22 cells after vector or circSCMH1 plasmid transduction with or without OGD treatment for 3 h. All data are presented as means ± SEM of three independent experiments. ***P < 0.001 versus the Control + Vector group; ##P < 0.01, ###P < 0.001 versus the OGD + Vector group; two-way ANOVA followed by the Holm-Sidak post hoc multiple comparison test. Con, control; EVs, extracellular vesicles; OGD, oxygen glucose deprivation; RVG, rabies virus glycoprotein; STAT5B, signal transducer and activator of transcription 5B.

References

    1. Feigin VL, Stark BA, Johnson CO, Roth GA, Bisignano C, Abady GG. et al. Global, regional, and national burden of stroke and its risk factors, 1990-2019: a systematic analysis for the Global Burden of Disease Study 2019. Lancet Neurol. 2021;20:795–820. - PMC - PubMed
    1. Hankey GJ. Stroke. Lancet. 2017;389:641–54. - PubMed
    1. Murphy TH, Corbett D. Plasticity during stroke recovery: from synapse to behaviour. Nat Rev Neurosci. 2009;10:861–72. - PubMed
    1. Moretti A, Ferrari F, Villa RF. Neuroprotection for ischaemic stroke: Current status and challenges. Pharmacol Ther. 2015;146:23–34. - PubMed
    1. Hofmeijer J, van Putten MJ. Ischemic cerebral damage: an appraisal of synaptic failure. Stroke. 2012;43:607–15. - PubMed

Publication types