. 2024 Nov 4;14(19):7450-7469.
doi: 10.7150/thno.96879. eCollection 2024.

Low PPP2R2A expression promotes sensitivity to CHK1 inhibition in high-grade serous ovarian cancer

Affiliations

Low PPP2R2A expression promotes sensitivity to CHK1 inhibition in high-grade serous ovarian cancer

Zhaojun Qiu et al. Theranostics. .

Abstract

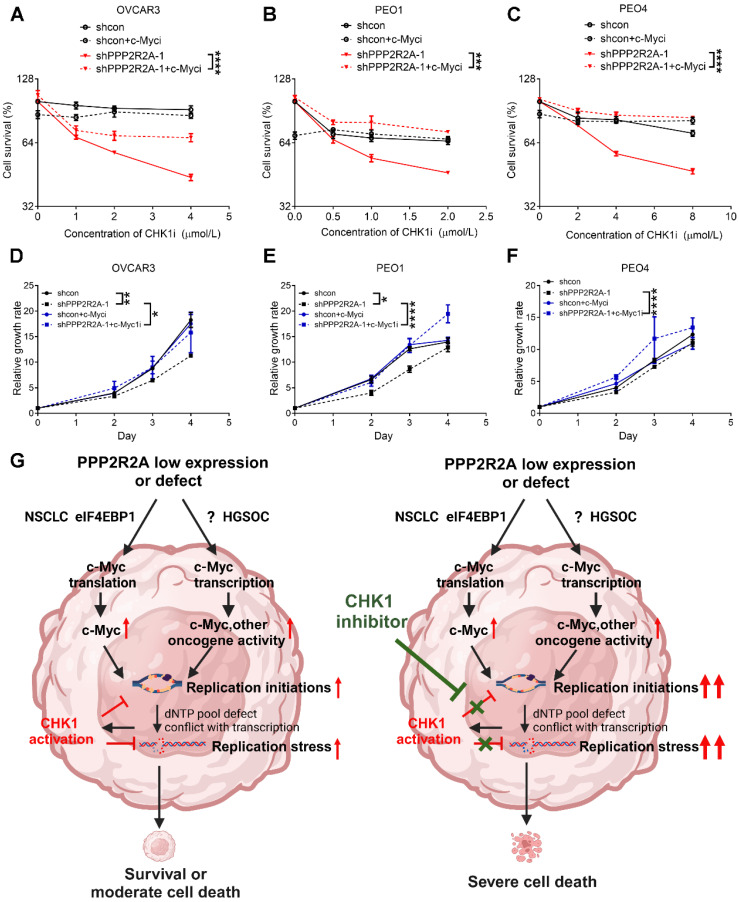
Rationale: High-grade serous ovarian cancer (HGSOC), the most lethal epithelial ovarian cancer subtype, faces persistent challenges despite advances in the therapeutic use of PARP inhibitors. Thus, innovative strategies are urgently needed to improve survival rates for this deadly disease. Checkpoint kinase 1 (CHK1) is pivotal in regulating cell survival during oncogene-induced replication stress (RS). While CHK1 inhibitors (CHK1i's) show promise as monotherapy for ovarian cancer, a crucial biomarker for effective stratification in clinical trials is lacking, hindering efficacy improvement and toxicity reduction. PP2A B55α, encoded by PPP2R2A, is a regulatory subunit of the serine/threonine protein phosphatase 2 (PP2A) that influences CHK1 sensitivity in non-small cell lung cancer (NSCLC). Given the complexity of PP2A B55α function in different types of cancer, here we sought to identify whether PPP2R2A deficiency enhances the sensitivity of HGSOC to CHK1 inhibition. Methods: To determine whether PPP2R2A deficiency affects the sensitivity of HGSOC to CHK1 inhibition, we treated PPP2R2A knockdown (KD) HGSOC cells or HGSOC cells with naturally low PPP2R2A expression with a CHK1 inhibitor, then assessed cell growth in in vitro and in vivo assays. Additionally, we investigated the mechanisms contributing to the increased RS and the enhanced sensitivity to the CHK1 inhibitor in PPP2R2A-KD or deficient cells using various molecular biology assays, including western blotting, immunofluorescence, and DNA fiber assays. Results: Our study suggests that PPP2R2A-KD elevates c-Myc-induced RS via upregulation of replication initiation, rendering HGSOC cells reliant on CHK1 for survival, including those resistant to PARP inhibitors. Conclusion: Combined, these results identify PPP2R2A/PP2A B55α as a potential predictive biomarker for CHK1i sensitivity in HGSOC, as well as suggesting it as a therapeutic target to overcome PARP resistance.


Conflict of interest statement

Competing Interests: The authors have declared that no competing interest exists.

Figures

Figure 1
Figure 1
PPP2R2A deficiency is synthetically lethal with CHK1 inhibition in vitro. (A) Protein expression of B55α in the three indicated ovarian cancer cell lines upon PPP2R2A knockdown (KD). (B-D) Cell survival based on cellular toxicity assays upon PPP2R2A KD and treatment with a CHK1i for 48 h at different doses OVCAR3 (B), PEO4 (C) and PEO1 (D) cells. n=3, biological repeats. (E-F) Colony formation assays of control and PPP2R2A KD HGSOC cells with CHK1 inhibition. OVCAR3 cells were treated with 1 µmol/L of CHK1 inhibitor LY2603618 for 1 day, followed by incubation in fresh medium for an additional 9 days. Representative figures from OVCAR3 cells are shown in (E) and statistical analysis results are shown in (F). n=3, biological repeats. (G-L) Relative cell growth rates of OVCAR3 (G), PEO1 (H) and PEO4 (I) cells or their MTT values on day 4 (J-L) upon CHK1 inhibition (1 µmol/L for OVCAR3 and PEO4, 0.5µmol/L for PEO1) and/or PPP2R2A KD. n=3, biological repeats. *, P < 0.05, **, P < 0.01, ***, P < 0.001, ****, P < 0.0001, two-way ANOVA, followed by Bonferroni post hoc analysis for multiple comparisons was used to determine statistical significance in (B-D, G-I); Statistical significance in (F, J-L) was determined by one-way ANOVA, followed by Bonferroni post hoc analysis for multiple comparisons.
Figure 2
Figure 2
PPP2R2A KD sensitizes OVCAR3 cells to CHK1 inhibitors in vivo. (A) A schematic diagram illustrating the experimental regimen. Female nude mice were subcutaneously inoculated with 5 x 10⁶ OVCAR3 cells carrying shcon or shPPPP2R2A-2. When the tumor volume reached ~100 mm3, mice were then randomized to four groups and treated with vehicle or CHK1 inhibitor LY2603618 via intraperitoneal injection twice a day for three days followed by 4 days of rest for three cycles. (B-G) The effects of CHK1i on tumor growth of OVCAR3 cells with stable PPP2R2A KD. The gross morphology of the xenograft tumors for each group on day 23 is shown in (B). CHK1 inhibition led to tumor volume reduction in PPP2R2A KD tumors (C). ****, P < 0.0001, two-way ANOVA, followed by Bonferroni post hoc analysis for multiple comparisons was used to determine statistical significance. Individual tumor growth curves over time for each group (D). n=8, number of tumors in B-G. Quantification of tumor volume (E) or tumor weight (F) on day 23. *, P < 0.05, **, P < 0.01, statistical significance was determined by one-way ANOVA, followed by Bonferroni post hoc analysis for multiple comparisons. CHK1 inhibition increases the survival of PPP2R2A defective tumors. Kaplan-Meier survival curves of different treatment groups and significance were determined by Mantel-Cox test (*, P < 0.05) (G).
Figure 3
Figure 3
CHK1 inhibition leads to the increased RS, particularly in PPP2R2A KD HGSOC cells. (A, B) Expression of the indicated RS markers in PPP2R2A KD ovarian cancer cells. Western blot of RS markers (A), statical analysis of three independent assays (B). n = 3 in B, biological repeats. (C) Expression of pRPA2 S33, pCHK1 and γH2AX after 2 h or 4 h of CHK1 inhibitor treatment (1 µmol/L of LY2603618) in PPP2R2A KD cells. (D) Double-stranded DNA breaks in PPP2R2A KD OVCAR3 cells. Quantification of olive tail moment in OVCAR3 cells with or without CHK1 inhibition (1 µmol/L of LY2603618) for 2 h. (E-I) The extent of RS maker foci and staining density in CHK1i-treated PPP2R2A KD cells. The percentages of cells with positive γH2AX and pRPA2 S33 foci (≥ 5) (E, F) and the staining density of γH2AX and p-RPA2 S33 (G, H) in OVCAR3 cells with or without PPP2R2A KD using immunofluorescence assay. Cells were collected and fixed after treatment with the CHK1 inhibitor LY2603618 (1 μmol/L) for 2 h. Representative imaging of γH2AX and pRPA2 staining (I). Scale bar, 20 μm. Data in B, D-H are the mean ± SEM of three independent experiments. n = 3 in D-F, biological repeats; n = 300 in G, H, individual staining. Statistical significance was determined by one-way ANOVA, followed by Bonferroni post-hoc analysis for multiple comparisons. *, P < 0.05; **, P < 0.01; ***, P < 0.001; ****, P < 0.0001.
Figure 4
Figure 4
CHK1 inhibition disrupts the replication fork dynamics, particularly in PPP2R2A KD OVCAR3 cells. (A) A schematic diagram illustrating the labeling scheme: IdU is incorporated as the first analog for 40 min, followed by incorporation of CldU as the second analog plus CHK1 inhibitor treatment for 40 min. (B) Representative images of DNA fibers from OVCAR3 cells treated with DMSO or LY2603618 (1 μmol/L). Scale bar, 100 μm. (C) The extent of replication initiations in OVCAR3 cells treated with the CHK1 inhibitor LY2603618. n = 3, biological repeats. (D) Chromatin loading of CDC45 in PPP2R2A KD cells after 2 h of CHK1i (1 μmol/L) treatment. (E) Average fork speed in PPP2R2A KD cells treated with or without a CHK1 inhibitor compared to control cells. n = 300 in E, individual counting of each fiber from three biological repeats. Data in C, E are the mean ± SEM of three independent experiments. Statistical significance was determined by one-way ANOVA, followed by Bonferroni post hoc analysis for multiple comparisons. *, P < 0.05; ***, P < 0.001; ****, P < 0.0001.
Figure 5
Figure 5
Oncogene c-Myc is significantly increased in PPP2R2A KD HGSOC cells. (A) Phosphorylated c-Myc and total c-Myc levels in PPP2R2A KD HGSOC cells as determined by immunoblot. (B) Densitometric quantitation of Western blot analysis of c-Myc expression in PPP2R2A KD cells. Statistical analysis of expression of proteins relative to β-Actin in HGSOC cells with or without PPP2R2A KD. (C) c-Myc mRNA levels in PPP2R2A KD cells. The PPP2R2A and c-Myc expression, as detected by qRT-PCR, are normalized to GAPDH in HGSOC cells. n = 3 in B, C, biological repeats. Statistical significance in B, and C was determined by one-way ANOVA, followed by Bonferroni post-hoc analysis for multiple comparisons. *, P < 0.05; **, P < 0.01; ***, P < 0.001; ****, P < 0.0001.
Figure 6
Figure 6
The inhibition of c-Myc abolishes PPP2R2A KD-triggered RS in OVCAR3 cells. (A) Replication initiations of c-Myc inhibitor-treated PPP2R2A KD cells. Statistical significance was determined by one-way ANOVA, followed by Bonferroni post hoc analysis for multiple comparisons. n = 3, biological repeats; **, P < 0.01; ****, P < 0.0001. (B) CDC45 chromatin loading in c-Myc inhibitor-treated OVCAR3 cells (10058-F4; 20 μmol/L) for 2 h with or without PPP2R2A KD. (C) RS marker expression in PPP2R2A KD HGSOC cells treated with a c-Myc inhibitor (10058-F4; 20 μmol/L) for 2 h). (D-H) RS maker foci and staining density in PPP2R2A KD cells treated with a c-Myc inhibitor (10058-F4; 20 μmol/L) for 2 h. The percentages of cells with positive γH2AX and pRPA2 S33 foci (≥5) (D-E) and the staining density of γH2AX and p-RPA2 S33 (F-G) in OVCAR3 cells with or without PPP2R2A KD as assessed by immunofluorescence assays. Cells were collected and fixed after treatment with the c-Myc inhibitor. Data in D-G are the mean ± SEM of three independent experiments. n = 3 in D-E, biological repeats; n = 300 in F-G, individual staining. Statistical significance was determined by one-way ANOVA, followed by Bonferroni post-hoc analysis for multiple comparisons. *, P < 0.05; ***, P < 0.001; ****, P < 0.0001. Representative images of γH2AX and pRPA2 staining are shown in (H). Scale bar, 20 μm.
Figure 7
Figure 7
The inhibition of c-Myc mitigates PPP2R2A KD-induced sensitivity to CHK1 inhibition. (A-C) c-Myc inhibitor treatment decreases the PPP2R2A KD-triggered sensitivity to CHK1 inhibition in OVCAR3 (A), PEO1 (B), and PEO4 (C) cells. Cell survival was assessed in the indicated cells with or without PPP2R2A deficiency. These cells were treated with either a c-Myc inhibitor (10058-F4; 20 μmol/L) or a CHK1 inhibitor for 48 h. (D-F) Relative growth of the indicated cell lines with or without PPP2R2A deficiency and treated with a c-Myc inhibitor (10058-F4; 20 μmol/L) for 48 h. n = 3, biological repeats; *, P < 0.05, **, P < 0.01, ***, P < 0.001, ****, P < 0.0001, two-way ANOVA, followed by Bonferroni post-hoc analysis for multiple comparisons was used to determine statistical significance in (A-F). (G) A schematic diagram illustrating the proposed working model regarding the increased sensitivity to CHK1 inhibition in the HGSOC cells with PPP2R2A KD or deficiency. This image was generated using BioRender (https://biorender.com/).

References

    1. Salani R, Backes FJ, Fung MF, Holschneider CH, Parker LP, Bristow RE, Goff BA. Posttreatment surveillance and diagnosis of recurrence in women with gynecologic malignancies: Society of Gynecologic Oncologists recommendations. Am J Obstet Gynecol. 2011;204:466–78. - PubMed
    1. Zivanovic O, Aldini A, Carlson JW, Chi DS. Advanced cytoreductive surgery: American perspective. Gynecol Oncol. 2009;114:S3–9. - PubMed
    1. Armstrong DK, Bundy B, Wenzel L, Huang HQ, Baergen R, Lele S. et al. Intraperitoneal cisplatin and paclitaxel in ovarian cancer. The New England journal of medicine. 2006;354:34–43. - PubMed
    1. Luo L, Keyomarsi K. PARP inhibitors as single agents and in combination therapy: the most promising treatment strategies in clinical trials for BRCA-mutant ovarian and triple-negative breast cancers. Expert Opin Investig Drugs. 2022;31:607–31. - PMC - PubMed
    1. Seidman JD, Horkayne-Szakaly I, Haiba M, Boice CR, Kurman RJ, Ronnett BM. The histologic type and stage distribution of ovarian carcinomas of surface epithelial origin. Int J Gynecol Pathol. 2004;23:41–4. - PubMed

Publication types

MeSH terms