

Realizing real-time optical molecular imaging in peripheral nerve tissue via Rhodamine B
- PMID: 39659623
- PMCID: PMC11628308
- DOI: 10.3389/fmed.2024.1461520
Realizing real-time optical molecular imaging in peripheral nerve tissue via Rhodamine B
Abstract
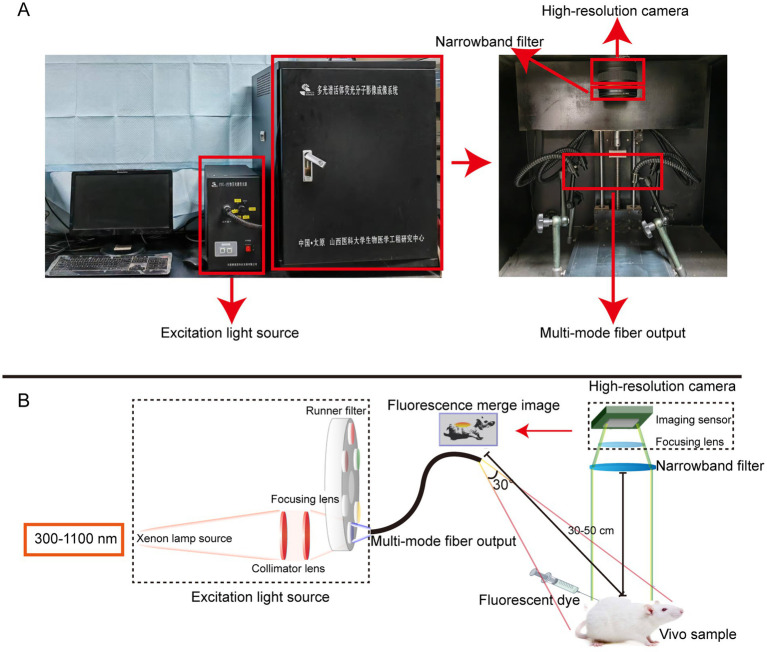
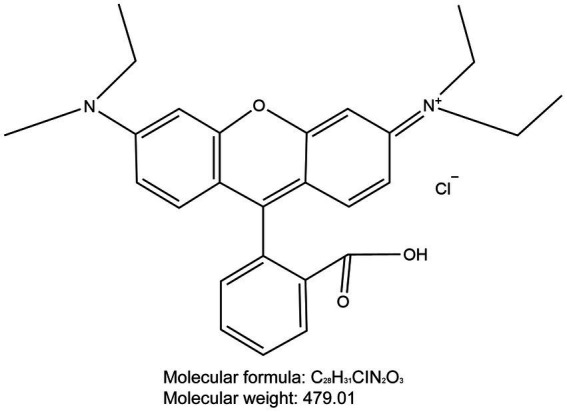
Background: Iatrogenic nerve injury is a consequential complication during surgery. Thus, real-time imaging of peripheral nerve (PN) possesses significant clinical implications. In recent years, the rapid advancements in optical molecular imaging (OMI) technology have provided essential technical foundations for the implementation of PN fluorescence imaging. This study aimed to realize real-time OMI of PNs via Rhodamine B.
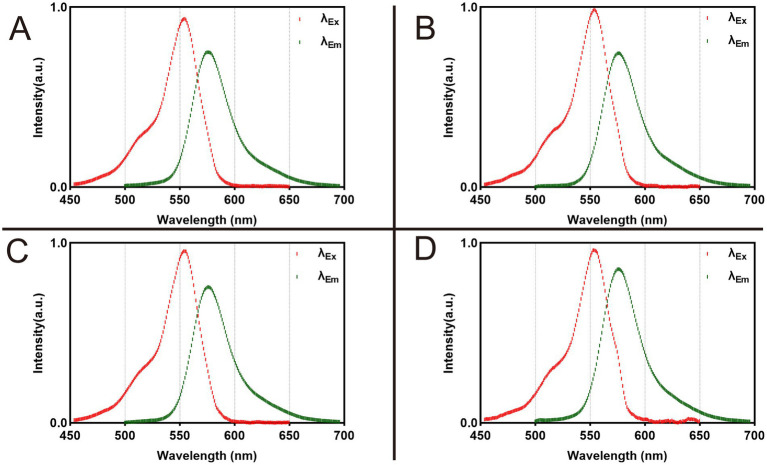
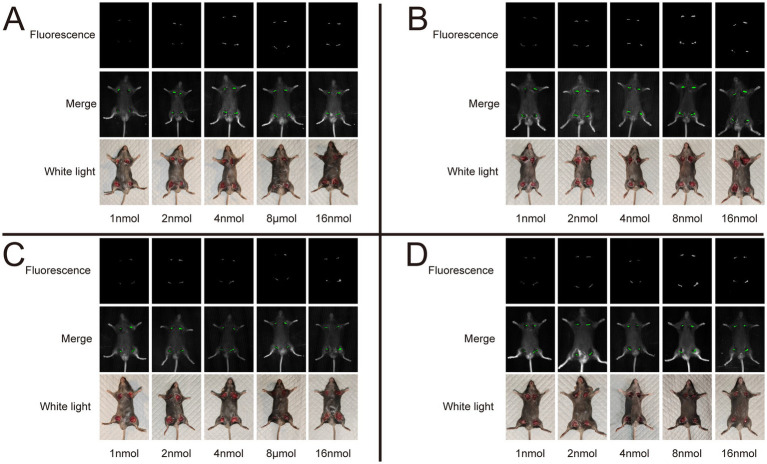
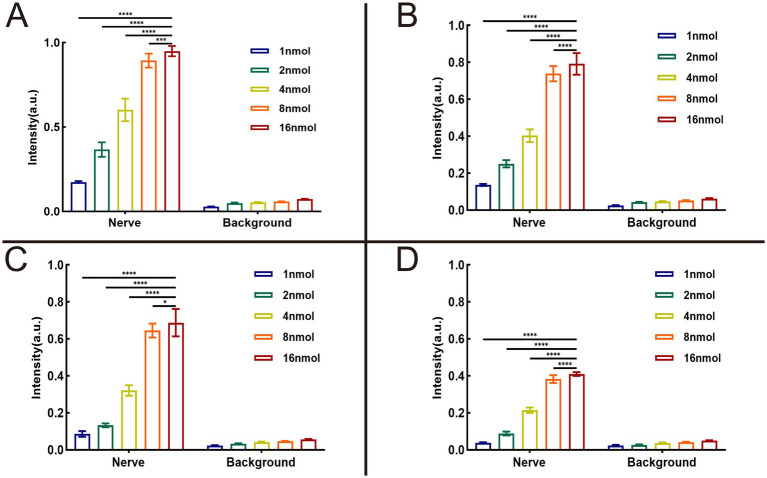
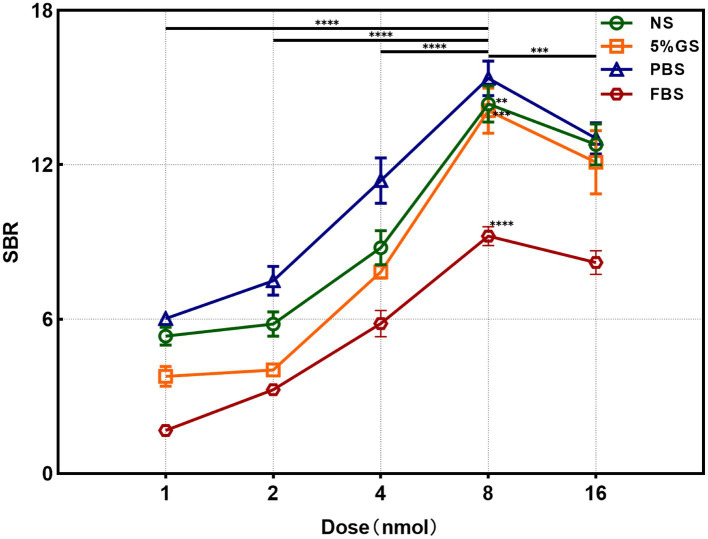
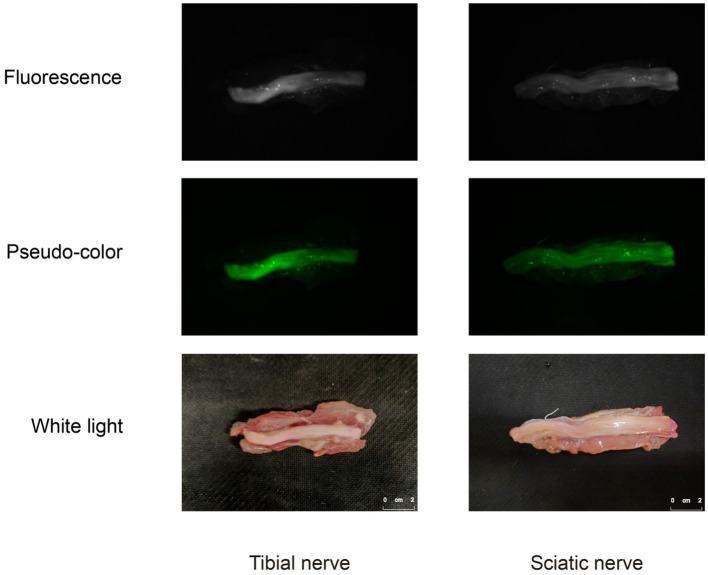
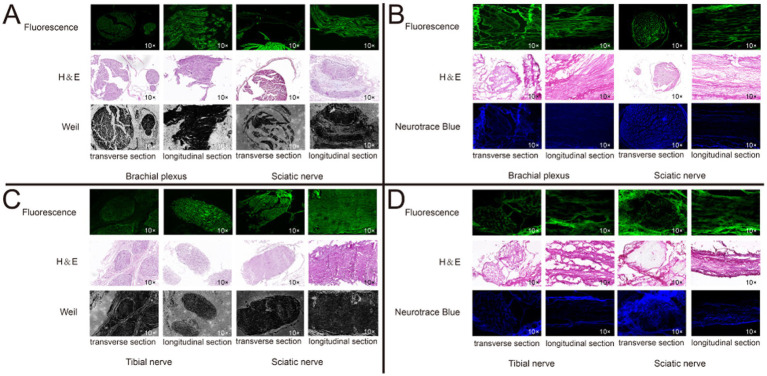
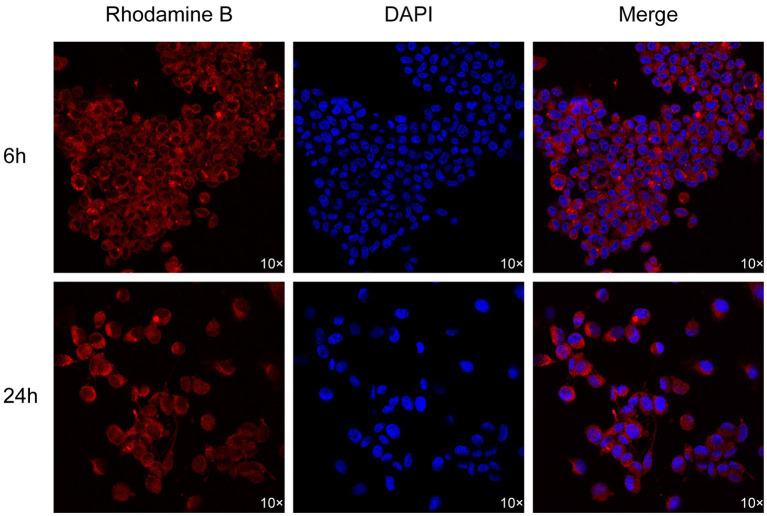
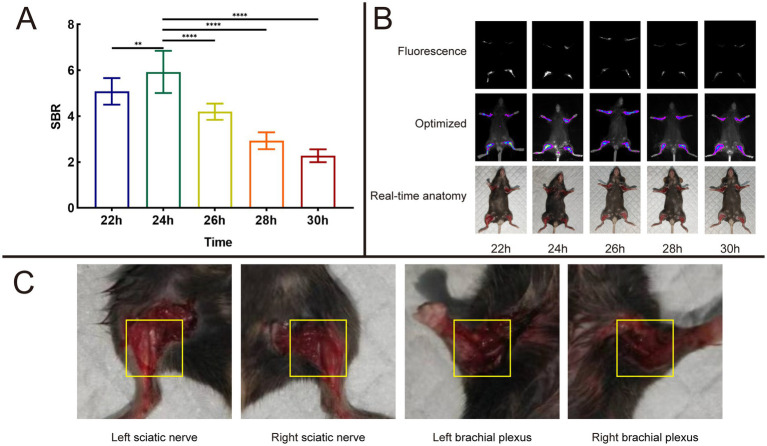
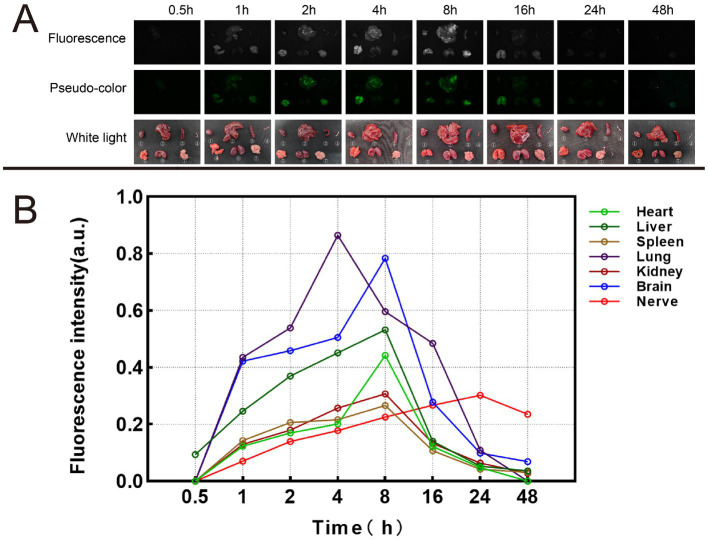
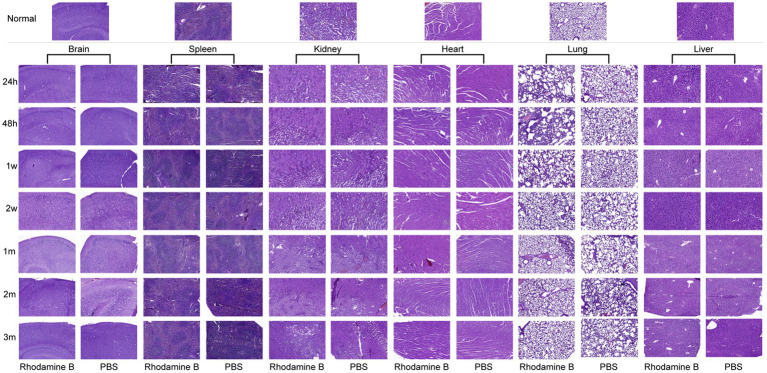
Methods: Phosphate buffered saline (PBS), normal saline (NS), 5% glucose solution (GS), and fetal bovine serum (FBS) were selected for measuring the fluorescence spectra of Rhodamine B solutions prepared in each formulation. Rhodamine B solutions, with varying doses dissolved in 100 μL of each formulation, were prepared and applied to the exposed PNs of the mice for incubation later. To ascertain the optimal formulation and dose of Rhodamine B, an analysis was performed on the signal-to-background ratio (SBR) of the nerves. Based on the experimental results, we proceeded to incubate Rhodamine B solution on the PN tissue of mice and human subjects, as well as on neuronal cells, to verify the binding sites of Rhodamine B with nerve. Subsequently, histological studies were conducted to validate the binding site between Rhodamine B and the nerves. Finally, we injected the optimal combination of Rhodamine B solution into mice via the tail vein and collected the SBR of mouse nerve tissues at different time intervals to determine the optimal pre-injection time. Fluorescence images of various tissues were collected, and Hematoxylin and Eosin (H&E) staining results were observed to determine the metabolism of Rhodamine B in mice and its toxicity.
Results: The excitation peak of Rhodamine B in PBS, NS, 5% GS, and FBS formulations was 554 nm, and the emission peak was 576 nm. In PBS group, the maximum SBR was 15.37 ± 0.68 while the dose of Rhodamine B was 8 nmol. Through ex-vivo validation on fresh human nerve tissue and verification using mouse and human tissue sections, we observed fluorescent signals of Rhodamine Bin the regions of nerve tissue and the fluorescence signals were all concentrated on the neuronal cell membranes. After injection, the fluorescent signal in nerve tissue reached its peak at 24 hours (h), coinciding with the highest SBR (5.93 ± 0.92) in mouse nerve tissues at this time point. Additionally, the fluorescence signal could be maintained for at least 48 h. Within 24 h, lung dilation and fusion of alveoli occurred. Then these pathological manifestations gradually diminished, returning to normal at 2 weeks (w), with no significant acute or chronic adverse reactions observed in other tissues.
Conclusion: Rhodamine B enables fluorescence imaging of PNs and has the potential for clinical translation.
Keywords: OMI technology; Rhodamine B; SBR; peripheral nerve; real-time fluorescence imaging.
Copyright © 2024 Wei, Guo, Wang, Zhang, Zhao, Han, Liu, Yang and Liang.
Conflict of interest statement
The authors declare that the research was conducted in the absence of any commercial or financial relationships that could be construed as a potential conflict of interest.
Figures
Similar articles
-
[Standard technical specifications for methacholine chloride (Methacholine) bronchial challenge test (2023)].Zhonghua Jie He He Hu Xi Za Zhi. 2024 Feb 12;47(2):101-119. doi: 10.3760/cma.j.cn112147-20231019-00247. Zhonghua Jie He He Hu Xi Za Zhi. 2024. PMID: 38309959 Chinese.
-
Real-time tissue perfusion assessment using fluorescence imaging topography scanning system: A preclinical investigation.Lasers Surg Med. 2022 Sep;54(7):994-1001. doi: 10.1002/lsm.23560. Epub 2022 Jun 2. Lasers Surg Med. 2022. PMID: 35652907
-
Ex Vivo Human Tissue Functions as a Testing Platform for the Evaluation of a Nerve-Specific Fluorophore.Mol Imaging Biol. 2025 Feb;27(1):23-31. doi: 10.1007/s11307-024-01968-0. Epub 2024 Dec 10. Mol Imaging Biol. 2025. PMID: 39658767
-
[A new approach for studying the retinal and choroidal circulation].Nippon Ganka Gakkai Zasshi. 2004 Dec;108(12):836-61; discussion 862. Nippon Ganka Gakkai Zasshi. 2004. PMID: 15656089 Review. Japanese.
-
Fluorescence Imaging of Nerves During Surgery.Ann Surg. 2019 Jul;270(1):69-76. doi: 10.1097/SLA.0000000000003130. Ann Surg. 2019. PMID: 30649014
Cited by
-
An update on recent advances in fluorescent materials for fluorescence molecular imaging: a review.RSC Adv. 2025 Jun 30;15(28):22267-22284. doi: 10.1039/d5ra03102h. eCollection 2025 Jun 30. RSC Adv. 2025. PMID: 40599579 Free PMC article. Review.
-
Evolution in optical molecular imaging techniques guided nerve imaging from 2009 to 2023: a bibliometric and visualization analysis.Front Neurol. 2025 Jan 22;15:1474353. doi: 10.3389/fneur.2024.1474353. eCollection 2024. Front Neurol. 2025. PMID: 39911740 Free PMC article.
References
LinkOut - more resources
Full Text Sources
Miscellaneous