Phylogeography, Historical Population Demography, and Climatic Modeling of Two Bird Species Uncover Past Connections Between Amazonia and the Atlantic Forest
- PMID: 39659732
- PMCID: PMC11628634
- DOI: 10.1002/ece3.70587
Phylogeography, Historical Population Demography, and Climatic Modeling of Two Bird Species Uncover Past Connections Between Amazonia and the Atlantic Forest
Abstract
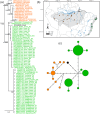
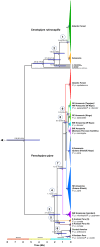
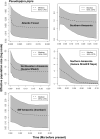
We combined mitochondrial DNA sequence data and paleoclimatic distribution models to document phylogeographic patterns and investigate the historical demography of two manakins, Ceratopipra rubrocapilla and Pseudopipra pipra, as well as to explore connections between Amazonia and the Atlantic Forest. ND2 sequences of C. rubrocapilla (75 individuals, 24 sites) and P. pipra (196, 77) were used in Bayesian inference and maximum likelihood analyses. We estimated mitochondrial nucleotide diversity, employed statistical tests to detect deviations from neutral evolution and constant population sizes, and used species distribution modeling to infer the location of suitable climate for both species under present-day conditions, the Last Glacial Maximum (LGM), and the Last Interglacial Maximum (LIG). Mitochondrial sequence data from C. rubrocapilla indicate one Amazonian and one Atlantic Forest haplogroup. In P. pipra, we recovered a highly supported and differentiated Atlantic Forest haplogroup embedded within a large Southern Amazonian clade. Genetic and taxonomic structure in Amazonia differs widely between these two species; older P. pipra has a more marked genetic structure and taxonomic differentiation relative to the younger C. rubrocapilla. Both species have similar genetic patterns in the Atlantic Forest. Paleoclimatic distribution models suggest connections between southwestern Amazonia and the southern Atlantic Forest during the LIG, but not between eastern Amazonia and the northeastern Atlantic Forest, as suggested by previous studies. This indicates that multiple corridors, and at different locations, may have been available over the Pliocene and Pleistocene between these two regions.
Keywords: Atlantic Forest; Ceratopipra rubrocapilla; Pseudopipra pipra; historical demography; mitochondrial DNA; phylogeography; species distribution modeling.
© 2024 The Author(s). Ecology and Evolution published by John Wiley & Sons Ltd.
Conflict of interest statement
The authors declare no conflicts of interest.
Figures


References
-
- Akaike, H. 1973. “Information Theory and an Extension of the Maximum Likelihood Principle.” In Second International Symposium on Information Theory, edited by Petrov B. N. and Csaki F., 267–281. Budapest, Hungary: Akademiai Kiado.
-
- Anderson, R. P. 2012. “Harnessing the World's Biodiversity Data: Promise and Peril in Ecological Niche Modeling of Species Distributions.” Annals of the New York Academy of Sciences 1260: 66–80. - PubMed
-
- Anderson, R. P. 2013. “A Framework for Using Niche Models to Estimate Impacts of Climate Change on Species Distributions.” Annals of the New York Academy of Sciences 1297: 8–28. - PubMed
-
- Anderson, R. P. , and Raza A.. 2010. “The Effect of the Extent of the Study Region on GIS Models of Species Geographic Distributions and Estimates of Niche Evolution: Preliminary Tests With Montane Rodents (Genus Nephelomys) in Venezuela.” Journal of Biogeography 37: 1378–1393.
-
- Auler, A. S. , and Smart P. L.. 2001. “Late Quaternary Paleoclimate in Semiarid Northeastern Brazil From U‐Series Dating of Travertine and Water‐Table Speleothems.” Quaternary Research 55: 159–167.
LinkOut - more resources
Full Text Sources
Miscellaneous

