. 2024 Oct 5;6(1):vdae172.
doi: 10.1093/noajnl/vdae172. eCollection 2024 Jan-Dec.

Genomic tumor evolution dictates human medulloblastoma progression

Affiliations

Genomic tumor evolution dictates human medulloblastoma progression

Yana Ruchiy et al. Neurooncol Adv. .

Abstract

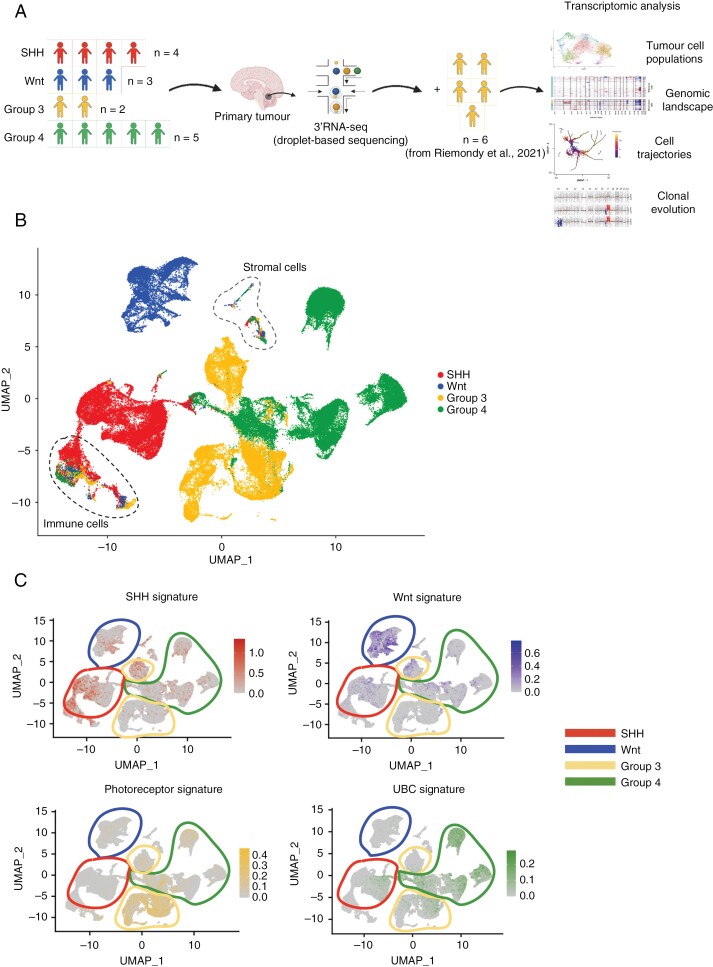
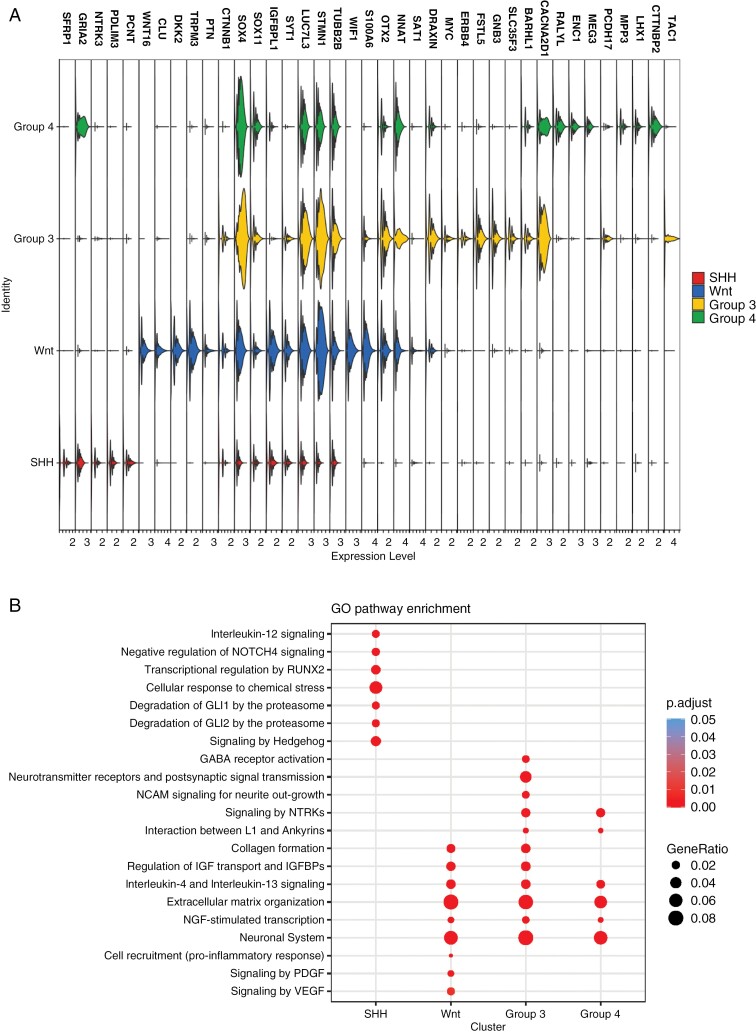
Background: Medulloblastoma (MB) is the most common high-grade pediatric brain tumor, comprised of 4 main molecular subgroups-sonic-hedgehog (SHH), Wnt, Group 3, and Group 4. Group 3 and Group 4 tumors are the least characterized MB subgroups, despite Group 3 having the worst prognosis (~50% survival rate), and Group 4 being the most prevalent. Such poor characterization can be attributed to high levels of inter- and intratumoral heterogeneity, making it difficult to identify common therapeutic targets.

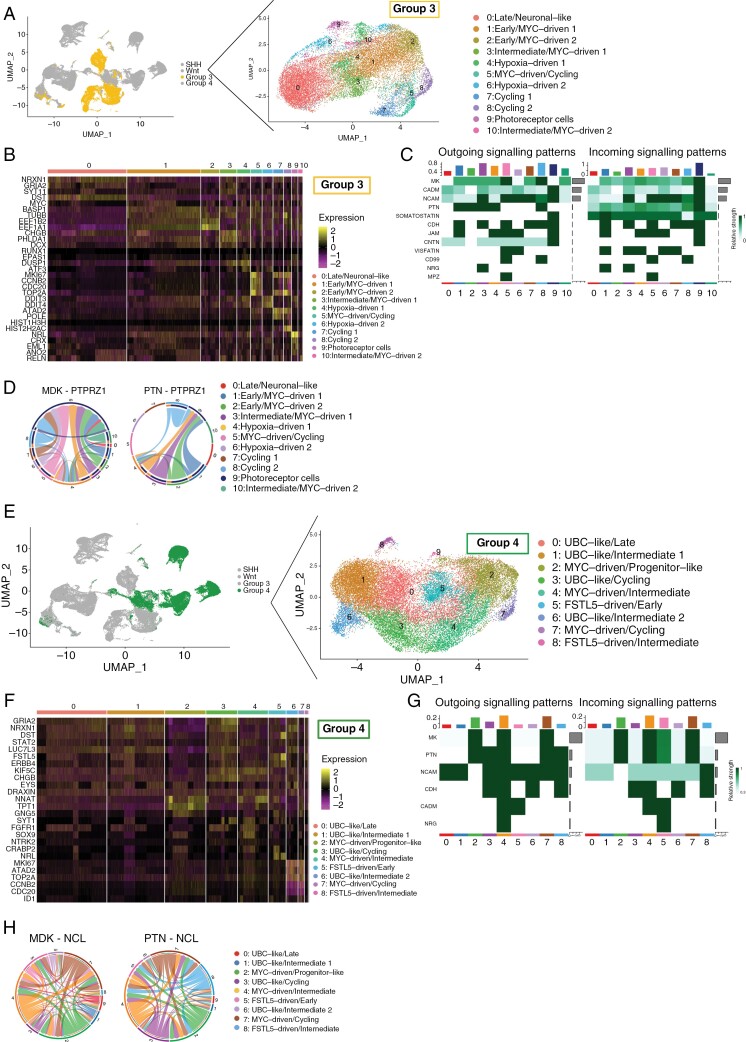
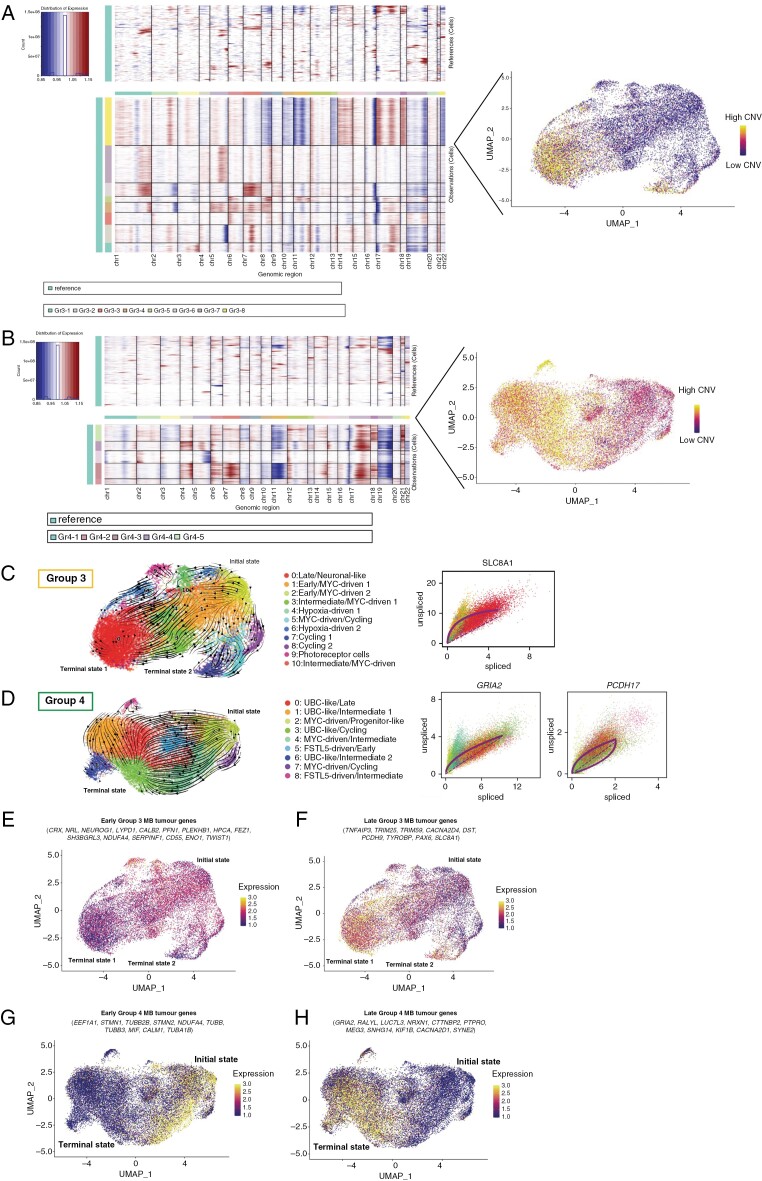
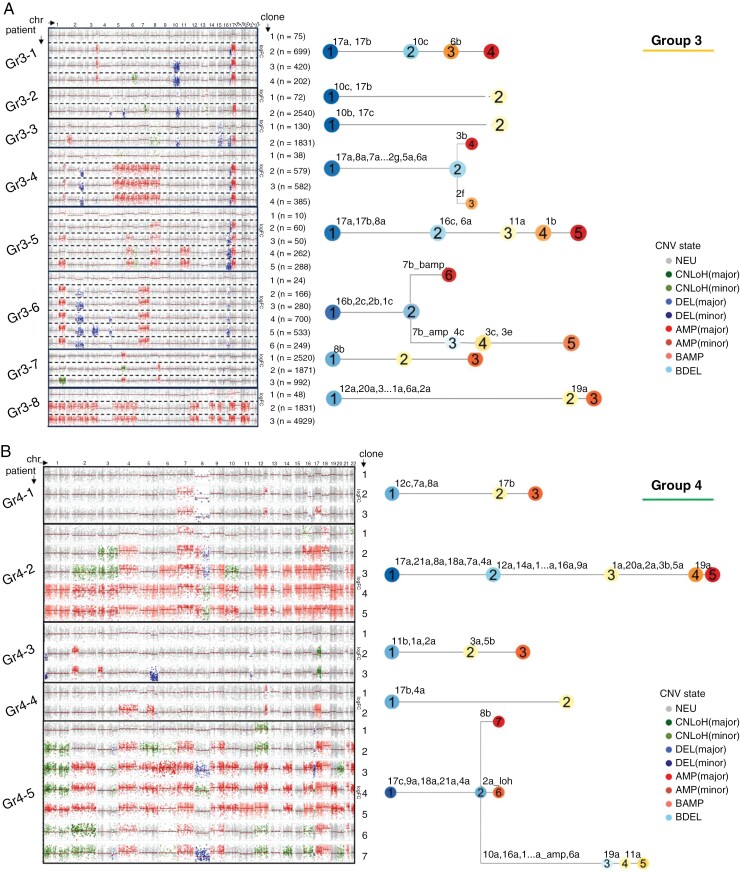
Methods: In this study, we generated single-cell sequencing data from 14 MB patients spanning all subgroups that we complemented with publicly available single-cell data from Group 3 patients. We used a ligand-receptor analysis tool (CellChat), expression- and allele-based copy-number variation (CNV) detection methods, and RNA velocity analysis to characterize tumor cell-cell interactions, established a connection between CNVs and temporal tumor progression, and unraveled tumor evolution.

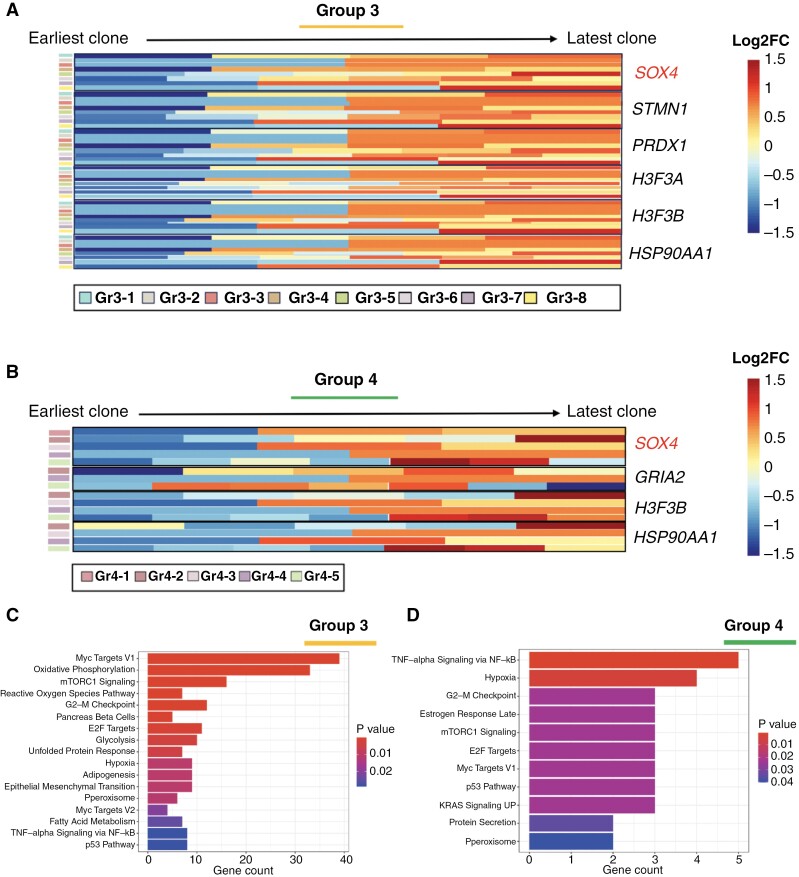
Results: We show that MB tumor cells follow a temporal trajectory from those with low CNV levels to those with high CNV levels, allowing us to identify early and late markers for SHH, Group 3, and Group 4 MBs. Our study also identifies SOX4 upregulation as a major event in later tumor clones for Group 3 and Group 4 MBs, suggesting it as a potential therapeutic target for both subgroups.

Conclusion: Taken together, our findings highlight MB's inherent tumor heterogeneity and offer promising insights into potential drivers of MB tumor evolution particularly in Group 3 and Group 4 MBs.

Keywords: medulloblastoma; single-cell sequencing; tumor heterogeneity.


Conflict of interest statement

All authors declare no conflict of interest.

Figures

Figure 1.
Figure 1.
Molecular programs of human medulloblastoma (MB) tumors show high levels of subgroup specificity. (A) Primary tumors of 14 MB patients were collected at Karolinska University Hospital and contained all 4 MB subgroups further supplemented with 6 Group 3 samples from Riemondy et al. (2022) dataset. (B) UMAP projection of 83,405 single cells from 20 patients shows subgroup-specific clustering. (C) Previously published subgroup-specific signatures projected onto a UMAP of 83 405 single cells from our dataset.
Figure 2.
Figure 2.
Medulloblastoma (MB) subgroups show upregulation of distinct gene groups and signaling pathways. (A) Violin plot showing selected subgroup-specific markers. (B) The enriched KEGG terms of top upregulated pathways in tumor cells for each MB subgroup. The statistical analysis was performed by over-representation test. The P-value was the number of randomized pairs exceeding the observed data. Benjamini–Hochberg method was used to adjust the P-value (<.05).
Figure 3.
Figure 3.
Intratumoral communications in Group 3 and Group 4 MB. Tumor cells were isolated from Group 3 (A), and Group 4 (E) medulloblastoma (MB) datasets and re-clustered yielding multiple tumor cell subpopulations. The cluster-specific markers were identified in the integrated Group 3 (n = 8) (B), and Group 4 (n = 5) (F) tumor datasets. Intratumoral signaling in Group 3 (C), and Group 4 MB (G) was analyzed using the computational tool CellChat and outgoing and incoming signaling was quantified based on the expression levels of ligands and their receptors, respectively. Selected significantly upregulated ligand−receptor pairs from the CellChat output in Group 3 (D) and Group 4 (H) MB showing cell clusters sending the signals via ligand expression and those receiving that signal via receptor expression.
Figure 4.
Figure 4.
Inference of copy-number variation (CNV) levels combined with cell trajectories reveals early and late markers in medulloblastoma (MB). (A) Single-cell CNV detection using InferCNV projected onto the UMAP of integrated Group 3, and Group 4 MB samples. Average CNV levels per cell were quantified as standard deviation from the normal expression based on the reference cells (immune and stromal cells from the same patients). Cell trajectories were projected onto the UMAPs of Group 3 (B) and Group 4 (C) MB cells showing the path from the initial and terminal state(s) (left) and the driver genes (right). Early and late subgroup-specific tumor markers of Group 3 (D) and Group 4 (E) MB were then derived using CNV levels and cellular trajectories.
Figure 5.
Figure 5.
Clonal evolution of Group 3 and Group 4 MB tumors. (A, B) Copy-number variation (CNV) in individual clones of the 8 Group 3 MB tumors (Gr3-1–Gr3-8) (A) and 5 Group 4 tumors (Gr4-1–Gr4-5) (B) shown as a heatmap with chromosomes (chr) as columns and clones as rows. Number of cells per clone are specified in brackets. Black lines separate the patients. Every CNV gained in each new clone is shown in each tumor’s phylogenetic tree with a chromosome number and the section of the chromosome affected (a, b, c, etc.).
Figure 6.
Figure 6.
Group 3 and Group 4 medulloblastoma (MB) tumors show transcriptomic similarities in the progression from earlier to later clones. DEG between earlier and later clones identified through Numbat in Group 3 (A) and Group 4 (B) tumors. Significantly enriched signaling pathways based on DEG between individual clones in Group 3 (C) and Group 4 (D) tumors. AMP = amplification; BAMP = balanced amplification; BDEL = balanced deletion; chr = chromosome; CNLoH = copy-neutral loss-of-heterozygosity; CNV = copy-number variation; DEL = deletion; NEU = neutral.

References

    1. Northcott PA, Korshunov A, Witt H, et al.Medulloblastoma comprises four distinct molecular variants. J Clin Oncol. 2011;29(11):1408–1414. - PMC - PubMed
    1. Thompson EM, Hielscher T, Bouffet E, et al.Prognostic value of medulloblastoma extent of resection after accounting for molecular subgroup: a retrospective integrated clinical and molecular analysis. Lancet Oncol. 2016;17(4):484–495. - PMC - PubMed
    1. Kool M, Korshunov A, Remke M, et al.Molecular subgroups of medulloblastoma: an international meta-analysis of transcriptome, genetic aberrations, and clinical data of WNT, SHH, Group 3, and Group 4 medulloblastomas. Acta Neuropathol. 2012;123(4):473–484. - PMC - PubMed
    1. Cavalli FMG, Remke M, Rampasek L, et al.Intertumoral heterogeneity within medulloblastoma subgroups. Cancer Cell. 2017;31(6):737–754.e6. - PMC - PubMed
    1. Riemondy KA, Venkataraman S, Willard N, et al.Neoplastic and immune single-cell transcriptomics define subgroup-specific intra-tumoral heterogeneity of childhood medulloblastoma. Neuro Oncol. 2022;24(2):273–286. - PMC - PubMed

LinkOut - more resources