. 2024 Nov 29;6(6):fcae433.
doi: 10.1093/braincomms/fcae433. eCollection 2024.

Lexical markers of disordered speech in primary progressive aphasia and 'Parkinson-plus' disorders

Affiliations

Lexical markers of disordered speech in primary progressive aphasia and 'Parkinson-plus' disorders

Shalom K Henderson et al. Brain Commun. .

Abstract

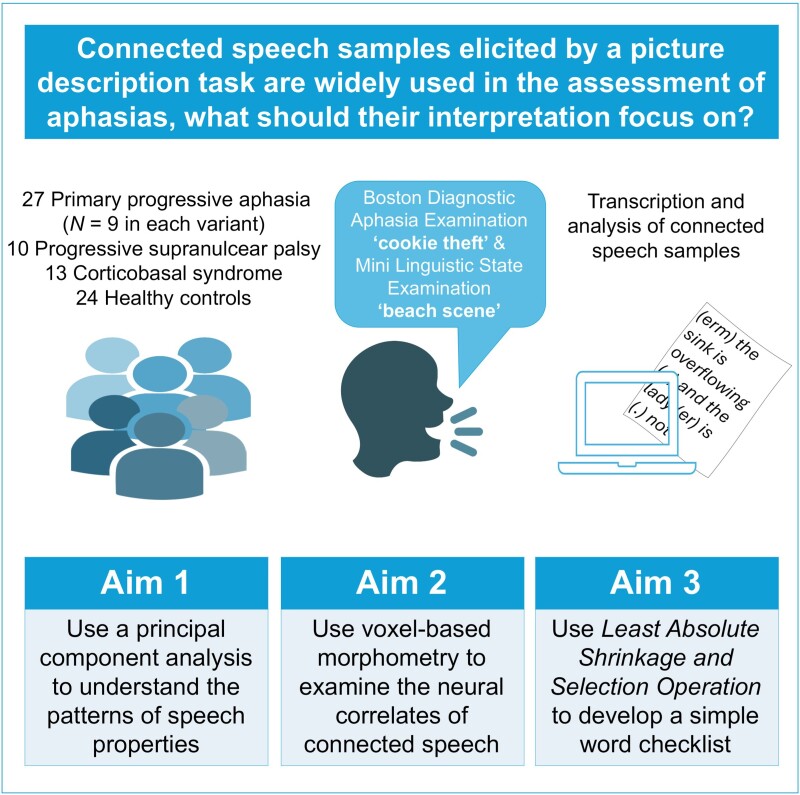
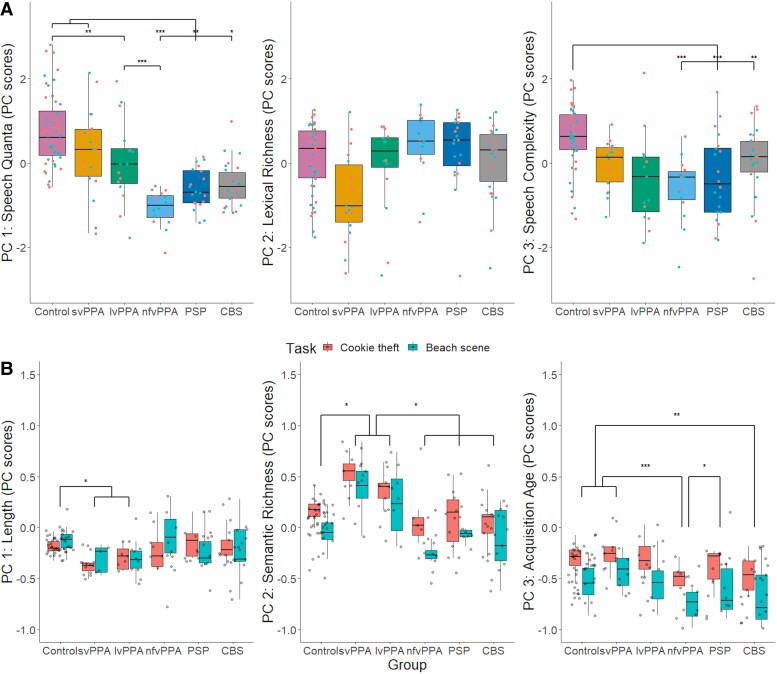
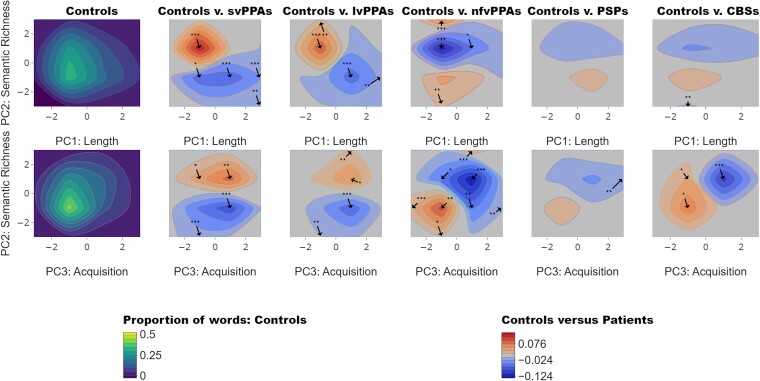
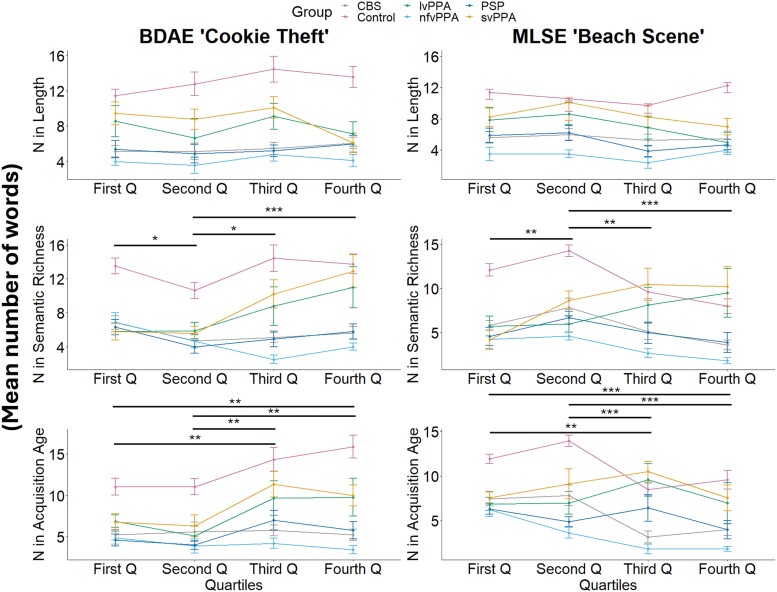
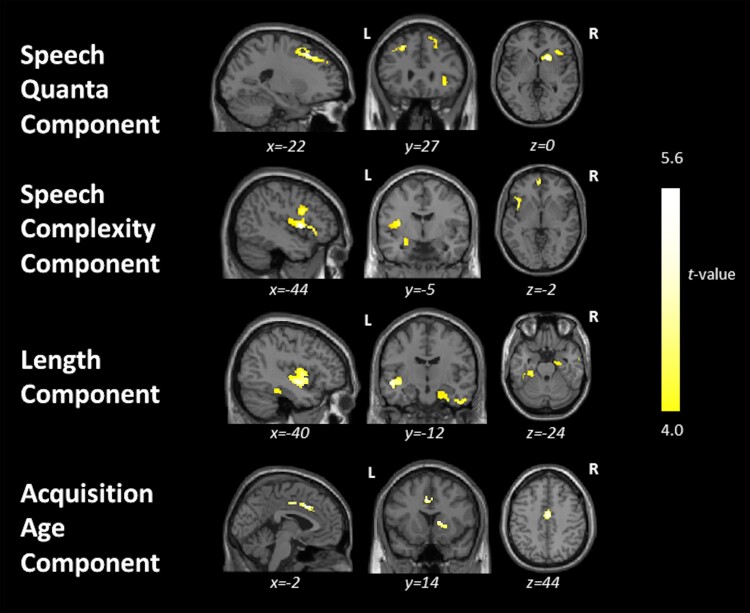
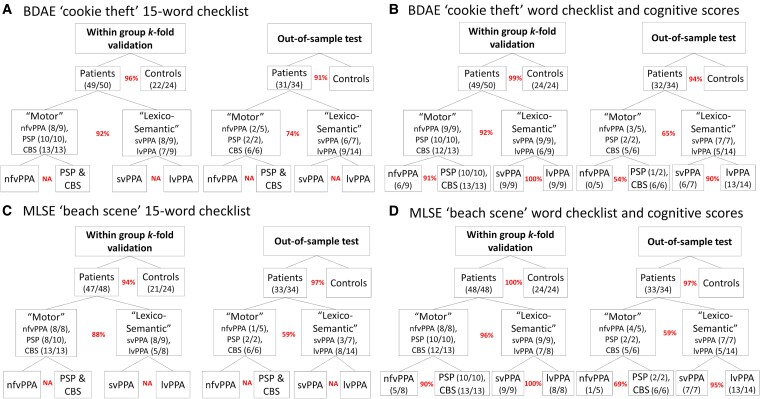
Connected speech samples elicited by a picture description task are widely used in the assessment of aphasias, but it is not clear what their interpretation should focus on. Although such samples are easy to collect, analyses of them tend to be time-consuming, inconsistently conducted and impractical for non-specialist settings. Here, we analysed connected speech samples from patients with the three variants of primary progressive aphasia (semantic, svPPA N = 9; logopenic, lvPPA N = 9; and non-fluent, nfvPPA N = 9), progressive supranuclear palsy (PSP Richardson's syndrome N = 10), corticobasal syndrome (CBS N = 13) and age-matched healthy controls (N = 24). There were three principal aims: (i) to determine the differences in quantitative language output and psycholinguistic properties of words produced by patients and controls, (ii) to identify the neural correlates of connected speech measures and (iii) to develop a simple clinical measurement tool. Using data-driven methods, we optimized a 15-word checklist for use with the Boston Diagnostic Aphasia Examination 'cookie theft' and Mini Linguistic State Examination 'beach scene' pictures and tested the predictive validity of outputs from least absolute shrinkage and selection operator (LASSO) models using an independent clinical sample from a second site. The total language output was significantly reduced in patients with nfvPPA, PSP and CBS relative to those with svPPA and controls. The speech of patients with lvPPA and svPPA contained a disproportionately greater number of words of both high frequency and high semantic diversity. Results from our exploratory voxel-based morphometry analyses across the whole group revealed correlations between grey matter volume in (i) bilateral frontal lobes with overall language output, (ii) the left frontal and superior temporal regions with speech complexity, (iii) bilateral frontotemporal regions with phonology and (iv) bilateral cingulate and subcortical regions with age of acquisition. With the 15-word checklists, the LASSO models showed excellent accuracy for within-sample k-fold classification (over 93%) and out-of-sample validation (over 90%) between patients and controls. Between the motor disorders (nfvPPA, PSP and CBS) and lexico-semantic groups (svPPA and lvPPA), the LASSO models showed excellent accuracy for within-sample k-fold classification (88-92%) and moderately good (59-74%) differentiation for out-of-sample validation. In conclusion, we propose that a simple 15-word checklist provides a suitable screening test to identify people with progressive aphasia, while further specialist assessment is needed to differentiate accurately some groups (e.g. svPPA versus lvPPA and PSP versus nfvPPA).

Keywords: Parkinson-plus disorders; connected speech; lexico-semantic word properties; picture description word checklist; primary progressive aphasia.


Conflict of interest statement

The authors report no competing interests.

Figures

Graphical Abstract
Graphical Abstract
Figure 1
Figure 1
PCA scores across diagnostic groups. (A) Scores of quantitative measures of speech fluency. For PC 1 (‘speech quanta’), the results from a one-way ANOVA revealed significant group differences [F(1142) = 71.19, P < 0.001], driven by controls (N = 24) and patients with svPPA (N = 9) having higher scores than those with nfvPPA (N = 9), PSP (N = 10) and CBS (N = 13), controls having higher scores than those with lvPPA (N = 9) and patients with lvPPA having higher scores than those with nfvPPA. PC 2 (‘lexical richness’) resulted in no group differences [F(1142) = 1.26, P = 0.26], and for PC 3 (‘speech complexity’), significant group differences were found [F(1142) = 12.77, P < 0.001], driven by controls having higher scores than patients with nfvPPA (P < 0.001), PSP (P < 0.001) and CBS (P = 0.002). (B) Scores of quantitative measures of word properties across groups. For PC 1 (‘length’), the results from a two-way ANOVA revealed significant group differences [F(5134) = 4.29, P < 0.001], driven by svPPA and lvPPA patients producing words that were shorter, phonologically and orthographically less complex than controls (P < 0.05). For PC 2 (‘semantic richness’), significant differences were found for group [F(5134) = 16.62, P < 0.001] and task [F(1134) = 22.05, P < 0.001]. Patients with svPPA and lvPPA produced more words that were characterized as more frequent and semantically diverse than those with nfvPPA, PSP, CBS and controls (P < 0.01). For PC 3 (‘acquisition age’), significant differences were found for group [F(5134) = 7.09, P < 0.001] and task [F(1134) = 50.24, P < 0.001]. Post hoc analyses revealed that (i) nfvPPA patients produced words that were characterized as significantly earlier acquired than those with svPPA (P < 0.001), PSP (P = 0.05) and controls (P < 0.001) and (ii) CBS patients used words that were significantly earlier acquired than those with svPPA (P = 0.002) and controls (P = 0.01). Results from post hoc analyses using Tukey’s honestly significant difference test for multiple comparisons are shown as asterisks indicating level of significance: *P ≤ 0.05; **P ≤ 0.01; ***P ≤ 0.001. CBS, corticobasal syndrome; lvPPA, logopenic variant of primary progressive aphasia; nfvPPA, non-fluent variant of primary progressive aphasia; PC, principal component; PSP, progressive supranuclear palsy; svPPA, semantic variant of primary progressive aphasia.
Figure 2
Figure 2
Contour distributions and difference plots. The top and bottom left plots show the contour distributions across PC 1 (length), PC 2 (semantic richness) and PC 3 (acquisition age) produced by healthy controls. Difference plots comparing patients with healthy controls are shown to the right of the contour plots of healthy controls. In the control plots, yellow tones show where the greatest proportions of words were found within the PC space. For controls versus patients, the red and blue tones represent PC spaces where patients produced more words than controls and where controls produced more than patients, respectively. Taking the mean value of the proportion of words produced by each patient group (svPPA N = 9, lvPPA N = 9, nfvPPA N = 9, PSP N = 10 and CBS N = 13), we compared them to the control data (N = 24) in each of the dimensional spaces using two-tailed t-tests. The arrows indicate where in the maps there were significant differences between controls and patients (P-values are shown as asterisks indicating level of significance: *P < 0.05; **P < 0.01; ***P < 0.001). CBS, corticobasal syndrome; lvPPA, logopenic variant of primary progressive aphasia; nfvPPA, non-fluent variant of primary progressive aphasia; PSP, progressive supranuclear palsy; svPPA, semantic variant of primary progressive aphasia.
Figure 3
Figure 3
Distribution plots. Each plot shows the mean number of words produced in each quartile (Q) by patient groups (svPPA N = 9, lvPPA N = 9, nfvPPA N = 9, PSP N = 10 and CBS N = 13) for PC 1 ‘length’, PC 2 ‘semantic richness’ and PC 3 ‘acquisition age’. For PC 1, a six groups × four quartiles repeated measures ANOVA showed a significant effect of group for both ‘cookie theft’ [F(5283) = 37.16, P < 0.001] and ‘beach scene’ [F(5272) = 39.18, P < 0.001]. For PC 2, significant effects were found for group [F(5280) = 33.68, P < 0.001], quartile [F(1280) = 4.67, P = 0.03] and group-by-quartile interaction [F(5280) = 4.36, P < 0.001] for ‘cookie theft’. For ‘beach scene’, significant effects were found for group [F(5270) = 28.94, P < 0.001], quartile [F(1270) = 5.53, P = 0.02] and group-by-quartile interaction [F(5270) = 8.29, P < 0.001]. For PC 3, significant effects were found for group [F(5283) = 36.15, P < 0.001], quartile [F(1283) = 17.17, P < 0.001] and group-by-quartile interaction [F(5283) = 2.47, P = 0.03] for ‘cookie theft’. For ‘beach scene’, significant effects were found for group [F(5265) = 31.04, P < 0.001], quartile [F(1265) = 21.67, P < 0.001] and group-by-quartile interaction [F(5265) = 2.47, P = 0.03]. The effect of quartile from post hoc analyses using Tukey’s honestly significant difference test for multiple comparisons is shown as asterisks indicating level of significance: *P ≤ 0.05; **P ≤ 0.01; ***P ≤ 0.001. BDAE, Boston Diagnostic Aphasia Examination; CBS, corticobasal syndrome; lvPPA, logopenic variant of primary progressive aphasia; MLSE, Mini Linguistic State Examination; nfvPPA, non-fluent variant of primary progressive aphasia; PSP, progressive supranuclear palsy; svPPA, semantic variant of primary progressive aphasia.
Figure 4
Figure 4
Results from the whole-brain VBM correlation analyses. This figure shows regions of grey matter intensity that uniquely correlate with PC scores in the whole group including controls (N = 24) and patients (svPPA N = 9, lvPPA N = 9, nfvPPA N = 9, PSP N = 10 and CBS N = 13) using t-contrasts. Clusters were extracted using a threshold of P < 0.001 uncorrected for multiple comparisons with a cluster threshold of 100 voxels with age and total intracranial volume included as nuisance covariates. CBS, corticobasal syndrome; lvPPA, logopenic variant of primary progressive aphasia; nfvPPA, non-fluent variant of primary progressive aphasia; PSP, progressive supranuclear palsy; svPPA, semantic variant of primary progressive aphasia.
Figure 5
Figure 5
Within-sample k-fold and out-of-sample validations. This figure summarizes the validations for (A) BDAE ‘cookie theft’ 15-word checklist, (B) BDAE ‘cookie theft’ 15-word checklist with cognitive measures of ACE-R and MLSE, (C) MLSE ‘beach scene’ 15-word checklist and (D) MLSE ‘beach scene’ 15-word checklist with cognitive measures of ACE-R and MLSE. The curved brackets under or next to the group names (e.g. Patients, ‘Motor’ and ‘Lexico-Semantic’) illustrate the number of participants who were classified correctly out of the total N. The percentages in red indicate the within-sample 4-fold and out-of-sample validation accuracies. ACE-R, Addenbrooke’s Cognitive Examination Revised; BDAE, Boston Diagnostic Aphasia Examination; CBS, corticobasal syndrome; lvPPA, logopenic variant of primary progressive aphasia; MLSE, Mini Linguistic State Examination; nfvPPA, non-fluent variant of primary progressive aphasia; PSP, progressive supranuclear palsy; svPPA, semantic variant of primary progressive aphasia.

References

    1. Boschi V, Catricalà E, Consonni M, Chesi C, Moro A, Cappa SF. Connected speech in neurodegenerative language disorders: A review. Front Psychol. 2017;8:269. - PMC - PubMed
    1. Ash S, Evans E, O'Shea J, et al. Differentiating primary progressive aphasias in a brief sample of connected speech. Neurology. 2013;81(4):329–336. - PMC - PubMed
    1. Fromm D, Greenhouse J, Pudil M, Shi Y, MacWhinney B. Enhancing the classification of aphasia: A statistical analysis using connected speech. Aphasiology. 2022;36(12):1492–1519. - PMC - PubMed
    1. Bird H, Lambon Ralph MA, Patterson K, Hodges JR. The rise and fall of frequency and imageability: Noun and verb production in semantic dementia. Brain Lang. 2000;73(1):17–49. - PubMed
    1. Hoffman P, Meteyard L, Patterson K. Broadly speaking: Vocabulary in semantic dementia shifts towards general, semantically diverse words. Cortex. 2014;55:30–42. - PubMed

LinkOut - more resources