. 2024 Jun 27:23:2837-2850.
doi: 10.1016/j.csbj.2024.06.008. eCollection 2024 Dec.

Exploring sperm cell motion dynamics: Insights from genetic algorithm-based analysis

Affiliations

Exploring sperm cell motion dynamics: Insights from genetic algorithm-based analysis

Anke Klingner et al. Comput Struct Biotechnol J. .

Abstract

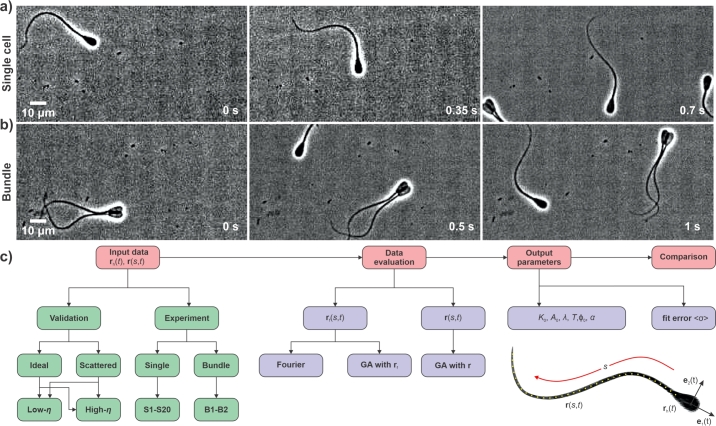
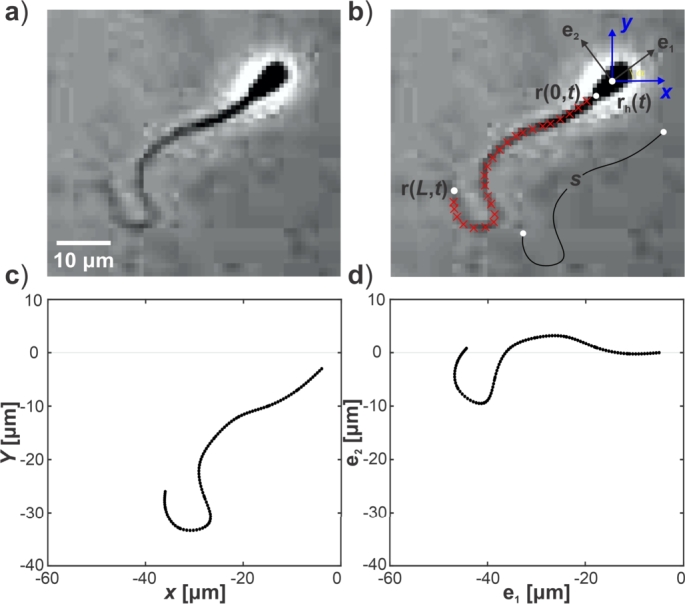
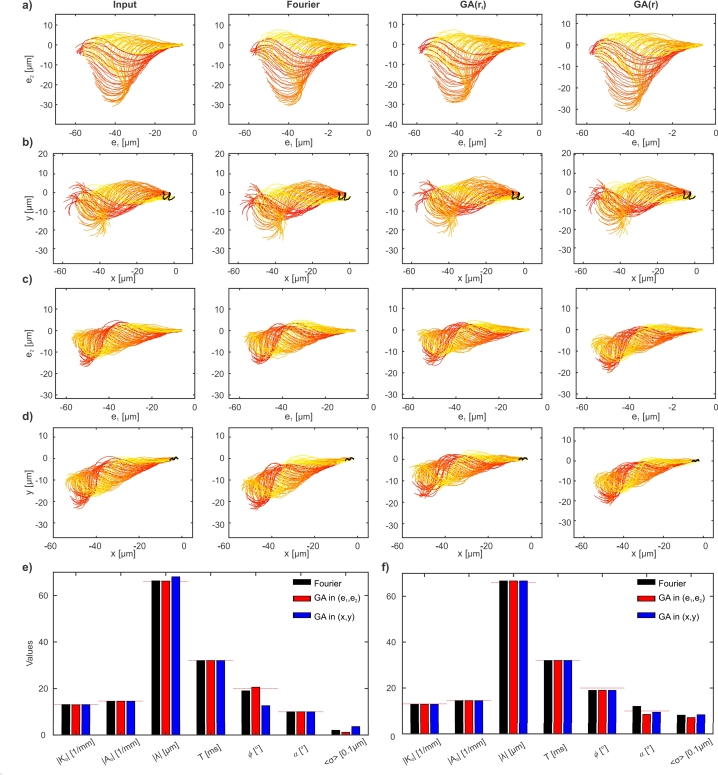
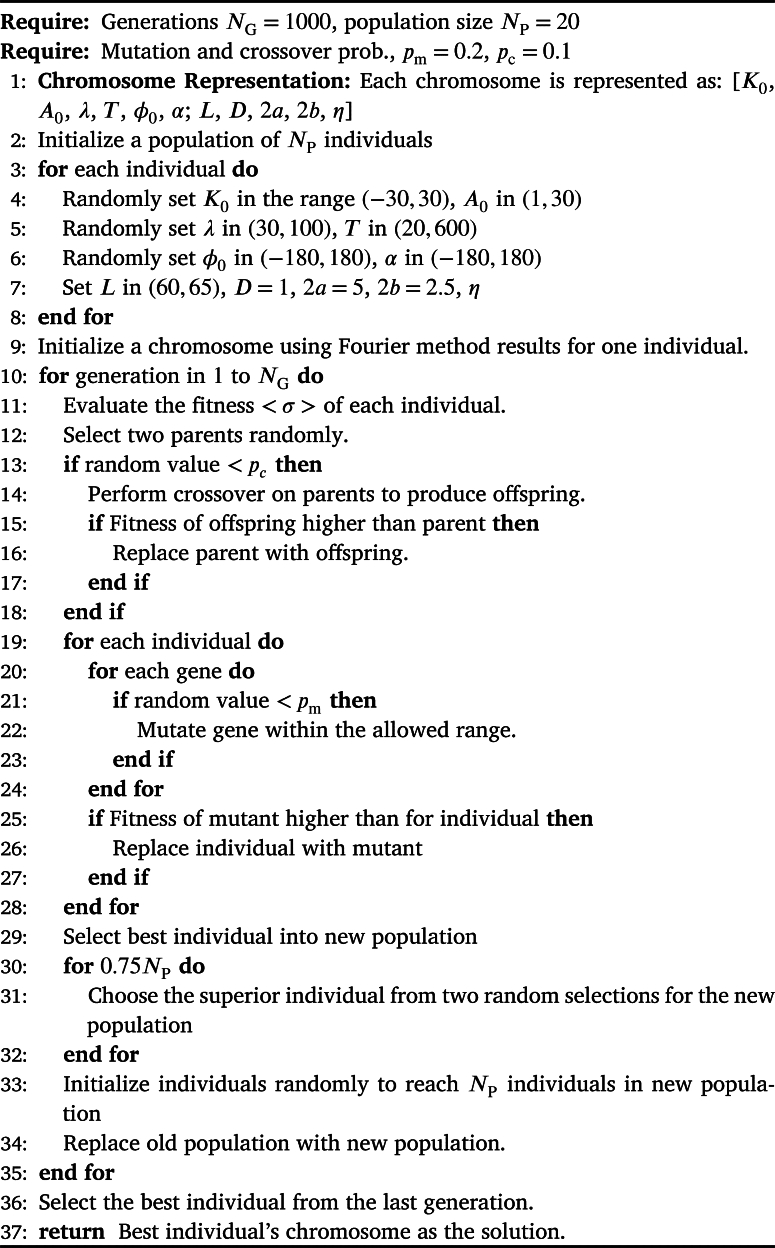
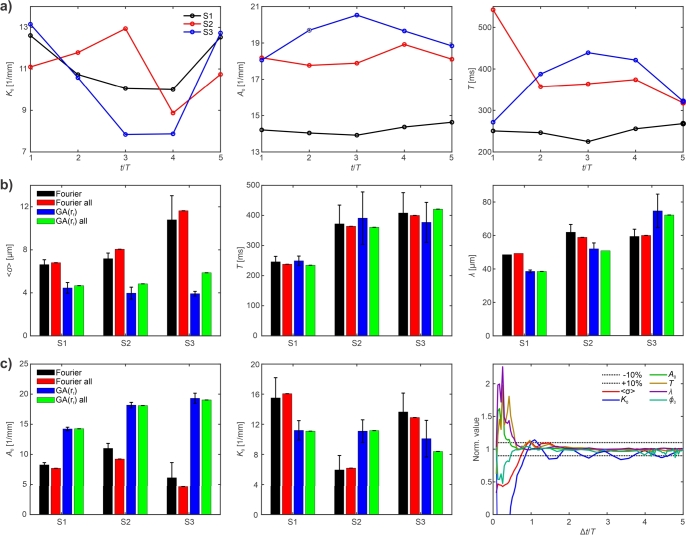
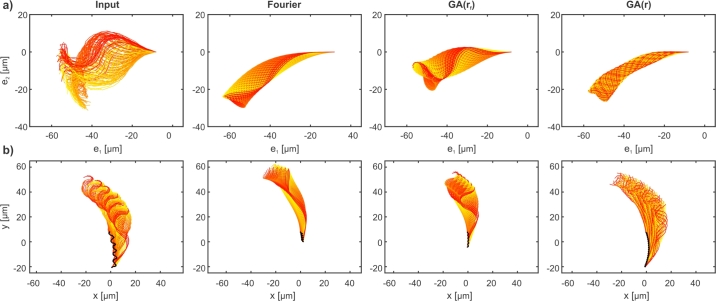
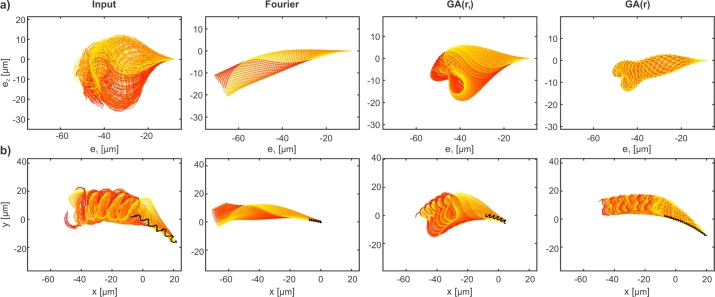
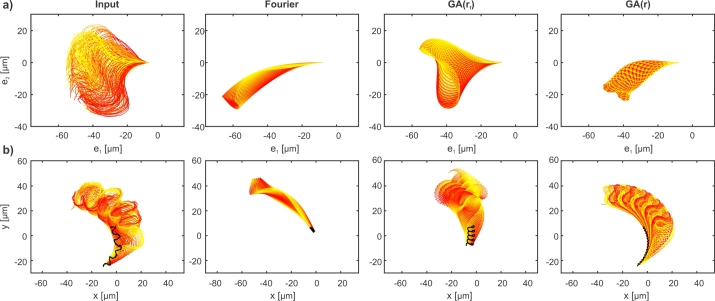
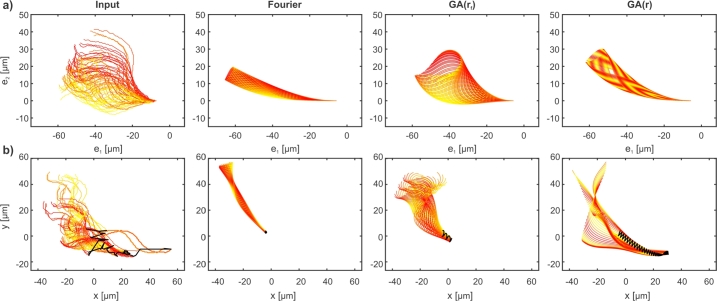
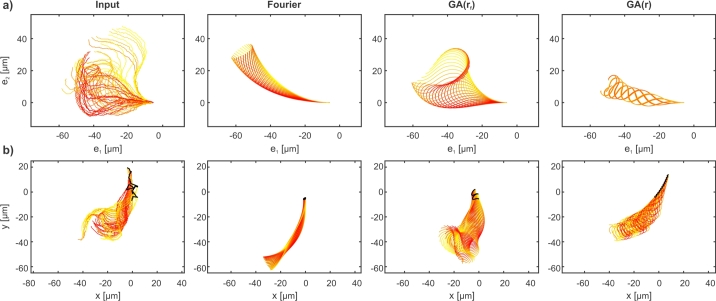
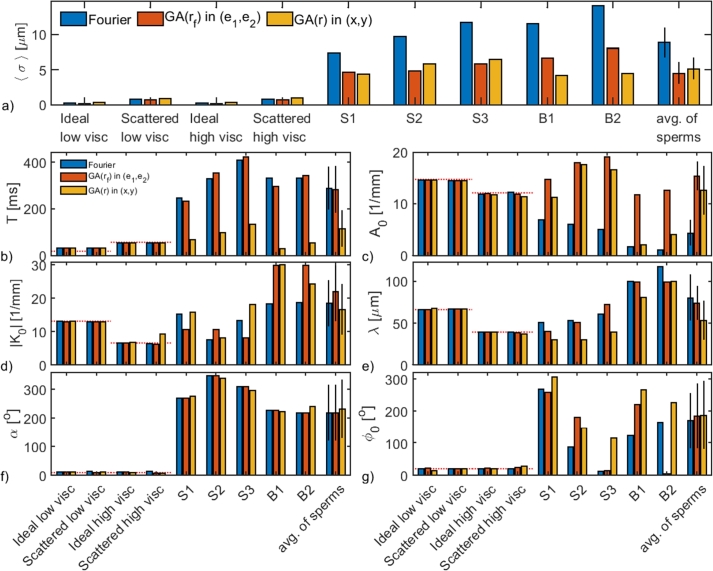
Accurate analysis of sperm cell flagellar dynamics plays a crucial role in understanding sperm motility as flagella parameters determine cell behavior in the spatiotemporal domain. In this study, we introduce a novel approach by harnessing Genetic Algorithms (GA) to analyze sperm flagellar motion characteristics and compare the results with the traditional decomposition method based on Fourier analysis. Our analysis focuses on extracting key parameters of the equation approximating flagellar shape, including beating period time, bending amplitude, mean curvature, and wavelength. Additionally, we delve into the extraction of phase constants and initial swimming directions, vital for the comprehensive study of sperm cell pairs and bundling phenomena. One significant advantage of GA over Fourier analysis is its ability to integrate sperm cell motion data, enabling a more comprehensive analysis. In contrast, Fourier analysis neglects sperm cell motion by transitioning to a sperm-centered coordinate system (material system). In our comparative study, GA consistently outperform the Fourier analysis-based method, yielding a remarkable reduction in fitting error of up to 70% and on average by 45%. An in-depth exploration of the sperm cell motion becomes indispensable in a wide range of applications from complexities of reproductive biology and medicine, to developing soft flagellated microrobots.

Keywords: Biological motion; Flagellum deformation; Genetic algorithm; Motion analysis; Sperm cell dynamics.


Conflict of interest statement

The authors declare no conflicts of interest.

Figures

Fig. 1
Fig. 1
Videos covering several beat cycles of a) single cells and b) bundles of two sperm cells are used to extract experimental input data such as temporal sperm head position rh(t) and spaciotemporal flagellum shape r(s,t) in laboratory coordinate system. c) Schematic flowchart of implemented processes for input data acquisition, data evaluation methods, and output parameter extraction. Beside experimental input data, ideal and scattered validation data is created for testing of the data evaluation methods. Then, data evaluation methods Fourier, GA with rf and GA with r are applied. They are either based on input data in laboratory system or on data rf(s,t) which is the spaciotemporal flagellum shape in shifted material coordinate system fixed to position of sperm head. Output parameters mean curvature K0, beating amplitude A0, wavelength λ, period time T, initial phase shift ϕ0, initial swimming direction α and fit error <σ> are extracted and compared.
Fig. 2
Fig. 2
Video of a sperm cell a) video frame at one time instant, b) head position rh(t) (white dot) and flagellum shape r(s,t) (red crosses) are automatically detected in lab system x − y using video analysis. c) Flagellum shape r(s,t) in lab system x − y. d) Flagellum shape rf(s,t) in material system eˆ1eˆ2. This detection is done for all video frames for several beat cycles to obtain experimental input data.
Fig. 3
Fig. 3
Validation of data evaluation methods by usage of scattered test data. Left column: Scattered test data calculated by known parameters. Second column: Fourier analysis. Third column: results of GA(rf) optimizing agreement of input data with simulated beating shape in material system. Right column: results of GA(r) optimizing agreement of input data with simulated beating shape in lab system. Beating shapes are shown for a) low viscosity in material system eˆ1eˆ2, b) low viscosity in lab system x − y, c) high viscosity in material system eˆ1eˆ2 and d) high viscosity in lab system x − y. Movement of proximal flagellum end r(0,t) (black). e) Comparison of achieved output parameters mean curvature K0, beating amplitude A0, wavelength λ, period time T, initial phase shift ϕ0, initial swimming direction α and fit error <σ> in comparison to input parameters (red dashed horizontal lines) for low viscosity, scattered input data. All methods Fourier analysis (black), GA(rf) (red) and GA(r) (blue) give good agreement with input parameters. Fit error <σ> is below 1μm. Angles α (initial swimming direction) and ϕ0 (initial phase shift) have the largest uncertainty.
Algorithm 1
Algorithm 1
Genetic algorithm for flagellar dynamics.
Fig. 4
Fig. 4
Results for experimental input data from sperm cells S1-S3. a) Changes of mean curvature K0, beating amplitude A0 and period time T versus time for 5 period times for S1 (black), S2 (red), S3 (blue) using method GA(rf). b) Comparison of the parameters fit error 〈σ〉, period time T, wavelength λ, beating amplitude A0, mean curvature K0, achieved for Fourier method and GA(rf), either averaged for individually analyzed separate 5 periods or for total 5 periods (all). Fit error is 412μm and increases slightly if data from 5 periods is included instead of one period. GA(rf) has smaller fit error than Fourier method. Period times are in the same range for all methods. Beating amplitude achieved by GA(rf) is larger than by Fourier method. c) Normalized parameters for different time intervals by GA(rf). If data from less than one period is included in the analysis, the achieved parameters vary strongly. More than one period should be included to get variations less than 10 %. Therefore, typically about three periods are included in further analysis.
Fig. 5
Fig. 5
Beating shapes for input data from sperm cell S1 and calculated from parameters a) in material system eˆ1eˆ2, b) in lab system x − y. Input data (left), Fourier (second column), GA(rf) optimizes agreement of input data with simulated beating shape in material system (third column), GA(r) optimizes agreement of input data with simulated beating shape in lab system (right). Movement of proximal flagellum end r(0,t) (black). Beating shape and length, direction and curvature of proximal flagellum end movement are in good agreement for GA(r).
Fig. 6
Fig. 6
Beating shapes for input data from sperm cell S2 and calculated from parameters a) in material system eˆ1eˆ2, b) in lab system x − y. Input data (left), Fourier (second column), GA(rf) optimizes agreement of input data with simulated beating shape in material system (third column), GA(r) optimizes agreement of input data with simulated beating shape in lab system (right). Movement of proximal flagellum end r(0,t) (black). Beating shape and length, direction and curvature of proximal flagellum end movement are in good agreement for GA(r).
Fig. 7
Fig. 7
Beating shapes for input data from sperm cell S3 and calculated from parameters a) in material system eˆ1eˆ2, b) in lab system x − y. Input data (left), Fourier (second column), GA(rf) optimizes agreement of input data with simulated beating shape in material system (third column), GA(r) optimizes agreement of input data with simulated beating shape in lab system (right). Movement of proximal flagellum end r(0,t) (black). Beating shape and length, direction and curvature of proximal flagellum end movement are in good agreement for GA(r).
Fig. 8
Fig. 8
Beating shapes for input data from sperm cell B1 and calculated from parameters a) in material system eˆ1eˆ2, b) in lab system x − y. Input data (left), Fourier (second column), GA(rf) optimizes agreement of input data with simulated beating shape in material system (third column), GA(r) optimizes agreement of input data with simulated beating shape in lab system (right). Movement of proximal flagellum end r(0,t) (black).
Fig. 9
Fig. 9
Beating shapes for input data from sperm cell B2 and calculated from parameters a) in material system eˆ1eˆ2, b) in lab system x − y. Input data (left), Fourier (second column), GA(rf) optimizes agreement of input data with simulated beating shape in material system (third column), GA(r) optimizes agreement of input data with simulated beating shape in lab system (right). Movement of proximal flagellum end r(0,t) (black).
Fig. 10
Fig. 10
Comparison of a) fit error, b) period time, c) bending amplitude, d) mean curvature, e) wavelength, f) initial orientation and g) phase constant for test data (ideal and scattered at low and high viscosity), five experimental data sets (S1, S2, S3, B1, B2) and average of 22 sperm cells analysed by Fourier (blue), genetic algorithm in material system GA(rf) (red) and genetic algorithm in laboratory system GA(r) (yellow). Input parameters for validation data are indicated by red horizontal lines. Functionality of data evaluation methods was proven by low fit error for validation data. For experimental data, fit error is lowest for GA(rf), then GA(r) and highest for Fourier. Time periods found by Fourier and GA(rf) agree well. GA(rf) finds typically lower values for period time. Genetic algorithm methods find typically higher bending amplitude than Fourier. Other output parameters show similar range. Therefore, GA(rf) is suggested as alternative or improvement for Fourier.

Similar articles

Cited by

References

    1. Bayly P.V., Lewis B.L., Ranz E.C., Okamoto R.J., Pless R.B., Dutcher S.K. Propulsive Forces on the Flagellum during Locomotion of Chlamydomonas reinhardtii. Biophys J. 2011;100:2716–2725. - PMC - PubMed
    1. Dai C., Zhang Z., Huang J., Wang X., Ru C., Pu H., et al. Automated non-invasive measurement of single sperm's motility and morphology. IEEE Trans Med Imaging. 2018;37(10):2257–2265. - PubMed
    1. Das C., Mokashi C., Mande S.S., Saini S. Dynamics and control of flagella assembly in Salmonella typhimurium. Front Cell Infect Microbiol. 2018;8:36. - PMC - PubMed
    1. Farrell P.B., Presicce G.A., Brockett C.C., Foote R.H. Quantification of bull sperm characteristics measured by computer-assisted sperm analysis (CASA) and the relationship to fertility. Biophys J. 2011;49(4):871–879. doi: 10.1016/S0093-691X(98)00036-3. - DOI - PubMed
    1. Friedrich B.M., Riedel-Kruse I.H., Howard J., Jülicher F. High-precision tracking of sperm swimming fine structure provides strong test of resistive force theory. J Exp Biol. 2010;213:1226–1234. doi: 10.1242/jeb.039800. - DOI - PubMed

LinkOut - more resources