. 2025 Jan 21;10(1):e0045724.
doi: 10.1128/msystems.00457-24. Epub 2024 Dec 11.

Multi-omics analysis reveals the interplay between intratumoral bacteria and glioma

Affiliations

Multi-omics analysis reveals the interplay between intratumoral bacteria and glioma

Ting Li et al. mSystems. .

Abstract

Emerging evidence highlights the potential impact of intratumoral microbiota on cancer. However, the microbial composition and function in glioma remains elusive. Consequently, our study aimed to investigate the microbial community composition in glioma tissues and elucidate its role in glioma development. We parallelly performed microbial profiling, transcriptome sequencing, and metabolomics detection on tumor and adjacent normal brain tissues obtained from 50 glioma patients. We employed immunohistochemistry, multicolor immunofluorescence, and fluorescence in situ hybridization (FISH) staining to observe the presence and location of bacteria. Furthermore, an animal model was employed to validate the impact of key bacteria on glioma development. Six genera were found to be significantly enriched in glioma tissues compared to adjacent normal brain tissues, including Fusobacterium, Longibaculum, Intestinimonas, Pasteurella, Limosilactobacillus, and Arthrobacter. Both bacterial RNA and lipopolysaccharides (LPS) were observed in glioma tissues. Integrated microbiomics, transcriptomics, and metabolomics revealed that genes associated with intratumoral microbes were enriched in multiple synapse-associated pathways and that metabolites associated with intratumoral microbes were (R)-N-methylsalsolinol, N-acetylaspartylglutamic acid, and N-acetyl-l-aspartic acid. Further mediation analysis suggested that the intratumoral microbiome may affect the expression of neuron-related genes through bacteria-associated metabolites. In addition, both in vivo and in vitro models of glioma show that Fusobacterium nucleatum promotes glioma proliferation and upregulates CCL2, CXCL1, and CXCL2 levels. Our findings shed light on the intricate interplay between intratumoral bacteria and glioma.

Importance: Our study adopted a multi-omics approach to unravel the impact of intratumoral microbes on neuron-related gene expression through bacteria-associated metabolites. Importantly, we found bacterial RNA and LPS signals within glioma tissues, which were traditionally considered sterile. We identified key microbiota within glioma tissues, including Fusobacterium nucleatum (Fn). Through in vivo and in vitro experiments, we identified the crucial role of Fn in promoting glioma progression, suggesting that Fn could be a potential diagnostic and therapeutic target for glioma patients. These findings offer valuable insights into the intricate interplay between intratumoral bacteria and glioma, offering novel inspiration to the realm of glioma biology.

Keywords: Fusobacterium nucleatum; glioma; intratumoral microbiota; metabolomics; multi-omics.


Conflict of interest statement

The authors declare no conflict of interest.

Figures

Fig 1
Fig 1
Schematic of research design.
Fig 2
Fig 2
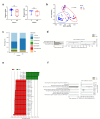
Profiling of tumor associated microbiota in human glioma tissue. (a) Species diversity differences between the G and NAT groups were estimated by the Shannon, and Simpson indices. *P < 0.05; **P < 0.01; NS, not significant. (b) PCoA was shown along the first two principal coordinates of Bray-Curtis distances for G and NAT. The P value was calculated by PERMANOVA. G group (blue dots); NAT group (red dots), where dots represent individual samples. (c) Microbiome community structure at the phylum levels compared in G and NAT. (d) Welch’s t-test results for evaluating the relative abundance of significantly different microbiota at the phylum level. G (blue) and NAT (yellow) groups for bars and dots. (e) The distribution bar diagram based on the LEfSe analysis (LDA score (log 10)>4) in G and NAT. (f) Enrichment pathways for prediction of microbial function between G and NAT groups based on PICRUSt analysis. G, glioma tissue; NAT, adjacent normal brain tissue.
Fig 3
Fig 3
Morphological characteristics of bacteria in human glioma tissue. (a) Serial paraffin sections of human glioma samples were stained for bacterial LPS and LTA immunohistochemical staining, and bacterial 16S rRNA FISH staining, where the Control group used a negative probe without 16S rRNA. The left column is the image taken by 20× lens, scale bar = 100 µm. The right column is the 40× magnified image of the framed area, scale bar = 50 µm. LPS expression and 16S rRNA FISH signal are positive at the locations marked by red and white arrows, respectively. (b) Human glioma tissue samples were stained with multicolor immunofluorescence. GFAP (yellow), CD68 (green), LPS (red), and DAPI (blue) labeled tumor cells, macrophages, bacteria, and nuclei, respectively. The middle column displays 10× images with scale bar of 200 µm. The leftmost and rightmost columns show 20× images of the tumor cell and macrophage cluster areas, respectively, framed in the 10× images. Scale bar for 20× images is 100 µm. (c) Statistics results of cell counts of GFAP + LPS double-positive cells and CD68 + LPS double-positive cells after immunofluorescence staining experiments followed by panoramic scanning. n = 4; **P < 0.01.
Fig 4
Fig 4
Gene expression associated with intratumoral microbiota in human glioma tissue. (a) Heatmap of Spearman correlation analysis between intratumoral microbiota alpha diversity and host gene expression. (b) Heatmap of Spearman correlation analysis between six differential bacteria abundance and host gene expression, red and blue indicate positive and negative correlations, respectively. *P < 0.05; **P < 0.01; ***P < 0.001. (c) Bar diagram of KEGG pathway enrichment analysis of 28 differentially expressed genes associated with 6 differential bacterial abundance.
Fig 5
Fig 5
Profiling of tumor-associated metabolites in human glioma tissue. (a and b) Score scatter plot of OPLS-DA model between G and NAT groups. (c and d) Metabolic pathway analysis of differential metabolites between G and NAT groups. (e) Heatmap of Spearman correlation analysis between the differential metabolites and alpha diversity. (f) Heatmap of Spearman correlation analysis between the differential bacteria and metabolites, red and blue indicate positive and negative correlations, respectively. *P < 0.05; **P < 0.01; **P < 0.001.
Fig 6
Fig 6
Integrated multi-omics analysis of human glioma tissues. (a) Network mapping of all differential metabolites and differential bacteria associated with differentially expressed genes in gene association analysis. (b) A Sankey diagram of multi-omics networks in glioma. (c) Network mapping of all differentially expressed genes (blue circles) and differential bacteria (green circles) associated with differential metabolites (orange circles) in metabolite association analysis. (d) A Sankey diagram of multi-omics networks in glioma. The size of each rectangle shows the degree of connectivity of each bacteria, gene, or metabolite. (e) Arthrobacter causally contributed to RFK through N-acetylglutamic-acid (P mediation = 0.02). (f) Longibaculum causally contributed to GRIN2B through PC(22:5(7Z,10Z,13Z,16Z,19Z)/22:4(7Z,10Z,13Z,16Z)) (Pmediation = 0.016). (g) Limosilactobacillus causally contributed to RIMKLA through (R)-N-methylsalsolinol (Pmediation = 0.042). The gray lines indicate the associations among bacteria, metabolites, and genes, with corresponding rSpearman values and P-values. The red arrowed lines indicate the bacterial effects on gene expression mediated by metabolites, with the corresponding mediation P-values.
Fig 7
Fig 7
Fusobacterium nucleatum accelerates tumor growth in glioma mouse model. (a) Schematic figure of generating subcutaneous glioma xenograft mouse model, the mice receiving intratumoral injections of PBS, Fusobacterium nucleatum (Fn), Fn along with metronidazole (MTZ) treatment or metronidazole, and tumor harvested. (b) Tumor weights were normalized as percentages relative to the average tumor weight in the PBS group for each experiment (set as 100% tumor weight). Each symbol represents one mouse. (c) Representative tumors post-harvest. (d) The top 10 Bar diagram of KEGG pathway enrichment analysis of differentially expressed genes in tumor tissues from the PBS group, Fn group and Fn + MTZ group. (e) FKPM value of CCL2, CXCL1, and CXCL2 in the PBS, Fn, Fn + MTZ, and MTZ groups following transcriptomics analysis of respective tumor tissues. (f) Protein expression levels of CCL2, CXCL1, and CXCL2 in the PBS (n = 4), Fn (n = 5), Fn + MTZ (n = 3), and MTZ groups (n = 3), measured by ELISA. Statistical method: Student’s t-test. (g) Heatmap of Spearman correlation analysis between differential metabolites and some differentially expressed genes with obvious correlation. (h) Relative quantitative value of N-glycolylneuraminic acid in the PBS, Fn, Fn + MTZ, and MTZ groups following metabolomic analysis of respective tumor tissues. ****P < 0.0001; ***P < 0.001**P < 0.01; *P < 0.05; NS, not significant. n = 3.
Fig 8
Fig 8
Fusobacterium nucleatum improves glioma organoid proliferation. (a) Acquisition of fresh glioma tissue, isolation, and culture of glioma organoids. (b) Growth morphology of untreated glioma organoids (Blank), hematoxylin and eosin (H&E) staining, and immunostaining for neural cell markers. (c) Viability of Fn-organoid and PBS-organoid groups at different time points assessed by ATP assay. Statistical method: one-way ANOVA followed by Bonferroni’s multiple comparison test. (d) Morphological comparison between Fn-organoid and PBS-organoid groups, and diameter measurement of organoids at different time points. Statistical method: one-way ANOVA followed by Bonferroni’s multiple comparison test. (e) Immunofluorescence analysis of Ki67 and GFAP protein expression in Fn-organoid and PBS-organoid groups, with a comparison of the proportion of Ki67-positive cells between the two groups. Statistical method: Student’s t-test. (f) Protein expression levels of CCL2, CXCL1, and CXCL2 in Fn-organoid and PBS-organoid groups measured by ELISA. Statistical method: Student’s t-test. *(P < 0.05), **(P < 0.01), ***(P < 0.001), Fn (Fusobacterium nucleatum).

References

    1. Sung H, Ferlay J, Siegel RL, Laversanne M, Soerjomataram I, Jemal A, Bray F. 2021. Global cancer statistics 2020: GLOBOCAN estimates of incidence and mortality worldwide for 36 cancers in 185 countries. CA Cancer J Clin 71:209–249. doi:10.3322/caac.21660 - DOI - PubMed
    1. Jin C, Lagoudas GK, Zhao C, Bullman S, Bhutkar A, Hu B, Ameh S, Sandel D, Liang XS, Mazzilli S, Whary MT, Meyerson M, Germain R, Blainey PC, Fox JG, Jacks T. 2019. Commensal microbiota promote lung cancer development via γδ T cells. Cell 176:998–1013. doi:10.1016/j.cell.2018.12.040 - DOI - PMC - PubMed
    1. Fu A, Yao B, Dong T, Chen Y, Yao J, Liu Y, Li H, Bai H, Liu X, Zhang Y, Wang C, Guo Y, Li N, Cai S. 2022. Tumor-resident intracellular microbiota promotes metastatic colonization in breast cancer. Cell 185:1356–1372. doi:10.1016/j.cell.2022.02.027 - DOI - PubMed
    1. Qiao H, Tan X-R, Li H, Li J-Y, Chen X-Z, Li Y-Q, Li W-F, Tang L-L, Zhou G-Q, Zhang Y, Liang Y-L, He Q-M, Zhao Y, Huang S-Y, Gong S, Li Q, Ye M-L, Chen K-L, Sun Y, Ma J, Liu N. 2022. Association of intratumoral microbiota with prognosis in patients with nasopharyngeal carcinoma from 2 hospitals in China. JAMA Oncol 8:1301–1309. doi:10.1001/jamaoncol.2022.2810 - DOI - PMC - PubMed
    1. Wang Q, Yang Q, Liu X. 2023. The microbiota-gut-brain axis and neurodevelopmental disorders. Protein Cell 14:762–775. doi:10.1093/procel/pwad026 - DOI - PMC - PubMed

MeSH terms

LinkOut - more resources