. 2024 Dec 13;10(50):eadp1980.
doi: 10.1126/sciadv.adp1980. Epub 2024 Dec 11.

Synergistic label-free fluorescence imaging and miRNA studies reveal dynamic human neuron-glial metabolic interactions following injury

Affiliations

Synergistic label-free fluorescence imaging and miRNA studies reveal dynamic human neuron-glial metabolic interactions following injury

Yang Zhang et al. Sci Adv. .

Abstract

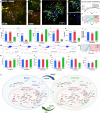
Neuron-glial cell interactions following traumatic brain injury (TBI) determine the propagation of damage and long-term neurodegeneration. Spatiotemporally heterogeneous cytosolic and mitochondrial metabolic pathways are involved, leading to challenges in developing effective diagnostics and treatments. An engineered three-dimensional brain tissue model comprising human neurons, astrocytes, and microglia is used in combination with label-free, two-photon imaging and microRNA studies to characterize metabolic interactions between glial and neuronal cells over 72 hours following impact injury. We interpret multiparametric, quantitative, optical metabolic assessments in the context of microRNA gene set analysis and identify distinct metabolic changes in neurons and glial cells. Glycolysis, nicotinamide adenine dinucleotide phosphate (reduced form) and glutathione synthesis, fatty acid synthesis, and oxidation are mobilized within glial cells to mitigate the impacts of initial enhancements in oxidative phosphorylation and fatty acid oxidation within neurons, which lack robust antioxidant defenses. This platform enables enhanced understanding of mechanisms that may be targeted to improve TBI diagnosis and treatment.


Figures
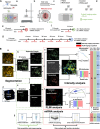
Fig. 1.
Fig. 1.. Experimental setup and analytical approach.
(A) Experimental setup: Schematic of 3D tricultures (Aa), CCI setup (Ab), injury area with peri-injury image acquisition sites (Ac), 3D volume acquisition strategy (Ad), and timelines for 6-, 24-, and 72-hour experiments (Ae to Ag). (B) Analytical approach: (Ba-c) Intensity image analysis workflow. (Ba) Pseudo-colored composite images at 755-nm and 860-nm excitation, including emission at 460 ± 25 nm (green), 525 ± 25 nm (red), and 630 ± 70 nm (magenta-mCherry expressing microglia) highlight qualitatively differences between neurons (yellow hues) and astrocytes (green hues). These are exploited to distinguish neurons and glial cells. (Bb) A representative 755-nm excitation/460-nm emission image is shown along with the corresponding separated neuronal and glial cell populations. (Bc) NAD(P)H, lipofuscin and FP contributions are quantified and used to extract mitochondrial clustering, redox ratio (RR), and lipofuscin content. (Bd to Bf) FLIM data analysis involves identification of neurons and glial cells, temporal and spatial binning, phasor analysis, and g component evaluation. (Bg) miRNA is isolated from media at 6, 24, and 72 hours and analyzed using the NanoString platform. Color bars in (Bc) and (Bf) represent the RR range and photon count range, respectively. Scale bar, 100 μm.
Fig. 2.
Fig. 2.. Neurons and Glial cells exhibit distinct optical metabolic features.
(A) Maximum projection overlay with 755/460-nm, 860/525-nm, and 755/630-nm emissions showing neurons (orange), astrocytes (green), and microglia (magenta). (B) Zoomed-in projection at 755 nm highlighting glial cells, and (C) at 860 nm highlighting neurons. (D) RR-coded image after lipofuscin removal. (E) RR-coded image for glial cells. (F) Binary mask of lipofuscin (white pixels) within a single optical section. (G) RR distribution for all control group cells, and (H) for neurons and glia separately. (I to L) RR, RR components, lipofuscin intensity, and mitochondrial clustering for all cells, neurons, and glia. (M to P) Phasor plots from FLIM data for all cells, neurons, glia, and lipofuscin. (Q) G distributions with component ranges highlighted. (R to U) FLIM results for long and short lifetimes, NAD(P)H BF, and G component values. (V) Schematic of neuron-astrocyte metabolic communication pathways. Results are mean ± SEM from two independent experiments (n = 15 to 18 scaffolds x 2 volumes/scaffold). *P < 0.05, **P < 0.01, analysis of variance (ANOVA) with Tukey’s post hoc test). Scale bar, 100 μm.
Fig. 3.
Fig. 3.. TPEF intensity–based optical metabolic function metrics reveal distinct Neuron and Glial cell responses post-injury.
Representative projections from (A to C) Control and (D to F) Injured scaffolds at 6, 24, and 72 hours following CCI. [(A) and (D)] Maximum projection overlays of 755-nm excitation with 460-, 525-, and 630-nm emission, at 6, 24, and 72 hours. [(B), (C), (E), and (F)] RR color-coded [RR = Fp/(NAD(P)H + Fp)] images of neuronal [(B) and (E)] and glial [(C) and (F)] populations at the same locations as (A) and (D). RR-color scale shown (F), 72 hours. (G to L) Mean RR values (G), mitochondrial clustering (H), lipofuscin content (I), and low, mid, and high RR components [(J) to (L)] for all cells, neurons, and glial cells individually. Each metric data point is normalized to the corresponding mean of the control ROIs imaged at each time point. Results are mean ± SEM from two independent experiments at 6, 24, and 72 hours, respectively, with n = 6 scaffolds x 2 to 3 ROIs per scaffold = 15 to 18 ROIs per time point. Asterisks *, ** indicate significant differences (P < 0.05, 0.01, respectively). ANOVA with Tukey’s post hoc tests used for time comparisons. Color of asterisk indicates the group to which a particular time point is compared. Pairwise t tests assess significant differences between injury and corresponding controls, as indicated by black asterisks. Scale bar, 100 μm.
Fig. 4.
Fig. 4.. FLIM-based optical metabolic function metrics reveal distinct Neuron and Glial cell responses post-injury.
Representative mean lifetime value color-coded projections for (A1 to A3) all cells (B1 to B3) neurons and (C1 to C3) glial cells within control scaffolds imaged at 6, 24, and 72 hours. Corresponding projections from (D1 to D3) all cells, (E1 to E3) neurons, and (F1 to F3) glial cells from scaffolds following 6, 24, or 72 hours after CCI. NAD(P)H (G) Short lifetime, (H) Long lifetime, and (I) BF, (J) low G, (K) mid G, and (L) high G contributions from all cells, and from neurons and glial cells separately. All injury data presented are normalized to the corresponding control ROI means of each experiment. For 6- and 24-hour time points, data is derived from n = 6 scaffolds with a total of 15 to 18 ROIs for each time point. The 72-hour data are from n = 3 scaffolds with 9 ROIs total. Asterisks *, ** indicate significant differences (P < 0.05, 0.01, respectively). ANOVA with Tukey’s post hoc test was used to assess differences among different time points (colored asterisks). Pairwise t tests were used to compare each injury with the corresponding control condition; significance presented with black asterisks. Scale bar, 100 μm.
Fig. 5.
Fig. 5.. miRNA gene set analysis and optical metabolic imaging provide complementary metabolic function information.
(A and B) Selected metabolic pathway changes identified at 6, 24, and 72 hours following injury using miRNA gene set analysis. Pathways with a Benjamini-Hochberg’s corrected FDR < 0.25 were selected. (C to G) Control-normalized optical metabolic function metrics, at the same time points as miRNA data, following injury. (C) Control-normalized metabolic readout values in log2 scale, with color coding denoting adjusted P values <0.25, consistent with the miRNA data analysis, highlighting significant changes relative to control group values based on pairwise t tests with Benjamini-Hochberg’s adjusted P values to control for multiple comparisons. (D) T-statistic for significant differences as a function of time following injury with the color coded for adjusted P values using Benjamini-Hochberg’s method for multiple comparisons correction, following one-way ANOVA and post hoc Tukey tests. [(E) and (F)] Canonical plots resulting from QDA using optical metabolic function metrics from neuronal (E) and glial (F) populations post-injury. (G) Canonical plots from QDA performed using Neurons and Glial cells together. All data were normalized to control ROI averages and reflected injury effects at respective time points. Data for 6 and 24 hours are derived from n = 6 scaffolds with 15 to 18 ROIs each, while 72-hour data include n = 3 scaffolds with 9 ROIs.
Fig. 6.
Fig. 6.. Dynamic monitoring of neuron–glial cell metabolic interactions over 72 hours following injury.
A combination of control-normalized optical metabolic function metrics following injury, including Mitochondrial clustering (i.e., beta), Redox Ratio, Lipofuscin intensity, Low RR, Mid RR, High RR (derived from analysis of TPEF intensity images) and NAD(P)H: Short Lifetime, Long Lifetime, Bound Fraction, Low G AUC, Mid G AUC, High G AUC (derived from analysis of phasor FLIM data) identify distinct metabolic states of neurons and glial cells at multiple times following injury. (A) Control-normalized metabolic readout values in log2 scale, including data from the 6- and 72-hour time points (both the same as in Fig. 5, C and D) as well as five additional unique time points (12, 24, 36, 48, and 60 hours) collected from the same ROIs every 12 hours during the 72-hour experiment. (B) T-statistic for significant differences for each metric as a function of time following injury with the color coded for adjusted P values using Benjamini-Hochberg’s method for multiple comparisons correction, following one-way ANOVA and post hoc Tukey tests. (C and D) Canonical plots resulting from QDA using optical metabolic function metrics from neuronal (C) and glial (D) populations post-injury to identify distinct metabolic signatures for each time point. Data for 6 and 24 hours are derived from n = 6 scaffolds and a total of 15 to 18 ROIs for each time point, while 72-hour data are derived from n = 3 scaffolds and a total of 9 ROIs for each time point.

References

    1. Naumenko Y., Yuryshinetz I., Zabenko Y., Pivneva T., Mild traumatic brain injury as a pathological process. Heliyon 9, e18342 (2023). - PMC - PubMed
    1. Ismail H., Shakkour Z., Tabet M., Abdelhady S., Kobaisi A., Abedi R., Nasrallah L., Pintus G., Al-Dhaheri Y., Mondello S., El-Khoury R., Eid A. H., Kobeissy F., Salameh J. S., Traumatic brain injury: Oxidative stress and novel anti-oxidants such as mitoquinone and edaravone. Antioxidants 9, 943 (2020). - PMC - PubMed
    1. Romeu-Mejia R., Giza C. C., Goldman J. T., Concussion pathophysiology and injury biomechanics. Curr. Rev. Musculoskelet. Med. 12, 105–116 (2019). - PMC - PubMed
    1. Barkhoudarian G., Hovda D. A., Giza C. C., The molecular pathophysiology of concussive brain injury—An update. Phys. Med. Rehabil. Clin. N. Am. 27, 373–393 (2016). - PubMed
    1. Wilde E. A., Wanner I.-B., Kenney K., Gill J., Stone J. R., Disner S., Schnakers C., Meyer R., Prager E. M., Haas M., Jeromin A., A framework to advance biomarker development in the diagnosis, outcome prediction, and treatment of traumatic brain injury. J. Neurotrauma 39, 436–457 (2022). - PMC - PubMed