. 2024 Dec 13;10(50):eadp4033.
doi: 10.1126/sciadv.adp4033. Epub 2024 Dec 11.

High-precision chemical quantum sensing in flowing monodisperse microdroplets

Affiliations

High-precision chemical quantum sensing in flowing monodisperse microdroplets

Adrisha Sarkar et al. Sci Adv. .

Abstract

A method is presented for high-precision chemical detection that integrates quantum sensing with droplet microfluidics. Using nanodiamonds (ND) with fluorescent nitrogen-vacancy (NV) centers as quantum sensors, rapidly flowing microdroplets containing analyte molecules are analyzed. A noise-suppressed mode of optically detected magnetic resonance is enabled by pairing controllable flow with microwave control of NV electronic spins, to detect analyte-induced signals of a few hundredths of a percent of the ND fluorescence. Using this method, paramagnetic ions in droplets are detected with low limit-of-detection using small analyte volumes, with exceptional measurement stability over >103 s. In addition, these droplets are used as microconfinement chambers by co-encapsulating ND quantum sensors with various analytes such as single cells, suggesting wide-ranging applications including single-cell metabolomics and real-time intracellular measurements from bioreactors. Important advances are enabled by this work, including portable chemical testing devices, amplification-free chemical assays, and chemical imaging tools for probing reactions within microenvironments.


Figures
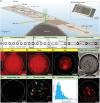
Fig. 1.
Fig. 1.. NDs in droplets.
(A) Schematic of microfluidic chip comprising two inlets for oil and one for water (gray circles). Analyte of interest and NDs are mixed into the latter. Chip features two focusing junctions, J1 and J2. J1 generates ND-filled water droplets, while J2 regulates droplet spacing. Droplets are analyzed in a region (dashed region a) over an objective lens and MW coil, followed by a circuitous region to induce additional mixing within droplets (region b) and storage in a collection chamber (region c). (i) Inset: Photograph of chip; water and oil are delivered via narrow capillaries. See the Supplementary Materials for fabrication details. (B) Bright-field images with detailed views of the device regions. (i) Droplet generation at J1 occurs by pinching water flow by oil (blue and orange arrows respectively) through an orifice. (ii) Spacer junction J2 allows adjustment of droplet spacing via oil-flow (arrows). Here, interdroplet distance is changed ≈154 → 360 μm. (iii) Analysis region a: Droplets maintain a consistent velocity and separation downstream and are analyzed in flow. (C) Fluorescence images of droplets containing NDs of various sizes, (i) 40-nm-, (ii) 100-nm-, and (iii) 3-μm-diameter particles. Dashed lines outline the droplet for clarity. (D) Tracking single NDs in droplets. (i) Single 3-μm particle encapsulated within a droplet. (ii) Tracked motion of 100-nm particles within a single droplet (75, 76), shown for 11 particles tracked via fluorescence over a 30 s. (iii) Histogram of particle displacement for 200 particle trajectories over 30 s. For moving droplets, the NDs sample a larger part of the droplet volume (movie S1). (E) Co-encapsulation of cells with NDs. (i) Bright-field and (ii) fluorescence images showing yeast cells encapsulated along with 100 nm ND particles. Inset: Zoom into individual cells. See section S5 for ND targeting to these cells.
Fig. 2.
Fig. 2.. ODMR of ND particles in droplets.
(A) Conventional ODMR measurement of 100-nm particles in a single ≈100-μm droplet at zero magnetic field. Inset (i): Droplet fluorescence image. Each point is averaged for 1 s with and without MWs. Contrast C is marked. Strong fluctuations arise from particle motion. (B) Enhanced ODMR using MW lock-in, using analog lock-in detector at modulation frequency fMW=1 kHz. SNR improves 10-fold; contrast Clock is clearer. Strain-mediated dips around 2.87 GHz are visible. (C) ODMR contrast C relevant for chemical sensing obtained via normalizing lock-in signal in (B) at 2.866 GHz to simultaneously measured PL. Here, droplets are flowing, and data are sampled every 100 ms over 90 s. (i) Histogram of C data displays variations at the ΔC ≈ 13% level, highlighting the challenge for chemical sensing. Solid line is a Gaussian fit.
Fig. 3.
Fig. 3.. Droplet double lock-in detection.
(A) Schematic and (B) protocol: Droplets hosting NDs flow through the analysis region where they are illuminated by continuous 532-nm illumination, and MW excitation at the ODMR resonance. Two modulations are imposed upon the PL (red line) by droplet flow at fD, and MWs at fMW. Mixing is illustrated by the arrows. (C) Bright-field and fluorescence images of droplets containing 100-nm NDs flowing at fD ≈ 30 droplets per second. (D) Long-time PL from flowing droplets captured over a 8.3-min period. Three panels show representative 1-s windows. Dashed horizontal lines indicate intensity limits. (E) Double modulation imprinted into PL. Representative 140 ms (≈4 droplet) segment of the PL trace in (D). PL modulates at fD due to successive droplets entering and leaving the field of view. (i) Smaller ODMR modulation reflected by gray shading at fMW is observable in the zoom-in. Blue points represent the data, and the solid line is a fit to Eq. 1. (F) Fourier transform intensity of PL collected over t = 15 s displayed on a logarithmic scale. Points are data and solid lines are Lorentzian fits. Droplet modulation generates a sharp peak F(fD) at fD and its harmonics, stemming from the square wave–like droplet profile. The peak at zero frequency is excluded for simplicity. Sharp peaks arise at the MW modulation, fMW=1 kHz, while a combination with flow leads to peaks at fMW±fD (yellow shaded regions). Narrow Fourier linewidths are evident for all peaks (see Fig. 4B). (ii) Linear scale FT: Data in yellow shaded region in main panel are plotted on a linear scale highlighting narrow linewidth and high SNR. (G) Tunability of droplet modulation. PL traces for three example cases in 200-ms windows. Highest frequency fD=346.5 Hz corresponds to sampling >106 droplets per hour.
Fig. 4.
Fig. 4.. High stability in-flow droplet measurement.
(A) Long-time high-precision measurement of ODMR contrast C following Eq. 2 over T ≈ 2.5 hour period, encompassing >290,000 droplets (upper axis), demonstrating stability. Data are sampled every ≈1 s. (i) Inset: Blue bars show histogram of the measured contrast C in (A). Solid line is a Gaussian fit; from the linewidth we estimate the percent error ΔC=2% of the mean contrast (dashed line). Green histogram from Fig. 2C(ii) is overlaid for reference, highlighting narrowing via double lock-in scheme. (B) Spectrogram of the Fourier peaks in frequency bands around fD and fMW measured over 1 hour. Data are presented over successive 700-ms windows (corresponding to 20 droplets), for a total of 104,000 droplets (upper axis). Upper and lower windows span 50 and 120 Hz, respectively. Colors indicate FT intensities F(f) of PL in the two frequency bands. (i) Left panels: Integrated intensity of the spectrogram data plotted against frequency. Narrow peaks indicate high stability over the entire period. (C) Allan deviation A(t) shown for 1000 s of data in (B). A(t) follows 1/t trend (dashed line) for the entire period, highlighting remarkable stability. Percent error ΔC reduces over 30-fold as a result. (D) Bounding ND variation per droplet. Histogram of the intensity of F(fMW) peak from spectrogram in (B), measured over 7-s bins. Solid line is a Gaussian fit. Extrapolating to 1000 s (main panel), we estimate inter droplet ND variation <0.23%. This corresponds to ≲2300 particle variation over ≈1M NDs per droplet. (E and F) Compensation of experimental variations via Eq. 2. Variation of ODMR contrast C with ND concentration (E) and with laser power (F). Red line shows measured droplet fluorescence, while blue line shows corresponding C. Inset: The operational regime for our experiments at ≈100 mW.
Fig. 5.
Fig. 5.. Sensing paramagnetic species in flowing microdroplets.
(A) Gd3+ ion detection. ODMR contrast C as function of Gd3+ concentration measured in ≈50 μm droplets flowing at fD 40 Hz. Datapoints are red circles; error bars reflect ΔC for 4-min measurements. Inset: Schematic of sensing. Spin noise from Gd3+ ions affects NV T1, and converts to measurable change in ODMR contrast C. (B) Gadolinium sensitivity. Results of separate experiment measuring a lower range of Gd3+ concentration. Inset (i): Data plotted against a log scale in concentration. We estimate a LOD ≈100 nM. (C) TEMPOL sensing. Similar measurements for two concentrations of TEMPOL in flowing ≈50 μm droplets over 1 min each. We estimate a LOD <2 μM. (D) Volume scaling for in-droplet sensing shown on a logarithmic scale. Marked points correspond to a single droplet, 1 min, and 1 hour of measurements, assuming flow at fD=30 Hz. (E) Landscape of chemical quantum sensing techniques. Comparison of related methods (diamond sensing, EPR, and fluorescence) for radical/paramagnetic analyte concentration on axes corresponding to sample volume required and lowest detectable concentration reported. Ideal sensing constitutes bottom-left region of plot (arrows). Stars are derived from specific references; shaded regions illustrate approximate sensing boundaries. Our work is shown by the orange region. Red stars represent single crystal based sensing and black stars represent ND-based sensing. Light orange region shows projected improvement from averaging to 103 s (Fig. 4C).

References

    1. Degen C. L., Reinhard F., Cappellaro P., Quantum sensing. Rev. Mod. Phys. 89, 035002 (2017).
    1. Zhang T., Pramanik G., Zhang K., Gulka M., Wang L., Jing J., Xu F., Li Z., Wei Q., Cigler P., Chu Z., Toward quantitative biosensing with nitrogen–vacancy center in diamond. ACS Sens. 6, 2077–2107 (2021). - PubMed
    1. Doherty M. W., Dolde F., Fedder H., Jelezko F., Wrachtrup J., Manson N. B., Hollenberg L. C. L., Theory of the ground-state spin of the NV center in diamond. Phys. Rev. B 85, 205203 (2012).
    1. Jelezko F., Wrachtrup J., Single defect centres in diamond: A review. Phys. Status Solidi A Appl. Mater. Sci. 203, 3207–3225 (2006).
    1. Neumann P., Jakobi I., Dolde F., Burk C., Reuter R., Waldherr G., Honert J., Wolf T., Brunner A., Shim J. H., Suter D., Sumiya H., Isoya J., Wrachtrup J., High-precision nanoscale temperature sensing using single defects in diamond. Nano Lett. 13, 2738–2742 (2013). - PubMed