. 2024 Dec 13;10(50):eadp7444.
doi: 10.1126/sciadv.adp7444. Epub 2024 Dec 11.

The adenine nucleotide translocase family underlies cardiac ischemia-reperfusion injury through the mitochondrial permeability pore independently of cyclophilin D

Affiliations

The adenine nucleotide translocase family underlies cardiac ischemia-reperfusion injury through the mitochondrial permeability pore independently of cyclophilin D

Pooja Patel et al. Sci Adv. .

Abstract

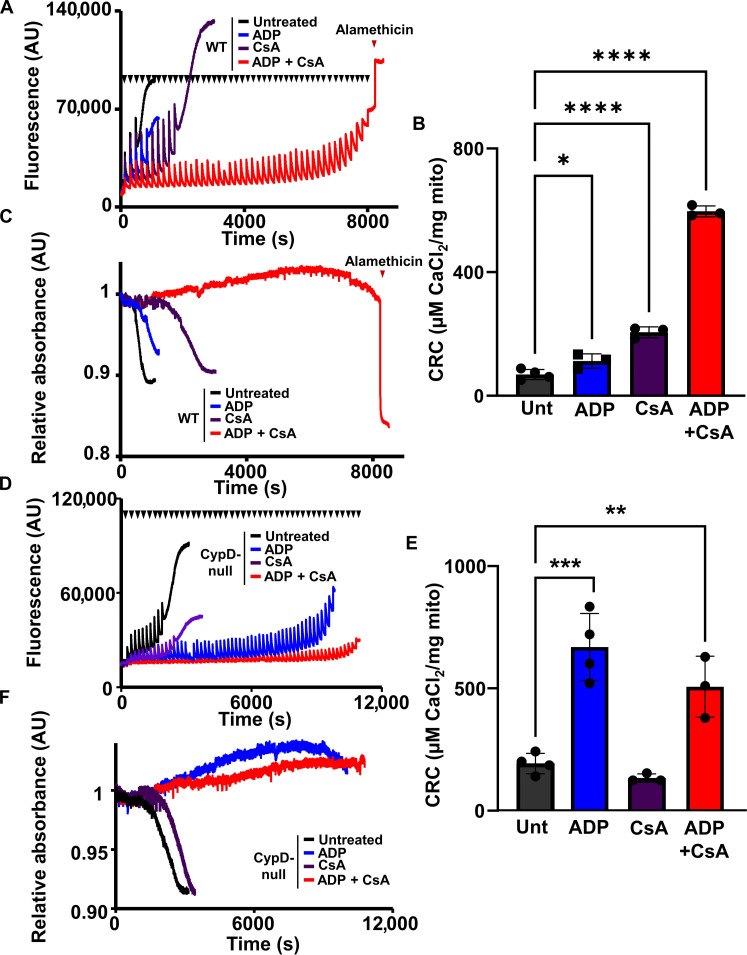
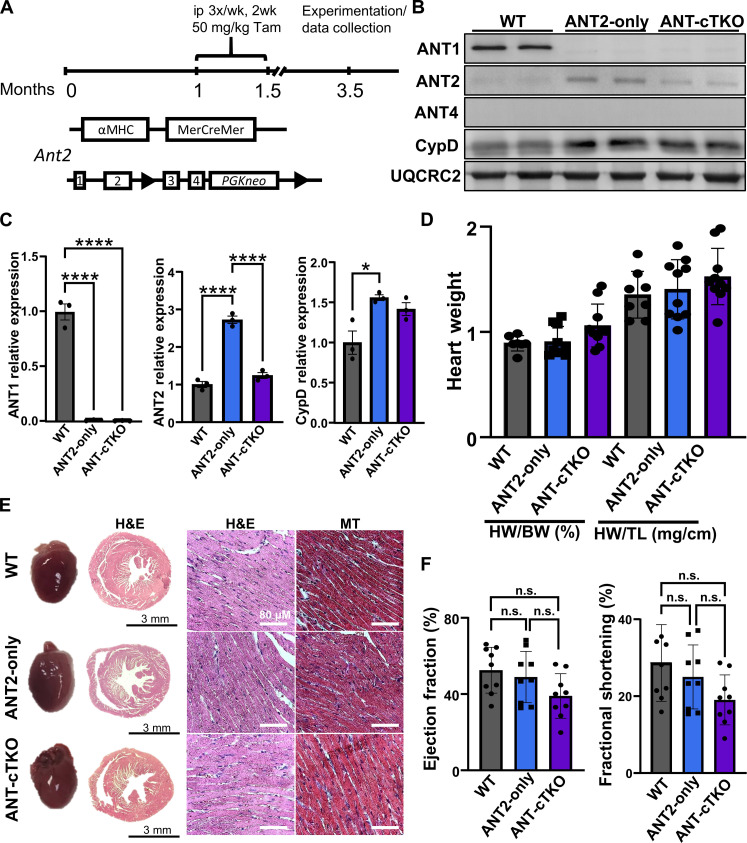
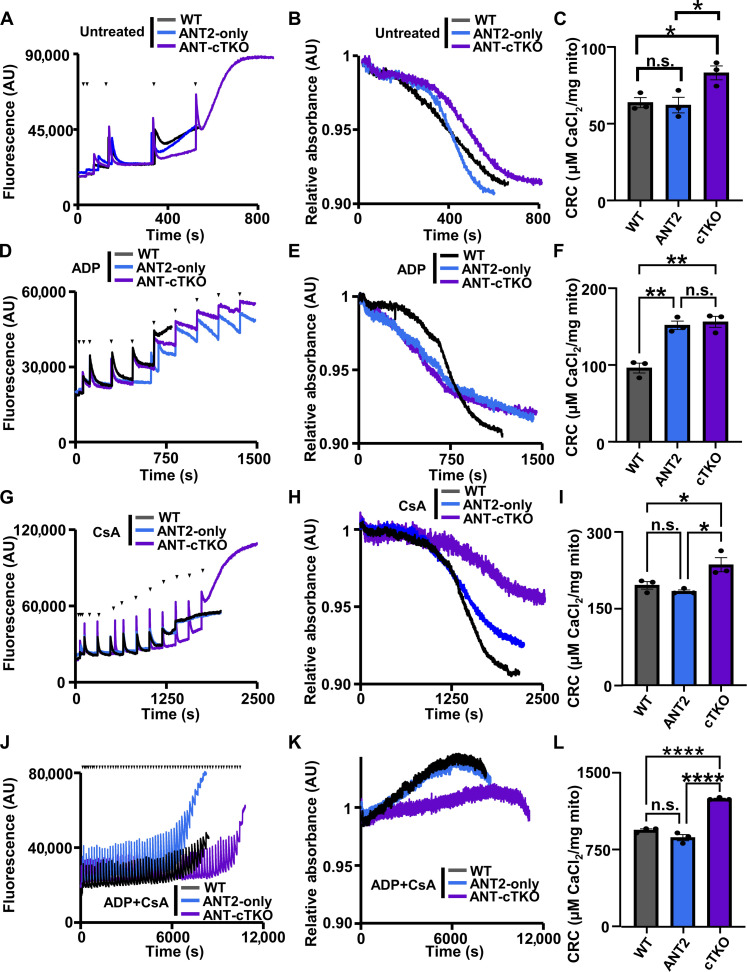
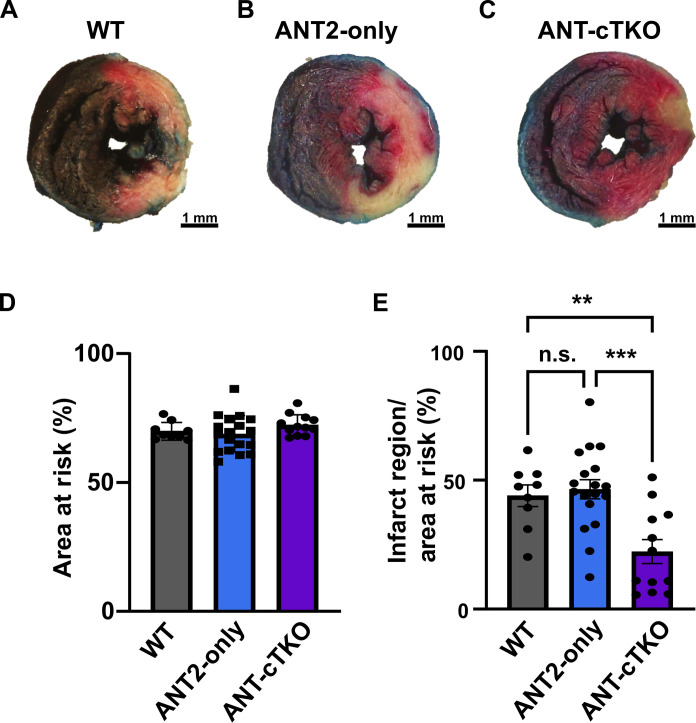
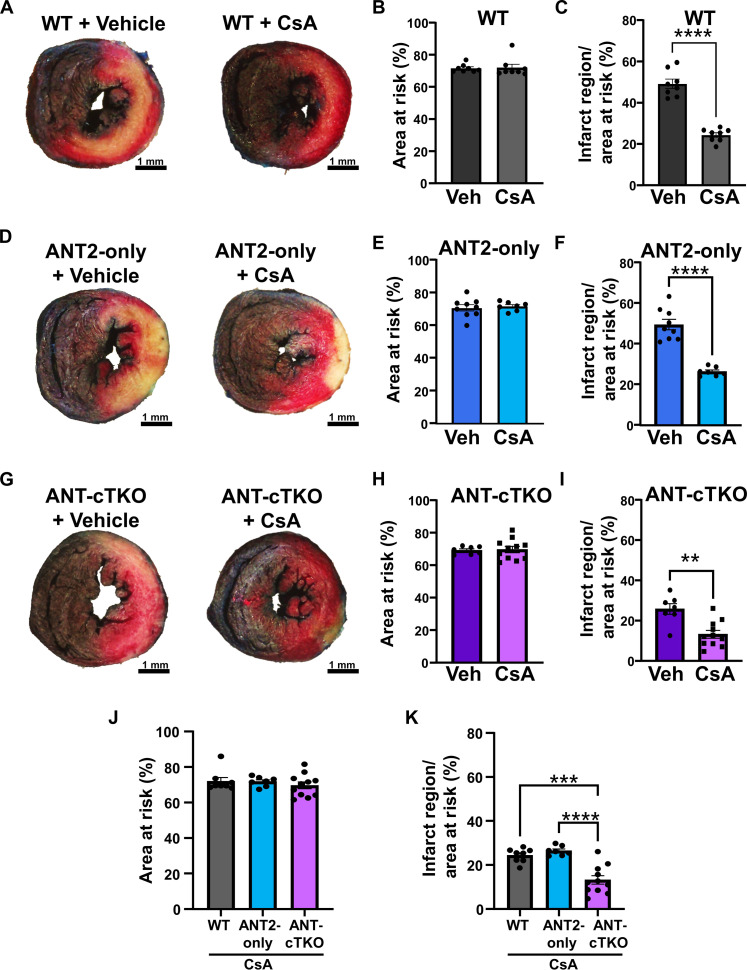
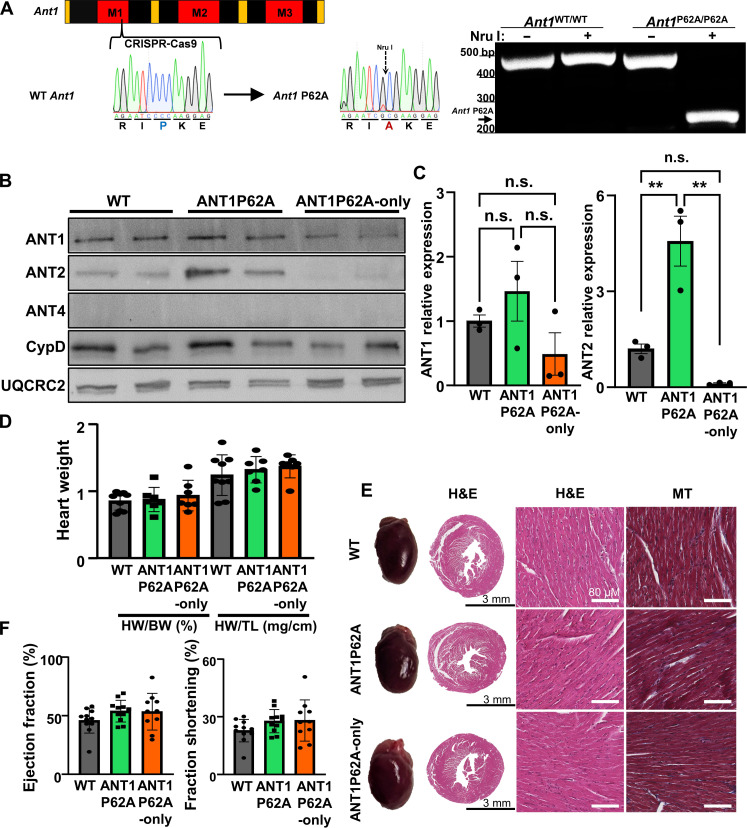
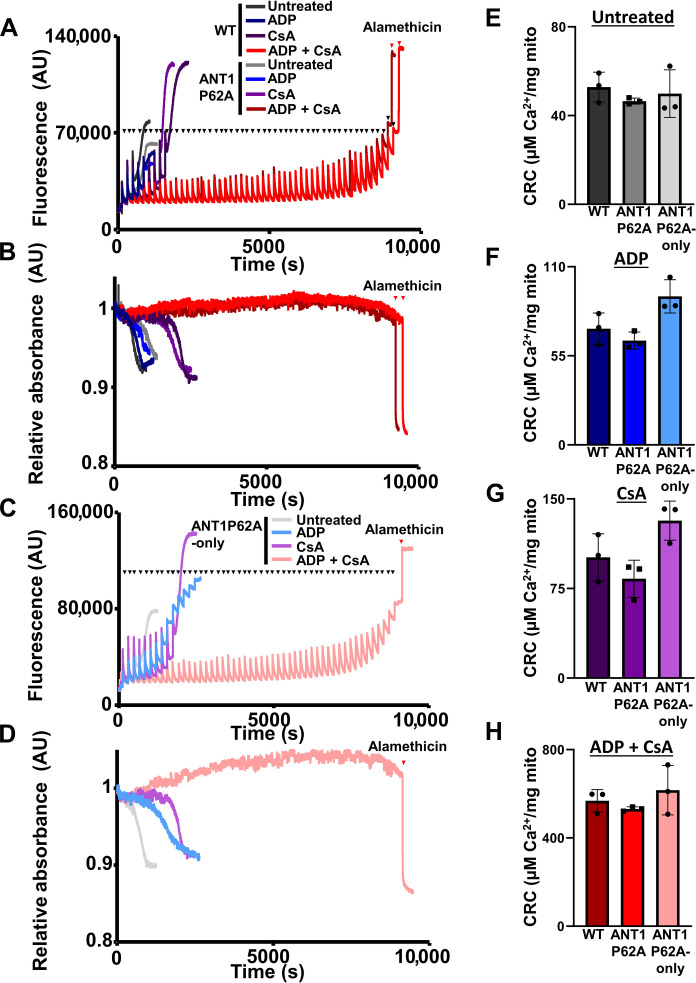
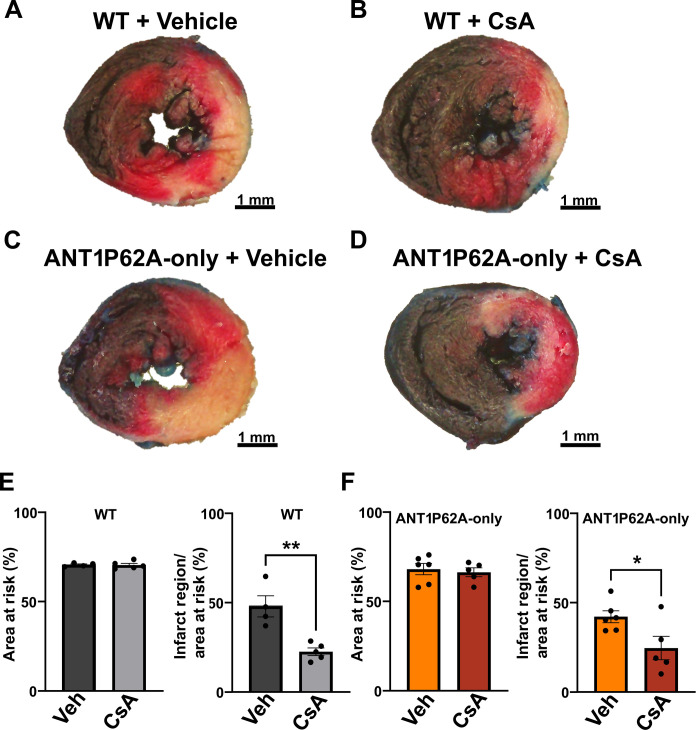
The mitochondrial permeability transition pore (mPTP) is implicated in cardiac ischemia-reperfusion (I/R) injury. During I/R, elevated mitochondrial Ca2+ triggers mPTP opening, leading to necrotic cell death. Although nonessential regulators of this pore are characterized, the molecular identity of the pore-forming component remains elusive. Two of these genetically verified regulators are cyclophilin D (CypD) and the adenine nucleotide translocase (ANT) family. We investigated the ANT/CypD relationship in mPTP dynamics and I/R injury. Despite lacking all ANT isoforms, Ca2+-dependent mPTP opening persisted in cardiac mitochondria but was desensitized. This desensitization conferred resistance to I/R injury in ANT-deficient mice. CypD is hypothesized to trigger mPTP opening through isomerization of ANTs at proline-62. To test this, we generated mice that expressed a P62A mutated version of ANT1. These mice showed similar mPTP dynamics and I/R sensitivity as the wild type, indicating that P62 is dispensable for CypD regulation. Together, these data indicate that the ANT family contributes to mPTP opening independently of CypD.


Figures

Fig. 1.
Fig. 1.. CypD inhibition or deletion plus ADP treatment synergistically desensitizes mPTP opening in heart mitochondria.
(A) Representative traces of cardiac mitochondrial CRC assay of WT heart mitochondria untreated (black), pretreated with 300 μM ADP (blue), 2 μM CsA (purple), or a combination of 300 μM ADP and 2 μM CsA (red). Each bolus of calcium (20 μM CaCl2) is indicated by black triangles. The addition of 7 μM alamethicin is indicated by a red triangle. AU, arbitrary units. (B) Quantification of (A). (C) Representative trace of the mitochondrial swelling assay corresponding to (A). (D) Representative traces of cardiac mitochondrial CRC assay of CypD null heart mitochondria untreated (black), pretreated with 300 μM ADP (blue), 2 μM CsA (purple), or a combination of 300 μM ADP and 2 μM CsA (red). Each bolus of calcium (20 μM CaCl2) is indicated by black triangles. (E) Quantification of (D). (F) Representative trace of corresponding mitochondrial swelling of (D). For all panels of data, n = 3. *P ≤ 0.05; **P ≤ 0.01; ***P ≤ 0.001; ****P ≤ 0.0001.
Fig. 2.
Fig. 2.. Baseline characterization of cardiac-specific triple ANT knockout hearts.
(A) Schematic of genetic generation of Ant2fl/fl αMHC-MerCreMer mice and tamoxifen (Tam) regimen. ip, intraperitoneally. (B) Representative Western blots of ANT1, ANT2, ANT4, CypD, and OXPHOS (UQCRC2, loading control) using WT, ANT2-only, and ANT-cTKO heart mitochondrial protein isolates. (C) Protein quantifications of ANT1, ANT2, and CypD over UQCR2 expression relative to the WT sample. (D) Quantifications of heart weight over body weight (HW/BW) and heart weight over tibia length (HW/TL) of 3.5-month-old WT (gray), ANT2-only (blue) and ANT-cTKO (purple). (E) Representative gross and histological images of H&E and Masson’s trichrome staining on cross sections of WT, ANT2-only, and ANT-cTKO hearts. (F) Echocardiographic analysis was performed on 3.5-month-old WT, ANT2-only, and ANT-cTKO hearts 2 months after tamoxifen treatment; ejection fraction and fractional shortening are graphed. *P ≤ 0.05; ****P ≤ 0.0001; n.s., not significant.
Fig. 3.
Fig. 3.. Mitochondria isolated from ANT cTKO hearts have increased the CRC.
(A) Representative traces of cardiac mitochondrial CRC assay of WT (black), ANT2-only (blue), and ANT-cTKO (purple) cardiac mitochondria treated with boluses of calcium (20 μM CaCl2) as indicated by black triangles. (B) Representative trace of mitochondria swelling corresponding to (A). (C) Quantification of the mitochondrial CRC calculated from calcium uptake, as in (A). (D) Representative traces of cardiac mitochondrial CRC assay of WT, ANT2-only, and ANT-cTKO cardiac mitochondria pretreated with 300 μM ADP and then treated with boluses of calcium (20 μM CaCl2) as indicated by black triangles. (E) Representative trace of mitochondria swelling corresponding to (D). (F) Quantification of the mitochondrial CRC calculated from calcium uptake, as in (D). (G) Representative traces of cardiac mitochondrial CRC assay of WT, ANT2-only, and ANT-cTKO cardiac mitochondria pretreated with 2 μM CsA and then treated with boluses of calcium (20 μM CaCl2) as indicated by black triangles. (H) Representative trace of mitochondria swelling corresponding to (G). (I) Quantification of the mitochondrial CRC calculated from calcium uptake, as in (G). (J) Representative traces of cardiac mitochondrial CRC assay of WT, ANT2-only, and ANT-cTKO cardiac mitochondria pretreated with 300 μM ADP and 2 μM CsA and then treated with boluses of calcium (20 μM CaCl2) as indicated by black triangles. (K) Representative trace of mitochondria swelling corresponding to (J). (L) Quantification of the mitochondrial CRC calculated from calcium uptake, as in (J). *P ≤ 0.05; **P ≤ 0.01; ****P ≤ 0.0001; n.s., not significant.
Fig. 4.
Fig. 4.. ANT cTKO hearts are protected from I/R injury.
(A to C) Representative cross section of Evans blue dye and 2,3,5-triphenyltetrazolium chloride stained WT (n = 9) (A), ANT2-only (n = 18) (B), and ANT cTKO (n = 12) (C) hearts after 60 min of ischemia followed by 24 hours of reperfusion. (D) Quantification of the area at risk of WT, ANT2-only, and ANT cTKO hearts. (E) Quantification of the infarct region over area at risk of WT, ANT2-only, and ANT cTKO hearts. **P ≤ 0.01; ***P ≤ 0.001.
Fig. 5.
Fig. 5.. Inhibition of CypD and deletion of the ANT family conveys additive protection from I/R injury.
(A) Representative heart cross sections stained with Evans blue dye and 2,3,5-triphenyltetrazolium chloride from WT mice pretreated with vehicle or CsA (10 mg/kg) hearts and then subjected to 60 min of ischemia followed by 24 hours of reperfusion. (B) Quantification of the area at risk of (A). (C) Quantification of the infarct region over area at risk of (A). (D) Representative heart cross sections stained with Evans blue dye and 2,3,5-triphenyltetrazolium chloride from ANT2-only mice pretreated with vehicle or CsA (10 mg/kg) hearts and then subjected to 60 min of ischemia followed by 24 hours of reperfusion. (E) Quantification of the area at risk of (D). (F) Quantification of the infarct region over area at risk of (D). (G) Representative heart cross sections stained with Evans blue dye and 2,3,5-triphenyltetrazolium chloride from ANT-cTKO mice pretreated with vehicle or 10 mg/kg CsA hearts and then subjected to 60 min of ischemia followed by 24 hours of reperfusion. (H) Quantification of the area at risk of (G). (I) Quantification of the infarct region over area at risk of (G). (J and K) Quantification of the area at risk (J) and infarct region over area at risk (K) of WT, ANT2-only, and ANT-cTKO mice pretreated with CsA (10 mg/kg) and then subjected to I/R injury. **P ≤ 0.01; ***P ≤ 0.001; ****P ≤ 0.0001.
Fig. 6.
Fig. 6.. Generation and baseline characterization of ANT1P62A expressing mice.
(A) Left: Schematic and sequence analysis of the generation of Ant1P62A mutant allele. Right: Genotyping gel for Ant1 spanning the P62A allele cut with or without Nru I was run using DNA isolated from Ant1WT/WT and Ant1P62A/P62A mice. bp, base pairs. (B) Representative Western blots using cardiac mitochondrial protein isolates from WT, ANT1P62A, and ANT1P62A-only expressing mice of ANT1, ANT2, ANT4, CypD, and UQCRC2 (loading control). (C) Protein quantifications of ANT1 and ANT2 over UQCR2 expression relative to the WT sample. (D) Quantification of the heart weight to body weight and heart weight to tibia length ratios of WT, ANT1P62A, and ANT1P62A-only mice. (E) Representative whole hearts and cross sections of WT, ANT1P62A, and ANT1P62A-only hearts stained with H&E or Masson’s trichrome (MT). (F) Echocardiographic analysis for ejection fraction and fractional shortening of WT, ANT1P62A, and ANT1P62A-only mice.
Fig. 7.
Fig. 7.. Proline-62 within ANT1 is dispensable for regulating mitochondrial CRC and swelling.
(A) Representative mitochondrial calcium uptake of cardiac mitochondria isolated from WT and ANT1P62A expressing mice treated with or without 300 μM ADP and/or 2 μM CsA. Each bolus of calcium is 20 μM CaCl2 and is indicated by black triangles, and red triangles indicate the addition of 7 μM alamethicin. (B) Mitochondrial swelling corresponding to (A). (C) Representative mitochondrial calcium uptake of cardiac mitochondria isolated from ANT1P62A-only expressing mice treated with or without 300 μM ADP and/or 2 μM CsA. Each bolus of calcium is 20 μM CaCl2 and is indicated by black triangles, and a red triangle indicates the addition of 7 μM alamethicin. (D) Mitochondrial swelling corresponding to (C). (E to H) Quantification of the mitochondrial CRC calculated from (A) and (C). Three independent experiments (n = 3) were performed for every panel.
Fig. 8.
Fig. 8.. ANT1P62A-only expressing mice are sensitive to CypD inhibition for reducing the infarct size.
(A to D) Representative cross section of Evans blue dye and 2,3,5-triphenyltetrazolium chloride stained WT and ANT1P62A-only mice treated with vehicle [(A) and (C)] or CsA (10 mg/kg) [(B) and (D)]. Mice were then subjected to cardiac I/R injury by 60 min followed by 24 hours of reperfusion. Scale bars, 1 mm. (E and F) Quantification of the area at risk and infarct region over area at risk of WT mice (E) and ANT1P62-only mice (F). *P ≤ 0.05; **P ≤ 0.01.

References

    1. Konstantinidis K., Whelan R. S., Kitsis R. N., Mechanisms of cell death in heart disease. Arterioscler. Thromb. Vasc. Biol. 32, 1552–1562 (2012). - PMC - PubMed
    1. Endlicher R., Drahota Z., Štefková K., Červinková Z., Kučera O., The mitochondrial permeability transition pore—Current knowledge of its structure, function, and regulation, and optimized methods for evaluating its functional state. Cells 12, 1273 (2023). - PMC - PubMed
    1. Bernardi P., Gerle C., Halestrap A. P., Jonas E. A., Karch J., Mnatsakanyan N., Pavlov E., Sheu S.-S., Soukas A. A., Identity, structure, and function of the mitochondrial permeability transition pore: Controversies, consensus, recent advances, and future directions. Cell Death Differ. 30, 1869–1885 (2023). - PMC - PubMed
    1. Karch J., Kwong J. Q., Burr A. R., Sargent M. A., Elrod J. W., Peixoto P. M., Martinez-Caballero S., Osinska H., Cheng E. H., Robbins J., Kinnally K. W., Molkentin J. D., Bax and Bak function as the outer membrane component of the mitochondrial permeability pore in regulating necrotic cell death in mice. eLife 2, e00772 (2013). - PMC - PubMed
    1. Patel P., Mendoza A., Robichaux D. J., Wang M. C., Wehrens X. H., Karch J., Inhibition of the anti-apoptotic Bcl-2 family by BH3 mimetics sensitize the mitochondrial permeability transition pore through Bax and Bak. Front. Cell Dev. Biol. 9, 765973 (2021). - PMC - PubMed

MeSH terms

Substances

LinkOut - more resources