. 2024 Dec 13;10(50):eads0427.
doi: 10.1126/sciadv.ads0427. Epub 2024 Dec 11.

Nucleo-cytoplasmic environment modulates spatiotemporal p53 phase separation

Affiliations

Nucleo-cytoplasmic environment modulates spatiotemporal p53 phase separation

Debalina Datta et al. Sci Adv. .

Abstract

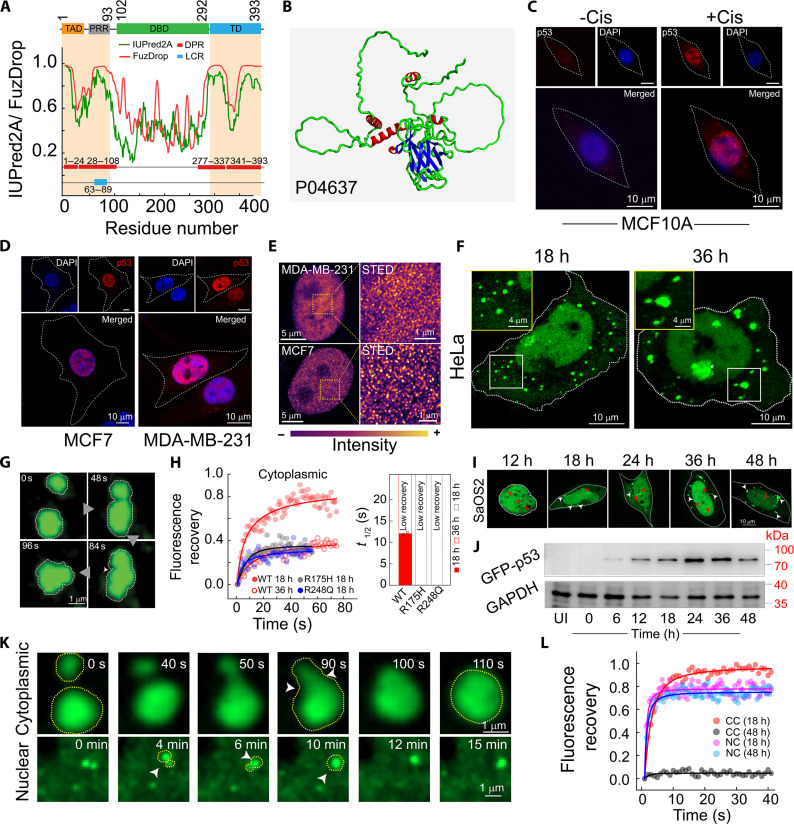
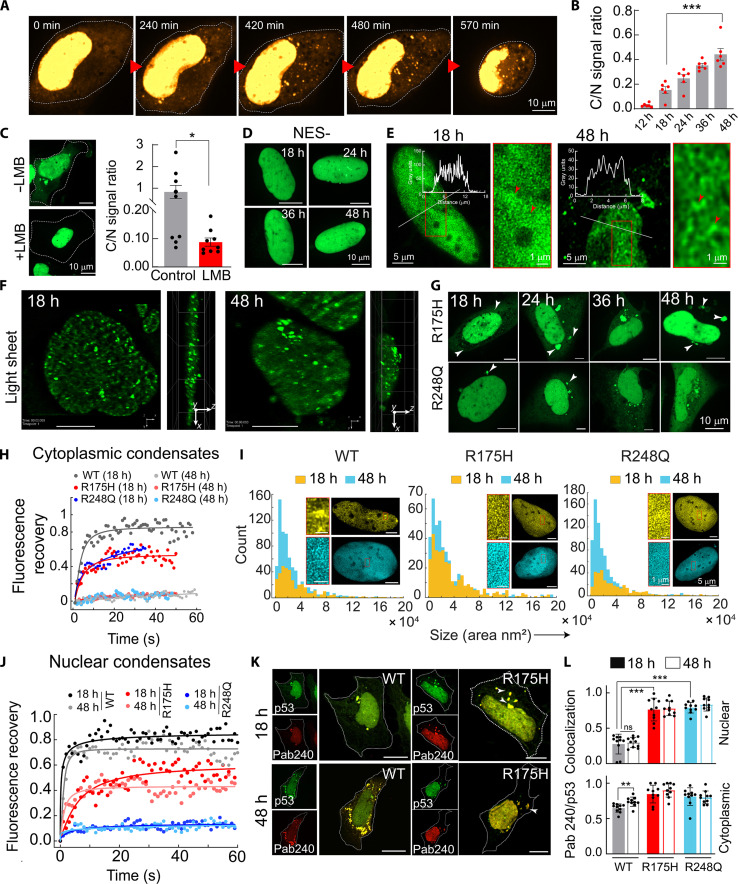
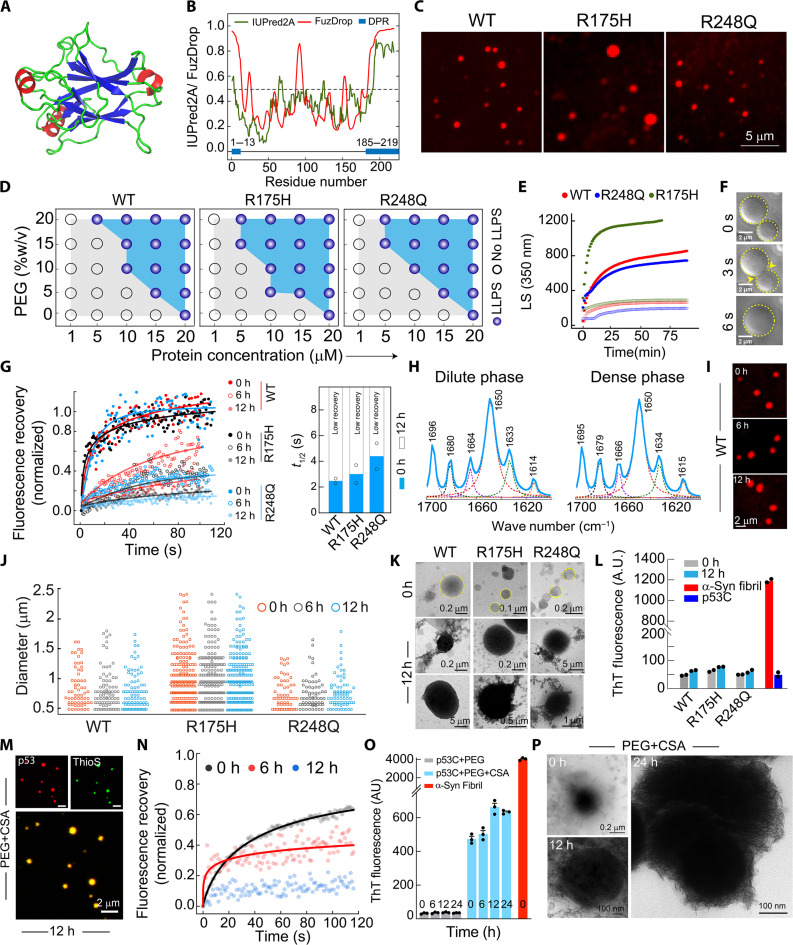
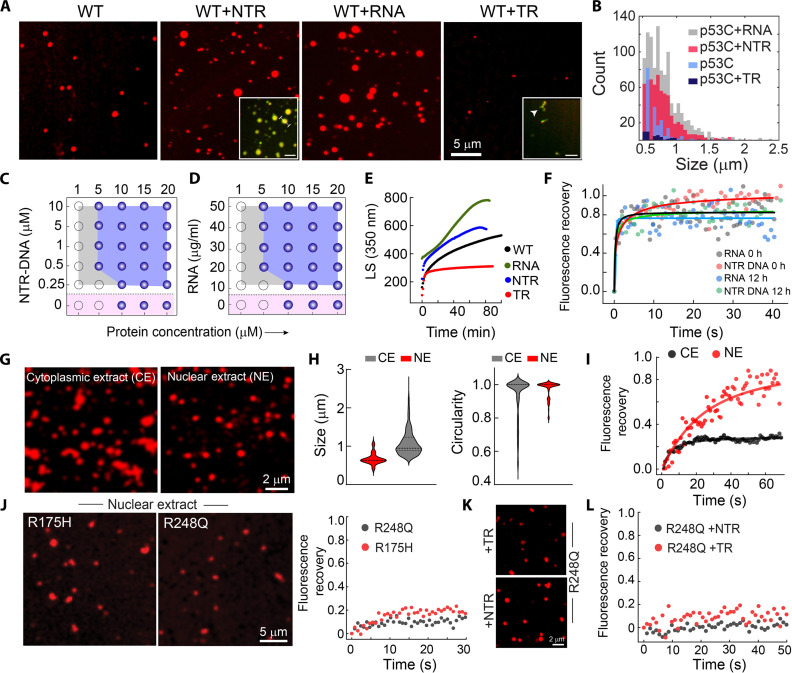
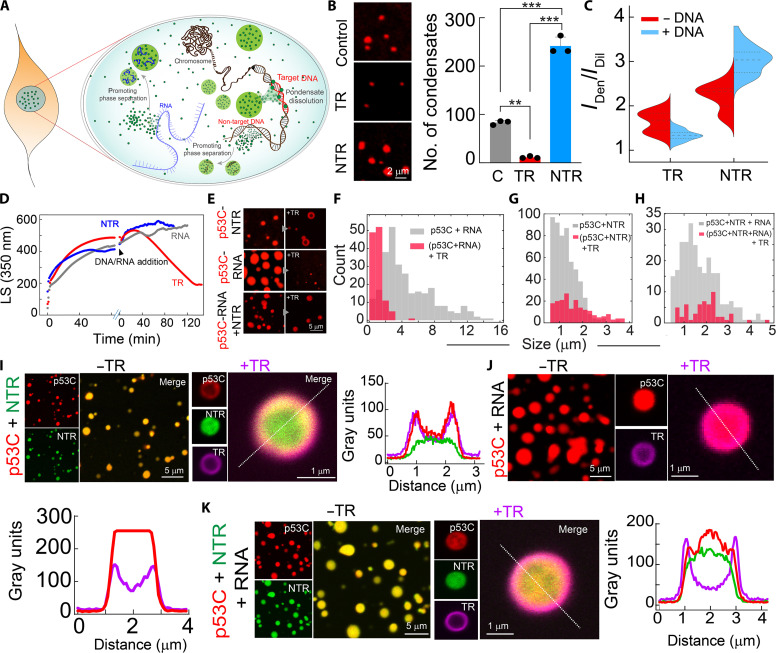
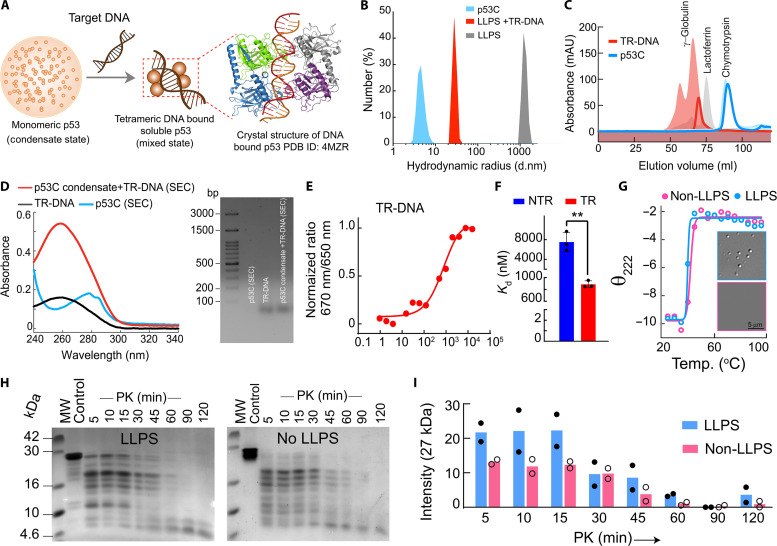
Liquid-liquid phase separation of various transcription factors into biomolecular condensates plays an essential role in gene regulation. Here, using cellular models and in vitro studies, we show the spatiotemporal formation and material properties of p53 condensates that might dictate its function. In particular, p53 forms liquid-like condensates in the nucleus of cells, which can bind to DNA and perform transcriptional activity. However, cancer-associated mutations promote misfolding and partially rigidify the p53 condensates with impaired DNA binding ability. Irrespective of wild-type and mutant forms, the partitioning of p53 into cytoplasm leads to the condensate formation, which subsequently undergoes rapid solidification. In vitro studies show that abundant nuclear components such as RNA and nonspecific DNA promote multicomponent phase separation of the p53 core domain and maintain their liquid-like property, whereas specific DNA promotes its dissolution into tetrameric functional p53. This work provides mechanistic insights into how the life cycle and DNA binding properties of p53 might be regulated by phase separation.


Figures

Fig. 1.
Fig. 1.. p53 condensate formation in HeLa and SaOS2 cells.
(A) Domain organization of p53 showing TAD (1 to 61), PRR (64 to 93), DBD (102 to 292), and TD (325 to 393) (top), low-complexity regions (blue) using SMART, disorder tendency (green) using IUPRED2A, residue-based droplet promoting probabilities (red), and droplet-promoting regions (DPR) (red box) using FuzDrop (bottom). (B) Structure of full-length p53 protein as predicted by Alphafold from 229 structures in PDB (UniProt ID P04637). (C) Confocal images of MCF10A cells showing p53 localization with (right) and without (left) cisplatin treatment. (D) The confocal microscopy showing the p53 (red) localization in MCF7 and MDA-MB-231. (E) STED microscopy of MDA-MB-231 and MCF7 cells showing p53 condensate state in the nucleus. Pseudocolor (LUT, mpl-plasma) has been used for representative purposes. (F) HeLa cells overexpressing WT GFP-p53 at 18 and 36 hours show cytoplasmic condensates. h, hours. (G) Time-lapse microscopic images showing fusion of WT GFP-p53 condensates in the cytoplasm of HeLa cells. (H) FRAP curves of cytoplasmic condensates in HeLa cells at 18 and 36 hours showing fluorescence recovery with (right) their corresponding t1/2. Note that the t1/2 for condensates with low recovery was not estimated. (I) Time-dependent expression of WT GFP-p53 in SaOS2 cells showing nuclear (red arrowheads) and cytoplasmic condensates (white arrowheads). (J) Western blot images showing the expression of GFP-p53 with time in SaOS2 cells. (K) Time-dependent confocal images of cytoplasmic and nuclear condensates of WT GFP-p53 showing the fusion event of two condensates. (L) FRAP curves of nuclear (NC) and cytoplasmic condensate (CC) at 18 and 48 hours. All the experiments [(C) to (L)] were repeated two times with similar observations.
Fig. 2.
Fig. 2.. Spatiotemporal formation of p53 condensates in p53-null SaOS2 cells.
(A) Time-lapse confocal microscopy images showing spatiotemporal formation of p53 condensates. (B) Cytoplasmic/nuclear (C/N) ratio of WT GFP-p53 fluorescence signal in SaOS2 cells with time (mean ± SEM for n = 6 transfected cells). (C) Confocal microscopy images showing the effect of Leptomycin B (LMB) treatment (left) and corresponding C/N ratio calculation (right) of SaOS2 cells (mean ± SEM for n = 9 transfected cells). (D) The time-lapse confocal microscopy showing nuclear localization of the p53 with p53 NES− in SaOS2 cells. (E) STED microscopy of nuclear condensates of WT GFP-p53 at 18 and 48 hours. The line profile represents the intensity of GFP-p53 across the nucleus. (F) Lattice light-sheet imaging of nuclear condensates of SaOS2 transfected with WT GFP-p53 at 18 and 48 hours. Scale bars, 10 μm. (G) p53 condensates of R175H and R248Q in SaOS2 cells monitored over time using confocal microscopy. (H) FRAP recovery profiles of WT, R175H, and R248Q cytoplasmic condensates at 18 and 48 hours. (I) Size (area) and number distribution of nuclear condensates of WT, R175H, and R248Q at 18 and 48 hours, calculated from STED microscopy. Scale bars, 5 μm. (J) FRAP recovery profile of WT, R175H, and R248Q nuclear condensates at 18 and 48 hours. (K) Immunofluorescence study of WT GFP-p53 condensates with misfolded p53 specific antibody (Pab240). Scale bars, 10 μm. (L) Quantification of Pab240 colocalization with GFP-p53 nuclear and cytoplasmic condensates at 18 and 48 hours (mean with SEM, for N = 2). For (B), (C), and (L), the statistical significance was calculated using a two-tailed t test [***P < 0.001, **P < 0.002, *P < 0.033, and P > 0.012 (ns), with 95% confidence interval]. The experiments (A), (C) to (H), (J), and (K) were performed two independent times.
Fig. 3.
Fig. 3.. Stabilization and activity of p53 condensates.
(A and B) Western blot showing time-dependent expression of p21 (p53 target) and the corresponding fold change of p21. (C) Time-dependent apoptotic cell death of SaOS2 cells using FACS analysis. (D) p53 DNA binding capacity of p21-specific DNA sequence by ELISA at 18 hours for WT and p53 mutants. (E) ChIP assay of p53 DNA binding to p21-response element at 18 hours. For ELISA and ChIP assays, one-way analysis of variance (ANOVA) (***P < 0.001, **P < 0.01, *P < 0.05). (F) SaOS2 cells transfected with WT GFP-p53 after treatment with cisplatin showing p53 condensates at 18 hours (left). Scale bar, 10 μm. Super-resolution STED imaging showing the p53 clusters in the nucleus after treatment at 18 hours (right). (G) Size/number distribution of nuclear condensates for cisplatin-treated and untreated cells. (H) Condensates count in uniform area of (5 μm by 5 μm, N = 2) in the nucleus of cisplatin-treated SaOS2 cells. (I and J) Western blot of p53 expression with and without treatment of cisplatin (10 μM, 9 hours). (K) The p21 mRNA expression of SaOS2 cells at 18 hours in the presence and absence of cisplatin treatment {(H) and (K), two-tailed t test [***P < 0.001, **P < 0.002, *P < 0.033, and P > 0.012 (ns)]}, [(A) to (F) and (I) to (K)] N = 2. (L) Immunofluorescence of SaOS2 cells showing no colocalization with WT p53 and MDM2. In a few cells, cytoplasmic condensates of large size partially colocalizes with MDM2. (M) SaOS2 cells transfected with WT GFP-p53 after treatment with Nutlin showing p53 cytoplasmic condensates at 18 hours (left). Scale bar, 10 μm. STED imaging showing the presence of p53 clusters in the nucleus after treatment at 18 hours (right). (N) Estimation of condensate count in the nucleus of Nutlin-treated (Nut) and untreated (WT) cells. (O) FRAP recovery profiles of cytoplasmic condensates with Nutlin-treated cells.
Fig. 4.
Fig. 4.. Liquid-liquid phase separation of p53C condensates in vitro and their transition from liquid to arrested state.
(A) The PDB structure of p53C (PDB ID: 2OCJ) shows random coil and β sheet conformation. (B) WT p53C shows disorder tendency (green), residue-based droplet-promoting probabilities (red), and droplet-promoting regions (DPR) (blue box). (C) Microscopy images showing the condensate formation of WT, R175H, and R248Q p53C (N = 3). (D) Phase regimes (schematic) of WT, R175H, and R248Q. Opaque and open circles represent LLPS and no LLPS, respectively. (E) Static light scattering (LS at 350 nm) showing condensate formation by WT p53C, R175H, and R248Q in the presence (filled circles) and absence (open circles) of 10% PEG-8000. (F) Time-lapse DIC images showing the fusion event of two WT p53 condensates with time. Scale bars, 2 μm. (G) FRAP experiment at different time intervals of WT p53C, R175H, and R248Q variants with t1/2 calculation (right). (H) FTIR spectroscopy of dense and dilute phase of WT p53 after centrifugation. (I) Confocal microscopy images WT p53C condensates at different time intervals. (J) The size distribution of WT, R175H, and R248Q condensates with time. (K) TEM micrographs WT p53C, R175H, and R248Q condensates at 0 and 12 hours. (L) The ThT binding p53C condensates at 12 hours. α-Synuclein fibrils were used as a positive control. N = 3 for (C), (D), and (I), and N = 2 for (E) to (H), (K), and (L). (M) ThioS staining of WT p53C condensates formed in the presence and absence of CSA at indicated time points (n = 3 independent experiments). (N) The FRAP of WT p53C condensates in the presence of CSA. (O) The ThT binding for p53C condensates in the presence of CSA. α-Synuclein fibrils were used as a positive control (N = 3). (P) TEM micrographs of condensates in the presence of CSA.
Fig. 5.
Fig. 5.. DNA and RNA modulate p53C phase separation.
(A) Confocal images of WT p53C condensates formed in the presence and absence of target DNA (TR-DNA), nontarget DNA (NTR-DNA), and RNA. The inset for NTR-DNA and TR-DNA represents multicomponent condensate formation. (B) Size (Feret) distributions of p53C condensates formed in the presence and absence of TR-DNA, NTR-DNA, and RNA. (C and D) Phase regime of WT p53C with varying concentrations of NTR-DNA and RNA. Opaque and open circles represent LLPS and no LLPS, respectively. Pink shaded region showing p53 condensates in the absence of any nucleic acid. (E) Static light scattering (LS at 350 nm) showing the effect of RNA, NTR-DNA, and TR-DNA for p53C condensate formation. (F) FRAP profile of p53C condensates in the presence of NTR-DNA and RNA showing a complete recovery at the early (0 hours) and late (12 hours) time points, suggesting maintenance of the liquid-like state. (G) The confocal image of NHS-Rhodamine–labeled p53C condensates formed in the cellular fraction of the nuclear extract (NE) and cytoplasmic extract (CE). Scale bar, 2 μm. (H) The size and circularity distribution of p53C condensates formed in the presence of CE and NE showing larger size in CE with lesser circularity in comparison to condensate formed in the NE. (I) FRAP of p53C condensates formed in NE and CE. The experiments (A), (C), (D), and (G) were repeated three independent times and (E), (F), and (I) were repeated two independent times. (J) The confocal image of p53C mutant (R175H and R248Q) condensates formed in NE (left). FRAP profile of R175H and R248Q condensates formed in NE (right). (K) Representative confocal images of preformed R248Q condensates after adding TR-DNA and NTR-DNA. (L) FRAP of preformed R248Q condensates after adding TR-DNA and NTR-DNA, showing negligible fluorescence recovery.
Fig. 6.
Fig. 6.. Effect of DNA/RNA on preformed p53C condensates.
(A) Schematic showing the possible mode of operation of p53 in the nuclear microenvironment. (B) Left: Representative images of preformed p53 condensates after the addition onto the uncoated and TR- and NTR-DNA-coated coverslips. Right: The calculated number of condensates with various nucleic acid–coated surfaces and uncoated coverslips were taken as control (C). The statistical significance was determined by one-way ANOVA using Newman-Keuls (SNK) post hoc analysis (***P < 0.001, **P < 0.01). (C) Split-violin plot represents the change in the partitioning of p53C after adding TR-DNA and NTR-DNA. (D) Static light scattering (LS at 350 nm) showing the kinetics of p53C in the presence of 10% (w/v) PEG-8000 and the effect after the addition of TR-DNA, NTR-DNA, and RNA. The data showing a decrease in light scattering value in the presence of TR-DNA, suggesting the dissolution of preformed p53C condensates. (E) The confocal microscopy images showing the effect of TR-DNA on preformed p53C condensates formed in the presence of NTR-DNA (p53C-NTR DNA), RNA (P53C-RNA), and RNA + NTR-DNA (p53-RNA-NTR-DNA) condensates. (F to H) Size distribution plot showing the reduction in the size/numbers of condensates after the addition of TR-DNA to (F) p53C-RNA condensates, (G) p53C-NTR-DNA condensates, and (H) p53C-RNA-NTR-DNA condensates. (I to K) The confocal microscopy images show few residual condensates observed after condensate dissolution due to the addition of TR-DNA. The left panel represents Rhod-p53 condensates formed in the presence of (I) Atto 488–labeled NTR DNA, (J) RNA, and (K) RNA and Atto 488–labeled NTR-DNA. The middle panel represents residual p53C condensates that remained after the addition of Atto 647N–labeled TR-DNA. The right panel represents a line profile across the condensates to show the spatial distribution of protein and DNA. The experiments (B), (D), (E), and (I) were repeated two independent times.
Fig. 7.
Fig. 7.. Specific DNA modulates the p53C condensates for functionality.
(A) The proposed model of p53 regulation through p53 phase separation. Crystal structure showing the core domain bound with DNA consensus element of p53 in tetrameric form. (B) Dynamic light scattering profile of p53C monomer, p53C condensates alone, and p53C condensates dissolved in the presence of the specific DNA. (C) SEC measurement of p53C monomer and p53C condensate in the presence of target DNA showing a peak approximately at 100 kDa, confirming tetrameric state. γ-Globulin (150 kDa), lactoferrin (78 kDa), and chymotrypsin (25 kDa) are used as markers in SEC. (D) The SEC eluted the oligomeric fraction of p53C condensates in the presence of TR-DNA, showing the presence of DNA bound with protein using UV spectroscopy (left) and agarose gel electrophoresis (right). (E) Spectral shift measurement of p53C in the presence of TR-DNA showing binding affinity of p53C with nucleic acids. (F) Bar graph representing the binding affinity (Kd) of p53C with TR-DNA and NTR-DNA showing a significantly higher binding affinity for TR-DNA. Error bars represent mean ± SEM for N = 3 independent experiments. The statistical significance was estimated with an unpaired t test with 95% confidence interval (**P < 0.002). (G) The change in molar ellipticity at θ222 with an increase in temperature shows no major changes in temperature denaturing profiles between the LLPS and non-LLPS state of p53C. Representative microscopic images of p53C in LLPS and non-LLPS states for the temperature-dependent CD experiment are shown. (H) Proteinase K (PK) digestion was followed by SDS-PAGE and showed the higher PK resistivity of the p53 LLPS state. (I) SDS-PAGE quantification of PK digestion assay of LLPS and non-LLPS p53C showing faster PK digestion with time of p53C in the non-LLPS state compared to the LLPS state. The experiments (B) to (H) were repeated two independent times.

References

    1. Friedman J. R., Nunnari J., Mitochondrial form and function. Nature 505, 335–343 (2014). - PMC - PubMed
    1. Luzio J. P., Pryor P. R., Bright N. A., Lysosomes: Fusion and function. Nat. Rev. Mol. Cell Biol. 8, 622–632 (2007). - PubMed
    1. Boisvert F.-M., van Koningsbruggen S., Navascués J., Lamond A. I., The multifunctional nucleolus. Nat. Rev. Mol. Cell Biol. 8, 574–585 (2007). - PubMed
    1. Banani S. F., Rice A. M., Peeples W. B., Lin Y., Jain S., Parker R., Rosen M. K., Compositional control of phase-separated cellular bodies. Cell 166, 651–663 (2016). - PMC - PubMed
    1. Shin Y., Brangwynne C. P., Liquid phase condensation in cell physiology and disease. Science 357, 1253 (2017). - PubMed