. 2025 Feb;12(5):e2407398.
doi: 10.1002/advs.202407398. Epub 2024 Dec 11.

MAM-STAT3-Driven Mitochondrial Ca+2 Upregulation Contributes to Immunosenescence in Type A Mandibuloacral Dysplasia Patients

Affiliations

MAM-STAT3-Driven Mitochondrial Ca+2 Upregulation Contributes to Immunosenescence in Type A Mandibuloacral Dysplasia Patients

Arshad Ahmed Padhiar et al. Adv Sci (Weinh). 2025 Feb.

Abstract

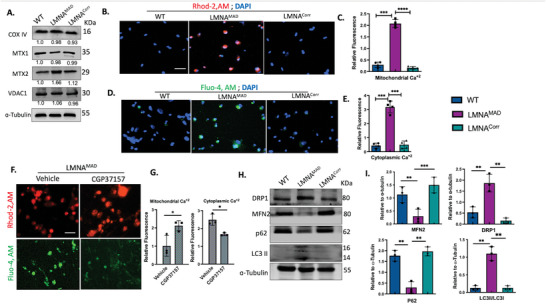
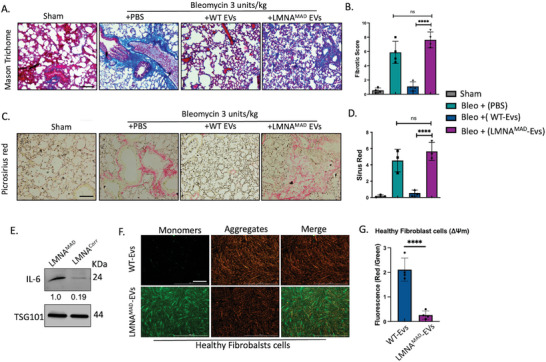
Individuals with homozygous laminA/C p.R527C mutations manifest a severe form of Mandibuloacral dysplasia-(MAD) and exhibit overlapping progeroid symptoms, for which the underlying molecular pathology remains unknown. Herein, it is shown that MAD patients achieved inflammaging with different pro-inflammatory cytokines compared to progeria-(HGPS) patient. Characterization of MAD iPSC-derived Mesenchymal stem cells (MAD-iMSC) uncovers deregulated mitochondrial Ca+2 as the primary cause of inflammaging, mediated through inflammasome formation rather than the cGAS-STING pathway. Moreover, MAD-iMSCs extracellular vesicles (EVs) can also upregulate mitochondrial Ca+2 in healthy cells. This deregulated Ca+2 homeostasis is indirectly mediated by mitochondrial calcium mediator, signal transducer, and activator of transcription-3 (STAT3), situated on the mitochondrial associated membrane (MAM). Inflammaging is mitigated by various FDA-approved MAM-STAT3 upstream inhibitors, such as (Tocilizumab) or by correcting R527C mutation with CRISPR/CAS9. These results provide new insights into MAD disease and propose targeting defective mitochondrial Ca+2 homeostasis as a promising therapy for reversing immunosenescence.

Keywords: calcium homeostasis; extracellular vesicles (EVs); inflammaging; mandibuloacral dysplasia (MADA); mitochondrial dysfunction; progeroid symptoms.


Conflict of interest statement

The authors declare no conflict of interest.

Figures

Figure 1
Figure 1
Clinical and molecular pathological features of LMNA p.R527C MAD and HGPS patients. A) Electropherograms depicting LaminA/C homozygous p.R527C mutations of patient, their asymptomatic, heterozygous siblings/parents, wild‐type healthy controls, and the patient bearing LaminA/C p.G608G mutation. Patients: MAD1 (Female, 3 y); MAD2 (Male, 5 y), MAD3 (Male, 7 y), HGPS (Male 1 y). Controls: C1 (Female, 3 y); C2 (Male, 5 y); C3 (Male, 7 y); C4 (Male, 1 y). B) The pedigrees of three ethnically distinct families, where two families has LaminA/C p.R527C mutations, and one has LaminA/C p.G608G mutation. Squares represent males, circles represent females; filled, half‐filled and unfilled symbols reflect affected individuals, asymptomatic carriers and non‐carriers of the p.R527C mutations, respectively. Stripes represents HGPS with p.G608G mutation C) Images of patients with homozygous LaminA/C p.R527C mutations showing mandible hypoplasia with crowded teeth, severe contracture at the interphalangeal joints, flexion deformity of the fingers, club‐shaped phalanges or rounding of fingertips with marked acro‐osteolysis. Frequent ulceration and scleroderma were observed on the lower trunk of MAD patients. D) Measurement of cytokine levels in patient serum, normalized with age‐matched healthy controls, represented as fold change. Graphs display the mean and standard error of the mean (SEM) from one experiment (n = 1) conducted in triplicate, with error bars not visible due to the scale of the figure. E–G) Data presented as relative values with a shared Y‐axis, representing different cell populations as percentages. Combining graphs enables a clear comparison between control and patient groups across various conditions.
Figure 2
Figure 2
MAD iMSCs showed accelerated senescence and impaired adipogenesis and osteogenesis. A) Immunofluorescence staining for LaminA/C (green) in iPSCs (passage 22). Nuclei stained with DAPI (blue), and phalloidin (red) served as a counterstain (n = 5). Scale bar: 100 µm. B) Western blot and C) relative band intensity showed increased expression of laminA/C with passage number, although this expression was significantly lower in LMNAMAD iMSCs compared with WT‐iMSCs. D,E) Tri‐lineage differentiation of iMSCs (n = 3). After 18 days, oil‐red‐oil dye staining indicated increased lipid droplet accumulation in MAD‐iMSCs compared to controls. Alizarin staining after 14 days demonstrated elevated nodular structure and calcium content in MAD‐iMSCs during osteogenic differentiation. Alcian blue dye showed no difference in MAD‐iMSCs compared to controls in cartilage matrix formation, rich in aggrecan, after 21 days of differentiation (n = 5). Scale bar represent 200 µm. Graphs depicts quantification of Oil red O, alizarin red and Alcian blue staining by suspending it 2‐propanol, 10% acetic acid and 8 M Guanidine HCL solution respectively F) Alkaline phosphatase enzyme levels measured on day 7 of osteogenic differentiation (n = 3). G) Representative images of Nuclei stained with DAPI and H) the percentage of the cells with abnormal nuclear morphology in MAD‐iMSCs, including nuclear blebbing and honeycomb nuclei, as revealed by DAPI staining. Scale bar: 20 µm (n = 8). I) Cell proliferation plotted against cell doubling time (n = 3). J) Western blot of whole cell lysates at passage 10. The relative band intensity shown below each band, represents the average of three independent experiments K) Quantification of cell senescence at the indicated passage in MAD‐iMSCs and WT‐iMSCs using beta‐galactosidase staining. Scale bar: 200 µm. Data were expressed as means ± standard deviation (SD) *p < 0.05, **p < 0.01, ***p < 0.001, ****p < 0.0001 with comparisons indicated by lines. C, I, E, F: Unpaired two‐tailed Student's t‐test (n ≥ 5). H: Two‐way analysis of variance with Tukey's multiple comparison (n = 6).
Figure 3
Figure 3
Mitochondrial dysfunction in MAD patient iMSCs is rescued by CRISPR/CAS9 correction. A) DCFH‐DA staining and B) it's relative fluorescence intensity analysis revealed no significant change in MAD or wildtype iMSCs. Healthy iMSCs, treated with Rosup to induce oxidative stress, served as a positive control. Scale bar = 200 µm. C,D) Representative immunofluorescent staining illustrated mitochondrial network morphology using Mitotracker (red); scale bar represents 20 µm. There was a significant difference in mean branch per network, number of individual/counts, mitochondrial footprints, and total number of mitochondrial networks in MAD‐iMSCs compared with wild type cells. E) ATP production was quantified and presented as relative to total protein concentration. F,G) Cells stains with JC‐1 dye were quantified to observe mitochondrial membrane potential. Scale bar = 200 µm. H,I). Mitochondrial membrane potential, analyzed with JC‐1 dye, showed less monomer (green) in CRISPR/CAS9 corrected iMSCs; scale bar = 20 µm. J,K) Mitochondrial fragmentation was rescued when MAD‐iMSCs was corrected with CRISPR/CAS9. The scale bar represents 200 µm. All experiments presented in the figure were conducted between 7 to 10 cell passage number. Data were expressed as means ± standard deviation (SD). *p < 0.05, **p < 0.01, ***p < 0.001, ****p < 0.0001, ns: non‐significant difference with comparisons indicated by lines. Unpaired two‐tailed Student's t‐test, (n = ≥ 6).
Figure 4
Figure 4
Impaired calcium regulation in MAD patient iMSCs. A) Western blot analysis of whole cell lysates from wildtype‐iMSCs (WT), MAD‐iMSCs (LMNAMAD), and LMNA‐corrected iMSCs (LMNACorr). The band intensities, depicted below each band, represent the average values obtained from three independent experiments and were normalized to α‐tubulin. Mitochondrial internal control proteins (VDAC1 and COX‐IV) and mitochondrial membrane proteins (MTX1 and MTX2) showed consistent expression levels. B–C) iMSCs were loaded with 0.2 µM Rhod‐2, AM for 20 min in PBS, and mitochondrial Ca+2 levels were quantified with live imaging using a lion‐x heart microscope, Ex/Em 550/585 (n = 5). Scale bar represents 100 µm. D–E) Cytoplasmic Ca+2 levels were measured by loading iMSCs with 2 uM Fluo‐4, AM and imaging at Ex/Em 488/525. The scale bar corresponds to 100 µm. F–G) MAD‐derived iMSCs were first incubated with 30 µM CGP37157 for 20 min followed by loading with Rhod‐2, AM or with Fluo‐4, AM. Decreases in the percentage of the Fluo‐4 population in the CGP37157 treatment group showed that the rise in cytoplasm Ca+2 in MAD‐iMSCs was dependent on mitochondrial calcium levels. Scale bar = 100 µm H–I) DRP1, MFN2, p62 and LC3II and LC3I expression from whole iMSC cell lysate was analyzed using western blot analysis. Bands were quantified using image J software and the expression levels were normalized to alpha‐tubulin (n = 4). In all the cases the error bar represents the standard deviation *p < 0.05, **p < 0.01, ***p < 0.001, ****p < 0.0001 with comparisons indicated by lines. C, E, and I: One‐way ANOVA with Dunnett's post hoc test (n  =  6); G: Unpaired two‐tailed Student's t‐test, (n = 4).
Figure 5
Figure 5
Activation of the inflammasome in MAD‐iMSCs. A,B) RT‐qPCR analysis of pro‐inflammatory cytokines in MAD‐iMSCs (LMNAMAD) and corrected‐iMSCs (LMNACorr) at passage 9–12 of cell culture (n = 3). C,D) cGAS, STING, TBK‐1, and p‐TBK1 expression in whole cell lysate was analyzed by western blotting. Band intensities were quantified using Image‐J software and normalized with GAPDH (n = 4) E‐F) AIM2 and NLRP3 expression was increased in MAD‐iMSCs (n = 3). G) Representative western blot from whole cell lysate (cell passage number 11) showed the expression of γ‐H2AX (n = 5). Band intensity values, represented below each band, are relative to the internal control. H) Immunofluorescence staining of γ‐H2AX (green), nucleus (blue), phalloidin (red) was performed between 10 to 14 cell passage number (n = 4). The scale bar represents 200 µm. I) RT‐qPCR analysis of Line‐1 from cDNA, transcribed using hexamers (n = 3). In all the cased the error represents the standard deviation. Unpaired two‐tailed Student's t‐test, *p < 0.05, **p < 0.01, ***p < 0.001, ns: non‐significant difference with comparisons indicated by line.
Figure 6
Figure 6
Disrupted nuclear lamina and heterochromatin remodeling activates MAM‐STAT3 in MAD MSCs. A) Representative images show the immunofluorescent staining of laminA/C (red), LaminB1 (Green), LaminB2 (Green), and Emerin (Green), with nuclei stained with DAPI (Blue). Scale bar = 20 µm. B) Western blot analysis from whole cell lysate showed the decreased expression of the nuclear lamina proteins laminB1, LaminB2 and Emerin in MAD‐iMSCs. The relative band intensity in the Western blots, shown below each band, represents the average of three independent experiments and is also presented as a bar graph to highlight significant results. C‐E) Western blot analysis was performed after chromatin extraction from MAD‐iMSCs and corrected‐iMSCs. H3 and H4 represent the internal controls (n = 3). F) Western blot analysis of whole cell lysate showed decreased expression of nuclear sirtuin proteins, SIRT1, SIRT6, and SIRT7 (n = 4). G) Western blot analysis from whole cell lysate revealed the increased expression of IL‐6, and activated p‐STAT3y705 p‐STAT3s727 (n = 3). H) Immunofluorescent staining showed the co‐localization of p‐STAT3y705 with the mitochondrial associated membrane, while p‐STAT3s727 was found to be localized in the nucleus in MAD‐iMSCs. Scale bar = 20 µm. I,J) Wild type iMSCs were treated with 20 ng mL−1 IL‐6 for 24 h and evaluated for mitochondrial membrane potential; n = 3. Scale bar = 200 µm. In all the cases the error bar represents the standard deviation Unpaired two‐tailed Student's t‐test, *p < 0.05, **p < 0.01, ***p < 0.001, ****p < 0.0001, ns: non‐significant difference.
Figure 7
Figure 7
STAT3 inhibitor rescues nuclear and mitochondrial defects associated with LMNA p.R527C mutations. A,B) MAD‐iMSCs were treated with 10 µg mL−1 Tocilizumab for 24 h period. JC‐1 staining revealed that cells treated with Tocilizumab regained their lost mitochondrial membrane potential. Scale bar = 200 µm. C,D) Cells treated with tocilizumab for 24 h followed by quantification of Mitochondrial and cytoplasmic Ca+2 levels with Rhod‐2, AM, and Fluo‐4, AM dyes at Ex/Em 4550/585 and 488/425 nm, respectively. E,F) Mitotracker staining on Tocilizumab‐treated cells (post 7 days) showed decreases in mitochondrial fragmentation with increases in mitochondrial mean branch per network. G) MAD‐iMSC nuclei were stained with DAPI after 21 days of with Tocilizumab treatment. (n = 8). H) Beta‐galactosidase staining was performed after 21 days of tocilizumab (10 µg mL−1) treatment. Scale bar = 200 µm (n = 8). I) RT‐qPCR analysis of pro‐inflammatory cytokines in MAD‐iMSCs treated with tocilizumab for 48 h; n = 3. In all cases the error bar represents standard deviation. *p < 0.05, **p < 0.01, ***p < 0.001, ****p < 0.0001 with comparisons indicated by lines. B, D, F, and I: Unpaired two‐tailed Student's t‐test. G: Two‐way analysis of variance with Turkey's multiple comparison. All experiments presented in this figure were in between 9 to 13 cell passage number.
Figure 8
Figure 8
Fibrosis‐provoking effects of extracellular vesicles from MAD‐iMSC. A) Paraffin (5 µm)‐embedded lung tissue was sliced and stained with trichome‐masson dye. Scale bar = 100 µm. B) Quantification of Masson trichome staining. Fibrotic score was calculated on the basis of collagen content deposition and architectural destruction by two professional histologists that were blinded to the treatment. LMNAMAD exosomes could not rescue bleomycin induced fibrosis but enhanced the fibrotic score compared to group treated with PBS only, though it was non‐significant. C,D) Sectioned lung tissues were stained with Picrosirius dye, which showed collagen fibers in red. Scale bar = 100 µm. E) Western blot of EVs derived from patient iMSCs or healthy control. The relative band intensity shown below each band, represents the average of three independent experiments. F,G) Healthy fibroblast cells were treated with MAD‐iMSC exosomes for 24 h and then evaluated for mitochondrial membrane potential using JC‐1 dye. Scale bar = 200 µm. In all cases the error bar represents standard deviation. *p < 0.05, **p < 0.01, ***p < 0.001, ****p < 0.0001, ns: no significant difference with comparisons indicated by lines. B, D: One‐way ANOVA with Dunnett's post hoc test; G: Unpaired two‐tailed Student's t‐test.

References

    1. Cenni V., Capanni C., Mattioli E., Schena E., Squarzoni S., Bacalini M. G., Garagnani P., Salvioli S., Franceschi C., Lattanzi G., Ageing Res. Rev. 2020, 62, 101073. - PubMed
    1. Schreiber K. H., Kennedy B. K., Cell 2013, 152, 1365. - PMC - PubMed
    1. Gordon L. B., Massaro J., R. B. D'Agostino Sr., Campbell Susan E., Brazier J., Ted Brown W., Kleinman M. E., Kieran M. W., Circulation 2014, 130, 27. - PMC - PubMed
    1. Jéru I., Nabil A., El‐Makkawy G., Lascols O., Vigouroux C., Abdalla E., Genes (Basel) 2021, 12, 1508. - PMC - PubMed
    1. Lombardi F., Gullotta F., Columbaro M., Filareto A., D’Adamo M., Vielle A., Guglielmi V., Nardone A. M., Azzolini V., Grosso E., Lattanzi G., D’Apice M. R., Masala S., Maraldi N. M., Sbraccia P., Novelli G., J. Clin. Endocrinol. Metab. 2007, 92, 4467. - PubMed

MeSH terms

LinkOut - more resources