. 2025 Mar 13;145(11):1211-1224.
doi: 10.1182/blood.2024025618.

Single-cell epigenetic and clonal analysis decodes disease progression in pediatric acute myeloid leukemia

Affiliations

Single-cell epigenetic and clonal analysis decodes disease progression in pediatric acute myeloid leukemia

Boyu Cui et al. Blood. .

Abstract

Pediatric acute myeloid leukemia (pAML) is a clonal disease with recurrent genetic alterations that affect epigenetic states. However, the implications of epigenetic dysregulation in disease progression remain unclear. Here, we interrogated single-cell and clonal level chromatin accessibility of bone marrow samples from 28 patients with pAML representing multiple subtypes using mitochondrial single-cell assay for transposase-accessible chromatin with sequencing, which revealed distinct differentiation hierarchies and abnormal chromatin accessibility in a subtype-specific manner. Innate immune signaling was commonly enhanced across subtypes and related to improved advantage of clonal competition and unfavorable prognosis, with further reinforcement in a relapse-associated leukemia stem cell-like population. We identified a panel of 31 innate immunity-related genes to improve the risk classification of patients with pAML. By comparing paired diagnosis and postchemotherapy relapse samples, we showed that primitive cells significantly reduced major histocompatibility complex class II signaling, suggesting an immune evasion mechanism to facilitate their expansion at relapse. Key regulators orchestrating cell cycle dysregulation were identified to contribute to pAML relapse in drug-resistant clones. Our work establishes the single-cell chromatin accessibility landscape at clonal resolution and reveals the critical involvement of epigenetic disruption, offering insights into classification and targeted therapies of patients with pAML.


Conflict of interest statement

Conflict-of-interest disclosure: The authors declare no competing financial interests.

Review statement: Berthold Göttgens is an Associate Editor of Blood. As an author of this article, he was recused by journal policy from any involvement in its peer review and he had no access to information regarding the peer review process.

The current affiliation for B.C. is Department of Medical Technology, Anhui Medical College, Hefei, Anhui, China.

Figures

None
Graphical abstract
Figure 1.
Figure 1.
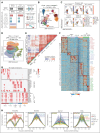
Single-cell chromatin accessibility profiling reveals pAML subtype-specific epigenetic features. (A) Schematic overview of the experimental workflow. Bone marrow mononuclear cells (BMMCs) and CD34+ cells were isolated from patients with pAML including 5 molecular subtypes at diagnosis (n = 28) and healthy donors (HDs; n = 8) and subjected to mitochondrial single-cell assay for transposase-accessible chromatin with sequencing (mtscATAC-seq). (B) Uniform manifold approximation and projection (UMAP) display of chromatin accessibility profiles of 36 586 single cells from HDs (BMMCs, n = 5; CD34+ HSPCs, n = 3). Dots represent individual cells, and colors indicate cluster identity. (C) Projection of disease cells onto the hematopoietic reference map in panel B. Gray dots denote cells from HDs, whereas colored dots represent cluster identities of malignant cells from patients. Bar plot showing the proportion of defined cell types in each patient with pAML. The dotted line highlights cell types significantly enriched in distinct subtypes, with a representative patient displayed for each subtype. (D) UMAP visualization of scATAC-seq data from all pAML samples (n = 28) and healthy individuals (n = 8) at single-cell level, with cells color-coded by molecular subtype. (E) Unsupervised hierarchical clustering of chromatin accessibility profiles across all patients including HD and pAML samples. (F) Heat map illustrating differentially accessible regions (n = 147 028) in each pAML subtype and HDs. The color represents normalized chromatin accessibility. Representative genes relevant to each subtype are displayed. (G) Enriched TF motifs based on differentially accessible regions in pAML. Top 5 motifs for each patient were displayed. Color represents significance of motif enrichment. (H) Footprints of subtype-specific TFs including POU4F3, RUNX2, GATA1, and FOS. Lines are colored by pAML subtypes. CDP, common dendritic cell progenitor; EBM, eosinophil/basophil/mast cell; GMP, granulocyte/macrophage progenitor; LMPP, lymphoid-primed multipotential progenitor; MDP, monocyte-dendritic cell progenitor; MEP, megakaryocyte/erythroid progenitor; MLP, multilymphoid progenitor; NeP, neutrophil progenitor; NK, natural killer cell; Pre-B, precursor B cell; Pro-B, progenitor B cell.
Figure 2.
Figure 2.
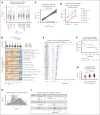
Innate immune signaling in primitive cells promotes advantage of clonal competition and predicts poor prognosis at diagnosis. (A) Box plot showing gene score of innate immune gene set (n = 334) in patients with pAML vs HDs among each cell type. N.S., not significant; ∗∗∗P < .001, Wilcoxon rank-sum test. (B) Violin plot (top) and heat map (bottom) showing gene score of innate immune gene set (n = 334) in primitive cells across distinct pAML subtypes and HDs. ∗∗∗P < .001, Wilcoxon rank-sum test. (C) Scatter plot showing the Spearman correlation (with a 95% confidence interval for the regression line) between the gene score of innate immune gene set (n = 334) and the clone size in pAML2 at diagnosis. The upper left corner displays the Spearman correlation coefficient (R) and the P value. (D) Gene score of innate immune gene set (n = 334) in each cell type compared between relapse and nonrelapse groups in different pAML subtypes. ∗P < .05; ∗∗P < .01, Wilcoxon rank-sum test. (E) Forest plot showing significant prognostic value of inScore genes (n = 31) by analyzing RNA-sequencing data from TARGET pediatric AML cohort. Lines represent confidence intervals (95%). The dotted vertical line indicates hazard ratio of 1. ∗P < .05; ∗∗P < .01; ∗∗∗P < .001, Wilcoxon rank-sum test. (F) Kaplan-Meier analysis of overall survival for pediatric patients with AML in the TARGET cohort based on the inScore signature (high inScore, n = 224; low inScore, n = 225). Log-rank test. (G) inScore of patients with pAML estimated by using microarray data from the TARGET cohort according to clinical risk categories: low risk (n = 99), intermediate risk (n = 144), and high risk (n = 52). ∗∗∗P < .001, Wilcoxon rank-sum test. (H) inScore in distinct pAML molecular subtypes estimated using microarray data from the TARGET cohort. (I) Forest plot showing hazard ratios from multivariate Cox regression analysis assessing the prognostic significance of the inScore as an independent metric for overall survival in the pediatric AML TARGET cohort. The median value of the inScore was used to define high and low groups. Hazard ratios with 95% confidence intervals are presented. CDP, common dendritic cell progenitor; COG, children's oncology group; EBM, eosinophil/basophil/mast cell; FCGR, Fc gamma receptor; GMP, granulocyte/macrophage progenitor; LMPP, lymphoid-primed multipotential progenitor; MDP, monocyte-dendritic cell progenitor; MEP, megakaryocyte/erythroid progenitor; MLP, multilymphoid progenitor; NeP, neutrophil progenitor; NK, natural killer cell; NLR, NOD-like receptors; Pre-B, precursor B cell; Pro-B, progenitor B cell; RNA-seq, RNA sequencing; RNS, reactive nitrogen species; ROS, reactive oxygen species.
Figure 3.
Figure 3.
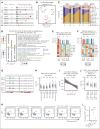
MHC class II signaling downregulation mediated immune evasion at postchemotherapy relapse. (A) Overview of paired diagnostic-relapse (Dx-Rel) patients with pAML in distinct subtypes. Pie charts indicate clinical blast count, and the time of sample collections relative to diagnosis. (B) UMAP display of 8 paired diagnostic and relapse pAML samples across distinct subtypes based on top 25 000 variable peaks. Shape and color represent relapse state. (C) Bar plot illustrating the shift of cellular composition from diagnosis to relapse in distinct subtypes. (D) Top 10 enriched GO terms of differentially accessible regions in HSC/MPP-like cells between paired diagnostic and relapse samples. Color indicates the significance of enrichment. (E) Gene score of MHC class II molecules in HSC/MPP-like cells between diagnostic and relapse samples across distinct subtypes. ∗P < .05; ∗∗P < .01, Wilcoxon rank-sum test. (F) Gene score of the positive regulators of MHC class II genes in HSC/MPP-like cells between diagnostic and relapse samples across distinct subtypes. ∗P < .05; ∗∗P < .01, Wilcoxon rank-sum test. (G) Genome browser tracks illustrating chromatin accessibility for CIITA (a positive regulator for MHC class II genes) and RREB1 (a negative regulator for MHC class II genes) in diagnostic and relapse samples across distinct pAML subtypes. Each track shows merged pseudo-bulk ATAC-seq signal. (H) Gene score of MHC class II genes across various cell types between relapse and diagnosis samples. ∗P < .05, Wilcoxon rank-sum test. (I) Scatter plot showing the Spearman correlation (with a 95% confidence interval for the regression line) between the gene score of MHC class II genes and the clone size in pAML2 at relapse. The upper left corner displays the Spearman correlation coefficient (R) and the P value. (J) Gene score of MHC class II genes compared between relapse and nonrelapse groups in different pAML subtypes. Wilcoxon rank-sum test. (K) Flow cytometry was used to assess T-cell activation by measuring the percentage of CD4+ T cells positive for activation marker CD69. CD4+ T cells were cocultured with KG-1 cells for 72 hours, which had been preincubated with either anti–HLA-DR, -DP, -DQ blocking antibodies (KG1 + T cell + block) or an isotype control antibody (KG1 + T cell + Iso). Data are gated on live CD4+ T cells. Three independent experiments are performed. (L) Box plot showing percentage of CD69+ T cells in CD4+ T-cell population across different experimental conditions. CD4+ T cells were either cultured in medium alone (T cell + Medium) or coculturing with KG-1 cells (KG1 + T cell + Iso, KG1 + T cell + Block) for 72 hours. ∗∗P < .01; ∗∗∗P < .001, Wilcoxon rank-sum test. CDP, common dendritic cell progenitor; CFSE, carboxyfluorescein succinimidyl ester; Dx, diagnostic; EBM, eosinophil/basophil/mast cell; GMP, granulocyte/macrophage progenitor; LMPP, lymphoid-primed multipotential progenitor; MDP, monocyte-dendritic cell progenitor; MEP, megakaryocyte/erythroid progenitor; MLP, multilymphoid progenitor; NeP, neutrophil progenitor; NK, natural killer cell; Pre-B, precursor B cell; Pro-B, progenitor B cell; Rel, relapse.
Figure 4.
Figure 4.
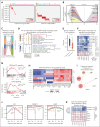
Identification of key regulators related to cell cycle dysregulation in drug-resistant clones. (A) Inference of clonal structure from somatic mtDNA mutations for pAML1 at diagnosis (left) and relapse (right). Each column represents a cell, and rows display detected mtDNA mutations. Color indicates heteroplasmy (% allele frequency). (B) Fish plot depicts the trajectory of clonal evolution inferred from mean heteroplasmy of mtDNA mutations from diagnosis to relapse for pAML1. (C) Diagram showing the discrimination of drug-resistant and drug-sensitive clones. (D) Top 10 enriched GO terms of differentially accessible regions in drug-resistant clones as compared with drug-sensitive clones. Color indicates the significance of enrichment. (E) Gene score of T-cell regulatory genes (n = 100) compared between drug-sensitive and drug-resistant clones. ∗P < .05, paired t test. (F) Heat map presenting the changes of gene score for MHC class II genes and their regulators in drug-resistant clones as compared with drug-sensitive clones. ∗P < .05, Wilcoxon rank-sum test. (G) Gene set enrichment analysis of cell cycle signaling in drug-resistant clones as compared with drug-sensitive clones. (H) Enriched motifs in drug-resistant clones compared with drug-sensitive clones. The commonly enriched regulatory factors are highlighted. Color represents enrichment significance, with the top 5 motifs selected for each patient. (I) Interaction network of key regulators in drug-resistant clones. Each node represents a regulator, and edges indicate interaction. The node size corresponds to the frequency of interaction, whereas the line thickness indicates the strength of the interaction. (J) Footprints of resistant clone-specific enriched motifs including SP1, DNMT1, and EGR1. Lines are color-coded for drug-resistant and drug-sensitive clones. (K) Heat map displaying the relative gene score of DNMT1-p15 pathway (top) and EGR1-ID1 pathway (bottom) in drug-resistant clones as compared with drug-sensitive clones. ∗P < .05, Wilcoxon rank-sum test. GTPase, guanosine triphosphate; ncRNA, non-coding RNA; NES, normalized enrichment score.
Figure 5.
Figure 5.
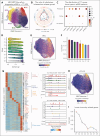
Identification of relapse-fated subpopulation with elevated innate immune signaling. (A) UMAP plot illustrating the clustering of HSC/MPP-like cells (n = 77 945) from all patients with pAML at diagnosis. (B) Radar plot depicting the ratio of relative proportions of HSC/MPP-like subsets (C1 to C8) between relapse and nonrelapse groups across various pAML subtypes. (C) Bubble plot showing the ratio of observed to expected (Ro/e) values of C1 cluster in each clone type among patients with pAML (n = 7). Dot size represents the value of Ro/e, and the dot color represents logarithmic transformed adjusted P values (Benjamini-Hochberg correction). The symbol “/” indicates data not available. (D) EpiTrace age of HSC/MPP-like subsets from C1 to C8. (E) UMAP showing chromatin accessibility for SELL gene in HSC/MPP-like subsets. (F) LSC6 gene score in HSC/MPP-like subsets from C1 to C8. (G) Subset-specific accessible peaks (n = 26 437) from C1 to C8 with representative associated genes displayed (left). Zoom-in genome tracks display the chromatin accessibility of IL18R1 and the Notch signal gene NOTCH2NLA in HSC/MPP-like subsets (right). (H) UMAP showing chromatin accessibility for innate immunity–related gene CCL15 in HSC/MPP-like subsets. (I) Gene score of innate immune gene set (n = 334) within HSC/MPP-like subsets. GPCR, G-protein coupled receptor; LSC6, 6-gene leukemia stem cell signature.

Comment in

References

    1. Wiggers CRM, Baak ML, Sonneveld E, Nieuwenhuis EES, Bartels M, Creyghton MP. AML subtype is a major determinant of the association between prognostic gene expression signatures and their clinical significance. Cell Rep. 2019;28(11):2866–2877.e5. - PubMed
    1. Umeda M, Ma J, Westover T, et al. A new genomic framework to categorize pediatric acute myeloid leukemia. Nat Genet. 2024;56(2):281–293. - PMC - PubMed
    1. Reedijk AMJ, Klein K, Coebergh JWW, et al. Improved survival for children and young adolescents with acute myeloid leukemia: a Dutch study on incidence, survival and mortality. Leukemia. 2019;33(6):1349–1359. - PubMed
    1. Stelmach P, Trumpp A. Leukemic stem cells and therapy resistance in acute myeloid leukemia. Haematologica. 2023;108(2):353–366. - PMC - PubMed
    1. Pollyea DA, Jordan CT. Therapeutic targeting of acute myeloid leukemia stem cells. Blood. 2017;129(12):1627–1635. - PubMed