. 2025 Mar 11;9(5):1024-1039.
doi: 10.1182/bloodadvances.2024013425.

NAD+ metabolism restriction boosts high-dose melphalan efficacy in patients with multiple myeloma

Affiliations

NAD+ metabolism restriction boosts high-dose melphalan efficacy in patients with multiple myeloma

Debora Soncini et al. Blood Adv. .

Abstract

Elevated levels of the NAD+-generating enzyme nicotinamide phosphoribosyltransferase (NAMPT) are a common feature across numerous cancer types. Accordingly, we previously reported pervasive NAD+ dysregulation in multiple myeloma (MM) cells in association with upregulated NAMPT expression. Unfortunately, albeit being effective in preclinical models of cancer, NAMPT inhibition has proven ineffective in clinical trials because of the existence of alternative NAD+ production routes using NAD+ precursors other than nicotinamide. Here, by leveraging mathematical modeling approaches integrated with transcriptome data, we defined the specific NAD+ landscape of MM cells and established that the Preiss-Handler pathway for NAD+ biosynthesis, which uses nicotinic acid as a precursor, supports NAD+ synthesis in MM cells via its key enzyme nicotinate phosphoribosyltransferase (NAPRT). Accordingly, we found that NAPRT confers resistance to NAD+-depleting agents. Transcriptomic, metabolic, and bioenergetic profiling of NAPRT-knockout (KO) MM cells showed these to have weakened endogenous antioxidant defenses, increased propensity to oxidative stress, and enhanced genomic instability. Concomitant NAMPT inhibition further compounded the effects of NAPRT-KO, effectively sensitizing MM cells to the chemotherapeutic drug, melphalan; NAPRT added-back fully rescues these phenotypes. Overall, our results propose comprehensive NAD+ biosynthesis inhibition, through simultaneously targeting NAMPT and NAPRT, as a promising strategy to be tested in randomized clinical trials involving transplant-eligible patients with MM, especially those with more aggressive disease.


Conflict of interest statement

Conflict-of-interest disclosure: The authors declare no competing financial interests.

Figures
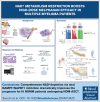
None
Graphical abstract
Figure 1.
Figure 1.
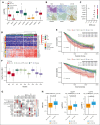
NAD+ biosynthesis of MM cells predominantly relies on PH and salvage pathways, and its dysregulation predicts the clinical outcome. (A) Box plot of expression levels for indicated NAD+ biosynthetic genes in MM samples included in the CoMMpass study. Red, green, and purple bars represent de novo, PH-, and salvage pathway–related genes, respectively. Orange bars represent genes shared by all the NAD+-generating pathways. The abscissa represents the gene name, whereas the ordinate displays its expression as log10 transcripts per million (TPM). (B) Immunohistochemical analysis of a representative BM biopsy collected from patients with NDMM. Hematoxylin and Eosin (H&E), GIEMSA staining, along with CD138, NADSYN, NAPRT, and NAMPT markers are shown (scale bar is 100 μm). (C) Perturbation effects of NAD+-producing enzymes expressed as CERES score across MM cell lines assessed via genomic CRISPR screening as part of the DepMap project. A CERES score of −1 identifies an essential gene. NAMPT and NAPRT have the highest dependency in MM cells. (D) Heat map of 797 patients with MM included in the CoMMpass study ordered in 3 groups by standardizing a NADome signature with a “min-max” method. Genes are categorized as either NAD+ consumers or producers, which are assigned to specific NAD+ biosynthetic pathways as in panel A. (E) Kaplan-Meier curves showing the prognostic impact of NADome signature, in terms of PFS and OS, using the CoMMpass data set. Log-rank test is used to compute the P value. Patients with high, intermediate (Int), and low MM expressing the signature are respectively reported in red, green, and blue. (F) Flux values of indicated NAD+ biosynthetic reactions obtained after integrating the MM-NADnet model with transcriptome data from patients with MM . The x-axis represents reactions, and the y-axis represents log2 flux values (μM/sec). Orange, green, light blue, and purple bars represent de novo– (R6a and R7), de novo–PH shared– (R8, R10 and R11), PH (R9), and salvage pathway–related (R19, R21, and R24) reactions, respectively. (G) Correlogram between gene log2 fold change (FC) values and metabolite log2 FC values. Rows represent metabolites and columns represent genes. The red color corresponds to positive correlation, the blue color corresponds to negative correlation, the area covered in the square corresponds to the absolute value of the correlation, and the black squares correspond to significant correlations (P < .05). (H) Analysis of NADome, NAMPT, and NAPRT expression in the CoMMpass database across patients with MM carrying indicated cytogenetic abnormalities. The expression of the NADome signature was standardized using the min-max method (gene based), and the mean gene set variation analysis (GSVA) score was subsequently calculated. The NAPRT and NAMPT expression data (expressed as log2 [TPM +1]) were obtained by selecting baseline expression data for each patient. Statistical significance between patient groups was calculated using the nonparametric Kolmogorov-Smirnov test; P value is indicated in each insert.
Figure 2.
Figure 2.
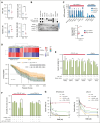
NAPRT targeting makes MM cells more sensitive to NAD+-lowering agents. (A) Quantification of indicated extracellular NAD+ metabolites in BM plasma derived from 15 patients with NDMM and 10 healthy donors, using LC-MS/MS. Data are mean ± standard deviation; ∗P < .04 (Welch test), ∗∗P = .007 (t test). (B) Western blot (WB) showing indicated protein expression across a panel of MM cell lines with different genetic backgrounds (black and white squares refer to presence or absence of indicated abnormalities, respectively). Glyceraldehyde-3-phosphate dehydrogenase (GAPDH) was used as a loading control (bottom blot). One representative experiment is shown. (C) NAPRT, NADSYN, and NAMPT mRNA levels were evaluated in a panel of HMCLs by quantitative reverse transcription polymerase chain reaction (qRT-PCR) using the 2-ΔΔCt method, with normalization to GAPDH. MM cells are divided into low- and high-NAPRT–expressing cells (top); the bottom panel shows the ratio (FC) of FK866 50% inhibitory concentration value for all the tested MM cell lines in the presence vs absence of NA (0.5 μM) supplementation. (D) Heat map showing FK866 activity signature expression in patients with MM derived from the CoMMpass data set grouped by GSVA method as FK866-sensitive patients (a group of patients with gene expression in accordance with FK866 treatment). “Other” includes patients with nonoverlapping profiles (top). Kaplan-Meyer curves of the PFS probability of FK866-sensitive patients, divided into quartiles for their expression of NAPRT. Log-rank test is used to compute the P value (log-rank test). First and fourth quartiles of NAPRT expression are represented in red and blue, respectively (bottom). (E) CD138+ primary cells from patients with MM (3 NDMM and 1 RRMM) and PBMCs from healthy donor (HD; n = 2), were treated with the indicated dose of FK866 in the presence or absence of NA (1 μM) for 96 hours and assessed for cell viability using CTG. (F) MM tumor (CD138+) and normal (PBMCs) cells were treated as in panel E, alone and in combination with the NAPRT inhibitor 2HNA (1 mM), and assessed for cell viability using CTG. (G) RPMI 8226 and MM1S NAPRT–expressing cells were treated with different concentrations of FK866 in the presence or absence of NA (2 μM), 2HNA (1 mM), and their combination for 72 hours. Cell viability was assessed using an MTS-based assay. ∗P ≤ .05; ∗∗P ≤ .01; ∗∗∗P ≤ .001; unpaired t test. CTG, CellTiter-Glo; HMCLs, human myeloma cell lines; MTS, 3-(4,5-dimethylthiazol-2-yl)-5-(3-carboxymethoxyphenyl)-2-(4-sulfophenyl)-2H-tetrazolium assay; ns, not significant; PBMCs, peripheral blood mononuclear cells; RRMM, relapsed refractory MM.
Figure 3.
Figure 3.
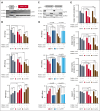
NAPRT silencing reduces intracellular NAD+ content and sensitizes MM cells to NAMPT-i in vitro and in a xenograft mouse model. (A) In RPMI 8226 cells, NAPRT depletion was achieved using 2 different shRNA (sh2 and sh5) specific for NAPRT or scrambled control. NAPRT silencing was validated using qPCR (left panel) and WB (right panel) analyses. (B) Isogenic RPMI 8226 cells as in panel A were treated for 48 hours with FK866 in the presence or absence of NA and their combinations. Then, intracellular NAD+ level was determined by cyclic enzymatic assay, expressed in nmol and normalized for cell mass (mg of total proteins). (C) Cell viability of scramble, shNAPRT 2, and shNAPRT 5 RPMI 8226 cells treated with FK866 in the presence or absence of NA (2 μM), 2-HNA (1 mM), or their combos for 72 hours was measured with MTS assay and presented as a percentage of control (specific control). (D) Schematic representation of the in vivo experiment. (E) Female NOD/SCID J mice (8 weeks of age) were injected subcutaneously in both flanks with MM1S cells transduced with shNAPRT2 or scramble (4.5 × 106 viable cells). After the detection of tumors, mice from both groups were randomized and treated with either vehicle dimethyl sulfoxide (DMSO; scramble, n = 5; shNAPRT 2, n = 6) or FK866 (30 mg/kg; scramble and shNAPRT 2, n = 6) administered intraperitoneally twice a day for 18 days. Tumor volume was evaluated by caliper measurement. A significant delay in tumor growth was observed after treatment in shNAPRT2 cell–xenografted mice compared with scramble (∗∗∗P = .0008). Data represent the mean tumor volume ± standard deviation. (F) Kaplan-Meier survival curve of xenograft mice bearing MM1S scramble and shNAPRT 2 tumors. Mice carrying NAPRT-silenced tumors showed increased survival after FK866 treatment compared with mice bearing control tumors (∗P = .011). n indicates the number of tumors per treatment group. Data were analyzed by 2-tailed Student t test for panels A-B,E or by log-rank Mantel-Cox test for panel F. For panels A-C, data are representative of at least 2 independent experiments. ∗P ≤ .05; ∗∗P < .01; ∗∗∗P ≤ .001; ∗∗∗∗P ≤ .0001; unpaired t test. CTR, control; NOD/SCID, nonobese diabetic severe combined immunodeficiency; ns, not significant; qPCR, quantitative polymerase chain reaction.
Figure 4.
Figure 4.
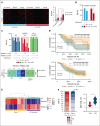
NAPRT deficiency is associated with increased oxidative stress in MM cells. (A) Kaplan-Meier curves showing the prognostic impact of low NAPRT levels in terms of OS, using the CoMMpass data set. Log-rank test is used to compute the P value (log-rank test). First and fourth quartiles of NAPRT expression are represented in red and blue, respectively. (B) PROGENy (pathway responsive genes for activity inference) was used to infer pathway activities from CoMMpass RNA-sequencing data, comparing patients with MM with low NAPRT expression (first quartile, red) with those with high expression (fourth quartile, blue). Normalized enrichment scores (NES) for each pathway were displayed. High NES indicate high enrichment. (C) Oxidative stress-related genes mRNA levels were evaluated by qRT-PCR using the 2-ΔΔCt method, with normalization to GAPDH as a housekeeping gene, in scramble and NAPRT-silenced (sh2) RPMI 8226 cells. (D) Detection of human reactive oxygen species (hROS) in scramble and NAPRT-silenced RPMI 8226 cells using CellROX Deep Red and 2',7'-dichlorofluorescin diacetate (DCFDA; for H2O2 detection) fluorescent probes. (E) Time-dependent detection of indicated hROS productions after FK866 treatment (10 nM) in control and NAPRT-silenced MM cells. Hydrogen peroxide (H2O2) and cytosolic (cO2) were detected by flow cytometry using DCFDA and dihydroethidium fluorescent probes, respectively. (F) Scramble and shNAPRT #2 RPMI 8226 cells were incubated with or without exogenous catalase (CAT; H2O2 scavenger, 1000 U/mL) with or without increasing concentrations of FK866 (3-10 nM). Cell viability was measured after 96 hours of drug exposure and assessed by flow cytometry using annexin V (AV)/propidium iodide (PI) staining. (G-K) Oxidative stress markers malondialdehyde (MDA) (G), activities of antioxidant enzymes (glutathione peroxidase [GPX], glutathione reductase [GR]) (H-I), and GSH:GSSG and NADPH:NADP+ ratios (J-K) were assessed in control and NAPRT-silenced (sh2) RPMI 8226 cells in presence of 1 μM NA, with or without increased concentrations of FK866 (2-3 nM) for 24 hours. Panels C-G represent means (±SD) of duplicate experiments; panels H-L show representative experiments as mean ± SD (n = 6). ∗P ≤ .05, ∗∗P < .01; ∗∗∗P ≤ .001; unpaired t test. ns, not significant.
Figure 5.
Figure 5.
NAPRT activity is crucial for redox homeostasis and oxidative metabolism of MM cells thus influencing the anti-MM activity of NAD+-lowering agents. (A) KMS11 cells expressing inducible Cas9 were used to generate different clones of NAPRT-KO cells. WB analysis of wild type (WT) and indicated 4 different NAPRT-KO clones of KMS11 cells confirmed specific KO. Whole-cell lysates were collected and probed with NAPRT antibody. GAPDH was used as a loading control. (B) Antioxidant enzymes (GR and GPX) activities and MDA levels were assessed in WT and in 2 different KMS11 NAPRT-KO clones in presence of 1 μM NA, with or without increasing concentrations of FK866 (1.5-2.5 nM) for 24 hours. (C) Representative WB images of KO cells (clone#8 and #34) expressing NAPRT addbacks or KO cells. (D) indicated antioxidant enzymes activities and MDA levels were assessed in NAPRT added-back and in KO cells, in presence of 1 μM NA, with or without increasing concentrations of FK866 (1.5-2.5 nM) for 24 hours. (E) Mitochondrial complexes (I, II, III, and IV) activities normalized to specific control (expressed as percentage, %) measured in KMS11 WT and NAPRT-KO cells (clone#8 and clone#34), in the presence of 1 μM NA with or without increasing concentrations of FK866 (1.5-2.5 nM) for 48 hours. Data are presented as mean ± standard deviation (n = 6). (F) Specific viability of KMS11 WT and NAPRT-KO cells (clone#8 and clone#34) in the presence of 1 μM NA, was assessed. Increasing doses of FK866 (0.8-1-1.4 nM) were administered, and after 24 hours, the oxidative phosphorylation (OXPHOS) inhibitor IACS010759 (0.6 μM) was either added for an additional 48 hours. Cell viability was finally measured using an MTS-based assay. In the right panel, synergism of the same experiment was analyzed by Combenefit software, using the Lowe method. A representative experiment of 2 was shown as mean ± standard deviation (n = 3). ∗∗P < .01; ∗∗∗P ≤ .001; ∗∗∗∗P ≤ .0001; unpaired t test. cl., clone.
Figure 5.
Figure 5.
NAPRT activity is crucial for redox homeostasis and oxidative metabolism of MM cells thus influencing the anti-MM activity of NAD+-lowering agents. (A) KMS11 cells expressing inducible Cas9 were used to generate different clones of NAPRT-KO cells. WB analysis of wild type (WT) and indicated 4 different NAPRT-KO clones of KMS11 cells confirmed specific KO. Whole-cell lysates were collected and probed with NAPRT antibody. GAPDH was used as a loading control. (B) Antioxidant enzymes (GR and GPX) activities and MDA levels were assessed in WT and in 2 different KMS11 NAPRT-KO clones in presence of 1 μM NA, with or without increasing concentrations of FK866 (1.5-2.5 nM) for 24 hours. (C) Representative WB images of KO cells (clone#8 and #34) expressing NAPRT addbacks or KO cells. (D) indicated antioxidant enzymes activities and MDA levels were assessed in NAPRT added-back and in KO cells, in presence of 1 μM NA, with or without increasing concentrations of FK866 (1.5-2.5 nM) for 24 hours. (E) Mitochondrial complexes (I, II, III, and IV) activities normalized to specific control (expressed as percentage, %) measured in KMS11 WT and NAPRT-KO cells (clone#8 and clone#34), in the presence of 1 μM NA with or without increasing concentrations of FK866 (1.5-2.5 nM) for 48 hours. Data are presented as mean ± standard deviation (n = 6). (F) Specific viability of KMS11 WT and NAPRT-KO cells (clone#8 and clone#34) in the presence of 1 μM NA, was assessed. Increasing doses of FK866 (0.8-1-1.4 nM) were administered, and after 24 hours, the oxidative phosphorylation (OXPHOS) inhibitor IACS010759 (0.6 μM) was either added for an additional 48 hours. Cell viability was finally measured using an MTS-based assay. In the right panel, synergism of the same experiment was analyzed by Combenefit software, using the Lowe method. A representative experiment of 2 was shown as mean ± standard deviation (n = 3). ∗∗P < .01; ∗∗∗P ≤ .001; ∗∗∗∗P ≤ .0001; unpaired t test. cl., clone.
Figure 6.
Figure 6.
NAD+ starvation enhances the anti-MM activity of genotoxic stress and results in improved HDM-based programs’ efficacy. (A) Foci of DNA damage in KMS11 WT and NAPRT-KO (clone#8) cells were stained by immunofluorescence by γ-H2A.X marker (green) staining, in the presence of NA (1 μM), with or without FK866 (10 nM, 48 hours). Q-nuclear (red) was used as a nuclear reference. On the right of the panel, a graph of the quantification of foci is included. Original magnification 60× is shown and the scale bar is 20 μm. (B) WT and NAPRT-KO clone#8 cells were incubated with melphalan (20 μM). Cell death was measured after 48 hours of drug exposure and assessed by flow cytometry using AV/PI staining. (C) Specific viability of WT, NAPRT-KO, and NAPRT–added-back KO KMS11 cells (clone#8), in the presence of NA (1 μM), was assessed: increasing doses of FK866 (0.8-1-1.4 nM) were administered, and after 24 hours, the alkylating drug melphalan (20 μM) was either added or not for an additional 48 hours. Cell viability was ultimately assessed using the annexin V/PI method. Analysis of drug synergism performed with Combenefit (HSA model) is reported in the panel on the right. (D) Kaplan-Meyer curves of the PFS probability of transplant-eligible patients receiving HDM divided as FK866 sensitive (on the left, n = 126) or not sensitive (on the right, n = 216) in the CoMMpass data set, according to their NAPRT mRNA levels (first and fourth quartiles are represented in red and blue, respectively). Log-rank test is used to compute the P value. (E-F) Heat map showing FK866 activity signature expression in 20 patients with melphalan-exposed NDMM grouped using GSVA method: patients with gene expression in accordance with FK866 treatment are highlighted in red as “FK866 sensitive.” Overall response rate (ORR; includes complete response [CR]; very good partial response [VGPR]; stable disease [SD]; partial response [PR]; and progressive disease [PD]) was measured in profiled patients with MM with a focus on NAPRT expression: patients achieving at least PR after HDM carried overlapping profiling with FK866-sensitive cells with lower NAPRT mRNA levels than others. In panels A-B,D a representative experiment of 2 was shown as mean ± standard deviation (n = 3). Unpaired t test was used for panels A,F (∗P ≤ .05).

References

    1. Langseth ØO, Myklebust T, Johannesen TB, Hjertner Ø, Waage A. Incidence and survival of multiple myeloma: a population-based study of 10 524 patients diagnosed 1982-2017. Br J Haematol. 2020;191(3):418–425. - PubMed
    1. Palumbo A, Anderson K. Multiple myeloma. N Engl J Med. 2011;364(11):1046–1060. - PubMed
    1. Kumar SK, Rajkumar V, Kyle RA, et al. Multiple myeloma. Nat Rev Dis Primers. 2017;3(1) - PubMed
    1. van de Donk NWCJ, Pawlyn C, Yong KL. Multiple myeloma. Lancet. 2021;397(10272):410–427. - PubMed
    1. van de Donk NWCJ, Zweegman S. T-cell-engaging bispecific antibodies in cancer. Lancet. 2023;402(10396):142–158. - PubMed

MeSH terms