. 2025 Mar;639(8056):1093-1101.
doi: 10.1038/s41586-024-08493-8. Epub 2024 Dec 11.

Structure and mechanism of the Zorya anti-phage defence system

Affiliations

Structure and mechanism of the Zorya anti-phage defence system

Haidai Hu et al. Nature. 2025 Mar.

Abstract

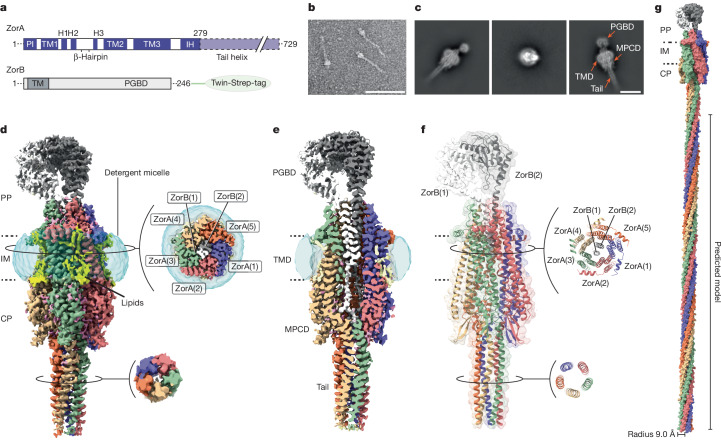
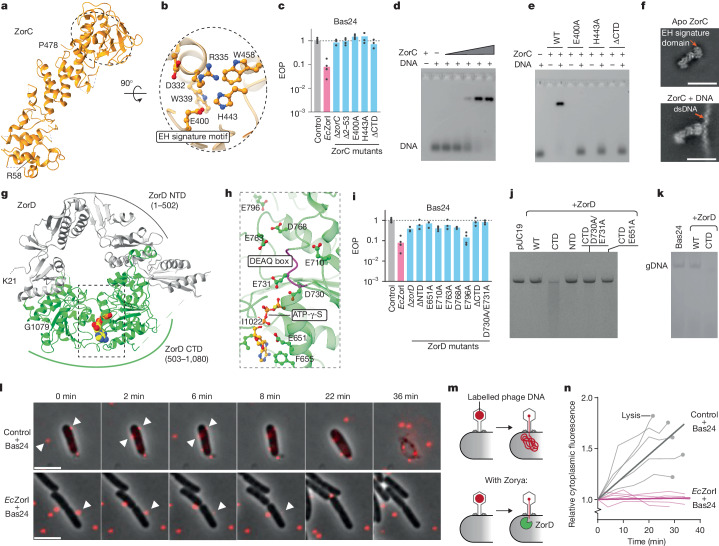
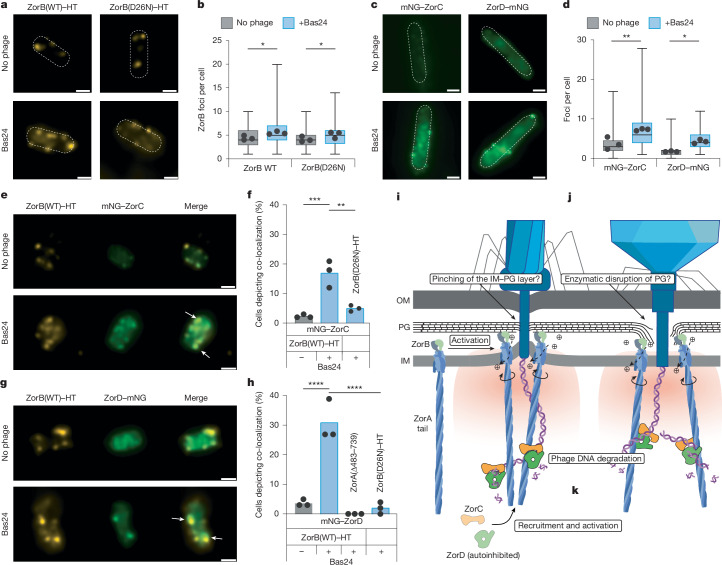
Zorya is a recently identified and widely distributed bacterial immune system that protects bacteria from viral (phage) infections. Three Zorya subtypes have been identified, each containing predicted membrane-embedded ZorA-ZorB (ZorAB) complexes paired with soluble subunits that differ among Zorya subtypes, notably ZorC and ZorD in type I Zorya systems1,2. Here we investigate the molecular basis of Zorya defence using cryo-electron microscopy, mutagenesis, fluorescence microscopy, proteomics and functional studies. We present cryo-electron microscopy structures of ZorAB and show that it shares stoichiometry and features of other 5:2 inner membrane ion-driven rotary motors. The ZorA5B2 complex contains a dimeric ZorB peptidoglycan-binding domain and a pentameric α-helical coiled-coil tail made of ZorA that projects approximately 70 nm into the cytoplasm. We also characterize the structure and function of the soluble Zorya components ZorC and ZorD, finding that they have DNA-binding and nuclease activity, respectively. Comprehensive functional and mutational analyses demonstrate that all Zorya components work in concert to protect bacterial cells against invading phages. We provide evidence that ZorAB operates as a proton-driven motor that becomes activated after sensing of phage invasion. Subsequently, ZorAB transfers the phage invasion signal through the ZorA cytoplasmic tail to recruit and activate the soluble ZorC and ZorD effectors, which facilitate the degradation of the phage DNA. In summary, our study elucidates the foundational mechanisms of Zorya function as an anti-phage defence system.


Conflict of interest statement

Competing interests: The authors declare no competing interests.

Figures

Fig. 1
Fig. 1. Zorya has broad activity against phages through a direct immunity mechanism.
a, Schematic of the EcZorI operon. b, EcZorI defence against diverse E. coli phages, determined using efficiency of plaquing (EOP) assays. AAI, the average amino acid identity between proteins encoded by each phage (providing an estimate of the relatedness between phages). c, Adsorption of phage Bas24 onto E. coli cells possessing or lacking EcZorI. d, One-step phage growth curve for phage Bas24 infection of E. coli, with or without EcZorI, normalized to the plaque-forming units (PFU) per ml at the initial timepoint. e, Infection time courses for liquid cultures of E. coli, with and without EcZorI, infected at different MOIs of phage Bas24. ϕ, phage. f, Phage titres at the end timepoint for each sample from the infection time courses in e, measured as PFU per ml on indicator lawns of E. coli either without (control) or with EcZorI. The limit of detection (LOD) is shown by dotted lines. g, The survival of E. coli cells, lacking or possessing EcZorI, that were infected at an MOI of 5 with Bas24. h, Time-lapse, phase-contrast microscopy of E. coli cells with and without EcZorI infected with Bas24 at an MOI of 5. i, Quantification of the time-lapse microscopy in h, displaying the measured cell area relative to the initial timepoint. For bg, data are the mean of at least three biological replicates (datapoints indicate replicates) and error bars (c and d) or shaded regions (e) represent the standard s.e.m. For i, data are mean ± s.d., derived from independent biological triplicates. Source Data
Fig. 2
Fig. 2. Cryo-EM analysis of EcZorAB and its architecture.
a, Schematic of EcZorA and EcZorB. b, Negative-stain EM image of purified EcZorAB particles. Scale bar, 1,000 Å. c, Representative high-resolution two-dimensional classes of EcZorAB images from cryo-EM. Domain architectures of the EcZorAB complex are shown. Scale bar, 100 Å. d, Cryo-EM map of EcZorAB. Five ZorA subunits (purple, salmon, light green, tan and coral) surround two ZorB subunits (white and dark grey) viewed from the plane of the membrane. Membrane-bound lipids are shown in yellow. The detergent micelle is shown as a translucent surface representation in cyan. The dashed lines show inner membrane boundaries. Two cross-section views of the EcZorAB TMD and tail are shown. e, Cross-section view of the EM density map from the plane of the membrane. f, Ribbon model representation of EcZorAB, with two cross-section views of the model shown. g, Composite model of the EcZorAB whole complex, represented as a surface model. The radius of the ZorA tail is indicated. CP, cytoplasm; H, helix; IM, inner membrane; PP, periplasm. Images in b are representative of at least three replicates.
Fig. 3
Fig. 3. ZorAB is a PG-binding, proton-driven motor.
a, EcZorAB viewed from the plane of the membrane, with ZorB shown as ribbons (black and white) and ZorA shown as a translucent surface. The distance between the inner membrane and PG layer in E. coli is approximately 90 Å (ref. ). The cysteine residues from the two disulfide bridges in the ZorB PGBD are indicated and shown as spheres. The Asp26 residues from both ZorB TM helices are indicated and shown. b, Top view of the ZorB PGBD. c, Cross-section view of the ZorAB TMD, showing ZorB Asp26 and the surrounding residues. d, Magnified view of the interactions between ZorB and ZorA at the domain assembly interface in the periplasmic space. e, The Ca2+-binding site. EM densities are only overlapped on Ca2+ ion, and the two water molecules. f, Magnified view of the interactions between the ZorB N terminus and the ZorA tail. g, Ion-translocation pathway (semitransparent surface representation in light blue) in ZorAB. Residues along the ion-permeation pathway and from the ion-selectivity filter are shown. Each asterisk indicates residues or structural elements from the neighbouring ZorA subunit. h, The effects of ZorA and ZorB mutations on EcZorI-mediated anti-phage defence against Bas24, as measured using EOP assays. Data are the mean of at least three replicates (datapoints indicate replicates) and are normalized to the control samples lacking EcZorI. ZorB(46–52>GGGSGGS), replacement of ZorB residues 46–52 with a GGGSGGS linker. Data for additional phages are provided in Extended Data Fig. 6a. i, Time-lapse phase-contrast microscopy analysis of E. coli cells expressing empty vector control or EcZorI with or without exposed to Bas24 at an MOI of 5 in the presence or absence of 30 µM CCCP. j, Quantification of the time-lapse microscopy images in i, displaying the measured cell area relative to the initial timepoint images. For j, data are mean ± s.d., derived from independent biological triplicates.
Fig. 4
Fig. 4. Structural and functional characterization of ZorC and ZorD.
a, Ribbon model representation of ZorC. Residues from Arg58 to Pro478 were modelled based on EM density. b, Details of the ZorC EH signature motif. c, The effects of ZorC mutations on EcZorI-mediated anti-phage defence, as measured using EOP assays. d, In vitro interaction of EcZorC with 200 nM dsDNA (18 bp, 50% GC content, 5′ FAM-labelled dsDNA; the sequence is shown in Extended Data Fig. 7h), ZorC concentrations were as follows for lanes 1, 3, 4, 5, 6 and 7, respectively: 2,500, 100, 250, 500, 1,000 and 2,500 nM. e, The effects of ZorC mutations on dsDNA-binding activity. All reactions were made to a final concentration of 100 nM of dsDNA and 2,000 nM of protein. f, Representatives of high-resolution two-dimensional classes of apo EcZorC and EcZorC–dsDNA complex images from cryo-EM. Scale bars, 100 Å. g, Ribbon model representation of EcZorD in a complex with ATP-γ-S, with the bound ATP-γ-S shown as a sphere representation. h, Details of ATP-γ-S-binding sites. The backbone of the DEAQ box motif (ZorD residues 730–733) is coloured in magenta. Conserved negatively charged residues surrounding the DEAQ box motif are shown. i, The effects of ZorD mutations on EcZorI-mediated anti-phage defence, as measured using EOP assays. ΔNTD represents ZorD(Δ1–502) and ΔCTD represents ZorD(Δ503–1080). For c and i, data are the mean of at least three replicates (datapoints indicate replicates) and are normalized to the control samples lacking EcZorI. Data for additional phages are provided in Extended Data Fig. 6a. j, ZorD CTD degrades linear plasmid DNA. k, ZorD CTD degrades phage Bas24 genomic DNA (gDNA). Data for additional phages are provided in Extended Data Fig. 8e. l, Time-lapse montage of SYTOX-Orange-labelled Bas24 infections. The arrows indicate phage particles that appear to adsorb and inject their DNA. Scale bars, 4 µm. m, Schematic of the apparent transfer of labelled phage DNA from the capsid to inside the cell. n, Quantification of intracellular fluorescence levels over time in individual E. coli cells, comparing the infection dynamics in Zorya-deficient cells and EcZorI-expressing cells (data from l, plus four additional replicates). The dotted points indicate cell lysis of E. coli cells lacking EcZorI. The bold lines represent the mean estimated from a linear regression analysis. Images in d, e, j and k are representatives of at least three replicates. CTD, C-terminal domain; NTD, N-terminal domain; WT, wild type. Source Data
Fig. 5
Fig. 5. Subcellular distributions and co-localization of Zorya components with a proposed model.
a, Exemplary denoised TIRF images of the subcellular distributions of WT ZorB and ZorB(D26N) fused to HT with or without Bas24. Scale bars, 1 µm. b, Comparison of the detected maxima of the ZorAB complex foci between the untreated or Bas24-exposed (MOI, 5; 30 min) conditions. n > 250 cells, 3 replicates. P = 0.022 (WT) and P = 0.027 (D26N). c, Exemplary denoised TIRF images of the subcellular distributions of mNG-tagged ZorC and ZorD, with or without Bas24; mNG was fused to either the ZorC N terminus (mNG–ZorC) or ZorD C terminus (ZorD–mNG). Scale bars, 1 µm. d, Comparison of the detected maxima of the ZorC and ZorD foci between the untreated and Bas24-exposed (MOI 5, 30 min) conditions. n > 250 cells. P = 0.004 and P = 0.04. e, Exemplary denoised TIRF images of co-localization of mNG–ZorC with ZorB(WT)–HT with or without Bas24. Scale bars, 1 µm. The white arrows highlight co-localization. f, Co-localization analysis of ZorB(WT)–HT or ZorB(D26N)–HT with ZorC–mNG with or without Bas24 (MOI, 5; 30 min). P = 0.0002 (left), P = 0.0042 (right). g, Exemplary denoised TIRF images of co-localization of ZorD–mNG with ZorB–HT, with or without Bas24. Scale bars, 1 µm. h, Co-localization analysis of ZorB(WT)–HT or mutants (ZorB(D26N)–HT and ZorA(∆483–739) (tail-tip deletion)) with ZorD–mNG, with or without Bas24 (MOI, 5; 30 min). ****P < 0.0001. ik, The proposed Zorya defence model. OM, outer membrane. i, Inactive ZorAB diffuses laterally within the inner membrane. j, Inactive ZorAB detects cell envelope perturbation during phage infection and ZorB PGBDs anchor to PG. Ion translocation through ZorAB triggers ZorA and its tail to rotate around ZorB. k, The ZorAB motor signal is transferred through the ZorA tail, which recruits and/or activates ZorC and ZorD. ZorC and ZorD bind to and degrade phage DNA, preventing phage replication. Datapoints represent the mean focus counts for each of three replicates and the shaded bars represent the mean between replicates. For b and d, data are mean values, with the whiskers representing the minimum to maximum values. Statistical analysis was performed using unpaired t-tests (b,d,f) or two-way ANOVA (h). ZorB(WT)–HT and ZorB(D26N)–HT expression data are provided in Extended Data Fig. 6e. Source Data
Extended Data Fig. 1
Extended Data Fig. 1. E. coli Zorya type I protects against phage invasion but not bacterial conjugation or plasmid transformation.
a, Zorya system gene arrangements for each Zorya type (I–III), with typical gene annotations shown. b, Phylogeny of the ZorA motor sequence (excluding the ZorA tail) rooted with the E. coli MotA (EcMotA) sequence. c, Taxonomic analyses of Zorya hosts, using the GTDB phyla-level taxa. Each phylum was assigned as either possessing a single membrane cell envelope (Monoderm) or double membrane envelope (Diderm). In some cases, there are both monoderm and diderm species within phyla, which are labelled as ‘Both’. The number of genomes analysed for each phyla (n genomes) is based on the genomes present in the GTDB v214.1 and RefSeq v209. d, The impact of EcZorI on the uptake of plasmid DNA via conjugation from an E. coli donor strain, measured as the transconjugant frequency (number of transconjugants/total recipients). Four plasmids with different origins of replication (OriV) were tested (ColE1, RSF1010, pBBR1 and RK2), at the indicated donor to recipient cell ratios (D:R) for the matings. Data represent the mean of three replicates. e, The impact of EcZorI on the uptake of plasmid DNA via transformation. Chemically competent E. coli without (control; empty vector) or with EcZorI were transformed with plasmids possessing either ColE1 or pBBR1 origins of replication. Data represent the mean of three replicates, with each replicate being a different batch of competent cells. f, Infection time courses for liquid cultures of E. coli, with and without EcZorI, infected at different multiplicities of infection (MOI) of phage Bas24 (early timepoints for MOI 1 and 10, from Fig. 1e). g, Infection time courses for liquid cultures of E. coli, with and without EcZorI, infected at different multiplicities of infection (MOI) of phage Bas02 and Bas08. h, Phage titres at the end timepoint for each sample from the infection time courses (g), measured as EOP on indicator lawns of E. coli either without (control) or with EcZorI. LOD: Limit of detection. Data in f-h represent the means of 3 replicates and the shaded regions represent the SEM.
Extended Data Fig. 2
Extended Data Fig. 2. Cryo-EM dataset processing results and resolution of EcZorAB.
a, A representative SDS gel of the purified EcZorAB complex. b, An EM image of the EcZorAB sample under cryogenic condition. c, Cryo-EM density map of EcZorAB coloured by local resolution (in Å) estimated in cryoSPARC. d, Gold standard (0.143) Fourier Shell Correlation (GSFSC) curves of refined EcZorAB complex. e, Cryo-EM map of EcZorAB. f, Representative model segment of ZorA fit into EM density, focusing on TM1 of one of the ZorA subunits. g, Volcano plot analysis, visualizing ratio and significance of change between all proteins quantified by mass spectrometry in E. coli total lysates either transformed with pEcZorI plasmids or not (Supplementary Table 1). Significance was tested via two-tailed two-sample Student’s t-testing with permutation-based FDR control, ensuring a corrected p-value of <0.01. n = 4 technical replicates derived from n = 3 culture replicates. h, Absolute copy number analysis of Zorya proteins expressed in E. coli. Determined via comparison of molecular weight-adjusted label-free quantified protein abundance values from this study, to known copy numbers reported by Schmidt et al. and establishing a “proteomic ruler” for conversion of measured abundance values to approximate copy numbers (Supplementary Table 1). n = 4 technical replicates derived from n = 3 culture replicates. i, Soft mask used for local refinement of the ZorB PGBDs. j, Local refinement map of the ZorB PGBDs (made with the soft mask shown in i), coloured by local resolution. k, A representative of a model segment of the ZorB PGBDs fitted into of the local refinement EM density map shown in j, focusing on the PGBD dimerized interface. l, Fit of lipids found in the TMD of ZorA in the EcZorAB cryo-EM map. Images in a and b are representatives of at least 3 replicates.
Extended Data Fig. 3
Extended Data Fig. 3. EcZorA tail secondary structural prediction and a complete composite model of EcZorAB complex.
a, Amino acids and secondary structural predictions (Psipred) of the EcZorA. The peptides found by mass spectrometry that covered ZorA protein are indicated as green lines above the amino acids. b, Top hits from an HHpred sequence homology search of the ZorA tail are shown. c, A composite model of EcZorAB with the ZorA tail folding into a pentameric super coiled-coil, with the helical pitch of the tail α-helix shown. d, Hydrophobicity of the tail tube exterior surface calculated by ChimeraX. e, Hydrophobicity and polarity of the tail tube interior surface calculated by MOLEonline.
Extended Data Fig. 4
Extended Data Fig. 4. Structure of EcZorAB and its function as a peptidoglycan binding rotary motor.
a, Cartoon representation of the EcZorAB complex in an inactive state, with the ZorB dimer interfaced highlighted. b, Topology diagrams of ZorB PGBDs and isolated crystal structures of the flagellar stator unit MotB and PomB PGBDs, indicating a conserved folding architecture. c, The two disulfide bonds identified from ZorB PGBDs, with the EM map overlapped. d, Structural comparison of PGBD of EcZorB with that of ProE that in complex with PG fragment, with the zoom in view highlighting the conserved residues from EcZorB that are likely involved in PG binding. e, Structural comparison of EcZorB PGBD and AlphaFold3 predicted EcMotB PGBD, highlighting EcZorB PGBD is fused without a linker to the ZorB TM. f, In vitro pull-down assay of isolated EcZorAB complex with purified E. coli PG. g, In vitro pull-down assay of isolated EcZorAB complex and EcZorAB complex with mutations in the ZorB PGBD (ZorABY151A/N152A/L155A/R159A) with purified E. coli PG. h, In vitro pull-down assay of isolated ZorB PGBD, mutant ZorB PGBD (ZorBY151A/N152A/L155A/R159A PGBD), MotB PGBD (positive control) and ZorE (negative control) with purified E. coli PG. i, Cross-section view of the EcZorAB TMD, showing the surrounding residues of the two Asp26 from ZorB. j, Cartoon representation of the cryo-EM structure of the proton-driven flagellar stator unit MotAB from Campylobacter jejuni (CjMotAB) in its inactive state, with the MotB plug motif highlighted. k, Cross-section view of the CjMotAB TMD, showing the surrounding residues of the two Asp22 from MotB. l, Cartoon representation of the cryo-EM structure of the sodium-driven flagellar stator unit PomAB from Vibrio alginolyticus (VaPomAB) in its inactive state. m, Cross-section view of VaPomAB TMD, showing the surrounding residues of the two Asp24 from PomB. The absence of the strictly conserved threonine residue on ZorA TM3 (k) required for sodium ion binding, indicates that EcZorAB is a proton-driven stator unit. n, A representative of an SDS gel of the purified EcZorAB ‘linker mutant’ complex (with ZorB residues 46–52 replaced by a GGGSGGS linker). o, A representative cryo-EM image of EcZorAB ‘linker mutant’ sample. p, Representative 2D classes of the EcZorAB ‘linker mutant’ in comparison with that of the EcZorAB wild type, highlighting the flexibility of the ZorB PGBDs in the mutant. q, A representative negative stain EM image of EcZorAB ‘PG-binding mutant’ sample. r, Low pass filter of the cryo-EM density map of the EcZorAB linker mutant after non-uniform refinement. s, Transmembrane helix density of the EcZorAB ‘linker mutant’ and that in the wild type EcZorAB. Images in f, g, h, n, o, q are representatives of at least 3 replicates with similar results.
Extended Data Fig. 5
Extended Data Fig. 5. EcZorAB Ca2+ binding site and tail influence ZorAB motor assembly and function.
a, ZorA tail truncations indicated in the composite model of EcZorAB complex. b, Cartoon representation of the EcZorAB ZorA single subunit. c, Interaction between the beginning of the ZorA tail and the β-hairpin motif. d, Extra density found inside the tail from cryo-EM map, which was modeled as a palmitic acid molecule, with the amino acids involved in the interactions indicated. e, Structural comparison of the ZorA wild type (cyan) and ZorA Ca2+ binding site mutation (ZorAE86A/E89A, grey), the arrows highlight the changes from wild type to the mutant. f, Predicted ZorA lipid binding sites using PeSTo. g, An EM image of the EcZorAL250G/L254G/L258G/L261GZorB mutant under cryogenic condition and representative 2D classes. h, An EM image of the EcZorAL250N/L254N/L258N/L261NZorB mutant under cryogenic condition and representative 2D classes. i, An EM image of the ZorA∆223–729ZorB mutant under cryogenic condition and representative 2D classes. j, Negative staining images of the EcZorAB wild type, ZorA tail middle deletion (ZorA∆359–592), ZorA tail tip deletion (ZorA∆435–729). k, The tail lengths of the EcZorAB wild type, ZorA tail middle deletion (ZorA∆359–592), ZorA tail tip deletion (ZorA∆359–592) as measured in (g). Data represent the mean of at least eight measurements (data points indicate measurements), and error bars represent the standard error of the mean (SEM). l-n, Cryo-EM maps and resolutions of ZorA mutants with gold standard (0.143) Fourier Shell Correlation (GSFSC) curves. Source Data
Extended Data Fig. 6
Extended Data Fig. 6. The effects of EcZorya mutations on EcZorI-mediated anti-phage defence and long ZorA tails are conserved amongst Zorya system types in diverse species.
a, Effects of ZorA, ZorB, ZorC and ZorD mutations on EcZorI-mediated anti-phage defence, as measured using EOP assays with phages Bas02, Bas19 and Bas25. Data represent the mean of at least 3 replicates (data points indicate replicates) and are normalized to the control samples lacking EcZorI. b, The ZorA tail lengths found in different Zorya system types. Motor and tail lengths were determined by inspecting the predicted structures of several representative ZorA sequences, then inferring these lengths for the rest of the ZorA sequences through sequence alignment (methods). The reduce sequencing bias, unique Zorya systems encoded in RefSeq (v209) bacteria and archaea genomes were selected based on their distinct genomic context (methods). c, Time-lapse, phase contrast microscopy of E. coli cells expressing empty vector control, EcZorI wt, EcZorI ZorBD26N and EcZorI ZorA483–729 exposed to Bas24 at an MOI of 5. d, Quantitation of the time-lapse microscopy in (c), displaying the measured cell area relative to the first timepoint of the time-lapse. Data represent the means of three biological replicates and the shaded region indicate standard deviation. e, Quantitative Western blot of selected EcZorI-HaloTag translational fusions. Top: total protein stain of whole cell lysate. Bottom: Anti-HaloTag (mouse, Promega) Western blot against ZorB-HaloTag protein fusions. Mean ± standard deviation from four biological replicates. Source Data
Extended Data Fig. 7
Extended Data Fig. 7. Structural and functional investigation of EcZorC and in vivo DNA degradation.
a, SDS gel of purified ZorC wild type, ZorCE400A, ZorCH443A, ZorC∆CTD (deletion residues 487–560). Gel is representative of at least 3 replicates. b, Unsharpened Cryo-EM map of EcZorC. c, Local refinement of the EcZorC core domain with a soft mask, with the local resolution (in Å) estimated in cryoSPARC. d, Gold standard (0.143) Fourier Shell Correlation (GSFSC) curves of the local refined of the EcZorC core domain. e, Representative of a model and segments of the ZorC fitted into EM density map. The right panel is the final model of EcZorC built from a cryo-EM map. f, AlphaFold3-predicted ZorC model. g, Electrostatic distribution of EcZorC calculated from AlphaFold3-predicted model. h, In vitro interaction of EcZorC with 55 bp dsDNA (36.36% GC), 18 bp dsDNA (50.00% GC), 18 bp dsDNA (22.22% GC), 18 bp dsDNA (72.22% GC). Image is representative of at least 3 replicates. DNA sequences are shown below. i, AlphaFold3-predicted model of ZorC in complex with 18 bp dsDNA. The colour code (per-atom confidence estimate on a 0–100 scale) in f and i are same. j, Representative time-lapse images of E. coli cells expressing ParB-mSc in the presence or absence of EcZorI, exposed to Bas54-parS phage. In EcZorI-null cells, ParB foci are observed prior to cell lysis, whereas EcZorI-expressing cells lack ParB focus formation and survive phage infection. Scale bar is set to 2 µm.
Extended Data Fig. 8
Extended Data Fig. 8. EcZorD is autoinhibited nuclease.
a, Representative of the SDS gel of the purified ZorD wild type, ZorDCTD (residues 503–1080), ZorDNTD (residues 1–502), ZorDCTDD730A/E731A and ZorDCTDE651A. Gel is representative of at least 3 replicates. b, Cryo-EM map of the EcZorD apo form. c, Cryo-EM map and structure of EcZorD in complex with ATP-γ-S. A zoomed-in view of the ATP-γ-S binding site is depicted, with the cryo-EM map overlayed on the ATP-γ-S molecule. d, Structural comparison of the EcZorD apo from (grey) and EcZorD in complex with ATP-γ-S (light purple); the arrows highlight the changes from apo form to the ligand-bound form. e, ZorDCTD degrades phage Bas08 and Bas58 genomic DNA (gDNA). Gel is representative of 3 replicates. f, EcZorD WT and its isolated C-terminal domain nuclease activity in the absence and presence of EcZorC. g, EcZorC dsDNA binding activity in the absence and presence of EcZorD. h, AlphaFold3 predicted model of EcZorD in complex with 18 bp dsDNA and ATP, showing an alternative, open conformation of ZorD. i, ZorD-DNA interaction in the AlphaFold3 predicted model; key residues are highlighted. j, Structural superimposition of the cryo-EM structure of EcZorD with the AlphaFold3 predicted EcZorD in complex with dsDNA model. The arrow indicates the possible conformational transition of the EcZorD NTD. k, Zoom in from j highlighting that the NTD of EcZorD in the DNA free state clashes with DNA in the ZorD–DNA complex model. l, Superimposition of the AlphaFold3 predicted model ZorD–DNA complex with the top hit (PDB 7X3T) from Dali (Z-score = 26.6). m, AlphaFold3 predicted ZorD–ZorC–dsDNA-ATP-Mg2+ complex, with a confidence-coloured (per-atom confidence estimate on a 0–100 scale) model shown in the right panel.
Extended Data Fig. 9
Extended Data Fig. 9. ZorAB recruit ZorC and ZorD during phage invasion.
a, Complementation experiment between E. coli and P. aeruginosa (Pa) Zorya I. Schematic representation of EcZorI, PaZorI and the constructs for PaZorCD or PaZorD complementation of EcZorI gene deletions. b, Anti-phage defence provided by the constructs in (a), as measured using EOP assays for phages Bas49, Bas52 and Bas57. Data represent the mean of at least 3 replicates (data points indicate replicates) and are normalized to the control samples lacking Zorya. c, Strategy of fusing mNeonGreen (mNG) or HaloTag (HT) or both into EcZorI operon. d, The effects of the mNeongreen (mNG) fusions to EcZorI components on anti-phage defence, as measured using EOP assays for phage Bas24. Data represent the mean of at least 3 replicates (data points indicate replicates) and are normalized to the control samples lacking EcZorI. The boxed constructs (ZorB C-terminal mNG fusion: ZorB-mNG; ZorB C-terminal HT fusion: ZorB-HT; ZorC N-terminal mNG fusion: mNG-ZorC; ZorD C-terminal mNG fusion: ZorD-mNG; Dual-tagged constructs, ZorB C-terminal HT fusion and ZorC N-terminal mNG fusion: ZorB-HT + mNG-ZorC; ZorB C-terminal HT fusion and ZorD C-terminal mNG fusion: ZorB-HT + ZorD- mNG) were used for subsequent microscopy experiments. e, Exemplary denoised TIRF and brightfield microscopy pictures of mNG expression driven by the EcZorI native promoter (p-mNG) either untreated or exposed to Bas24 at an MOI of 5 for 30 min. Scale bar 2 µm. f, Exemplary denoised TIRF microscopy pictures of ZorB C-terminal mNG fusion either untreated or exposed to Bas24 at an MOI of 5 for 30 min. Scale bar 2 µm. g, Comparison of detected maxima of the ZorAB complex foci between untreated or exposed to Bas24 at an MOI of 5 for 30 min (n cells > 250 from n = 3 replicates), p-value: 0.030. Means are derived from three independent biological replicates. h, Exemplary denoised TIRF microscopy pictures of ZorD-mNG either untreated or exposed to increasing Bas24 at MOIs of 1, 5, or 50 for 30 min. i, Statistical comparison of ZorD-mNG maxima between untreated and conditions stated in h, p-values: 0.9978., 0.0009, 0.0258 and <0.0001. Means and exemplarily images in e and h derive from at least three independent biological replicates. For g and i data are presented as mean values and Tukey whiskers. Scale bar 2 µm. Source Data

References

    1. Doron, S. et al. Systematic discovery of antiphage defense systems in the microbial pangenome. Science359, eaar4120 (2018). - PMC - PubMed
    1. Payne, L. J. et al. Identification and classification of antiviral defence systems in bacteria and archaea with PADLOC reveals new system types. Nucleic Acids Res.49, 10868–10878 (2021). - PMC - PubMed
    1. Smith, W. P. J., Wucher, B. R., Nadell, C. D. & Foster, K. R. Bacterial defences: mechanisms, evolution and antimicrobial resistance. Nat. Rev. Microbiol.21, 519–534 (2023). - PubMed
    1. Bernheim, A. & Sorek, R. The pan-immune system of bacteria: antiviral defence as a community resource. Nat. Rev. Microbiol.18, 113–119 (2020). - PubMed
    1. Hampton, H. G., Watson, B. N. J. & Fineran, P. C. The arms race between bacteria and their phage foes. Nature577, 327–336 (2020). - PubMed

MeSH terms

LinkOut - more resources