. 2024 Dec 11;8(3):e202403122.
doi: 10.26508/lsa.202403122. Print 2025 Mar.

Novel determinants of NOTCH1 trafficking and signaling in breast epithelial cells

Affiliations

Novel determinants of NOTCH1 trafficking and signaling in breast epithelial cells

Francis M Kobia et al. Life Sci Alliance. .

Abstract

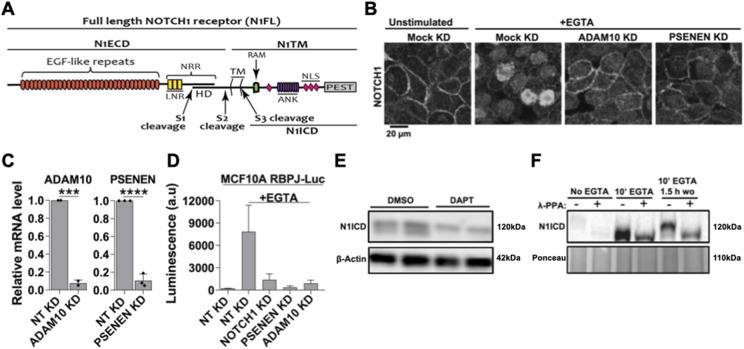
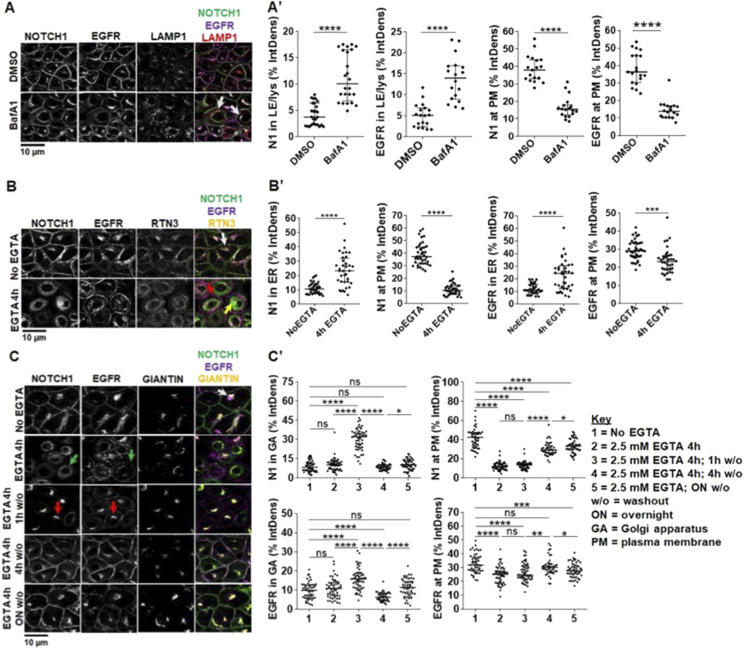
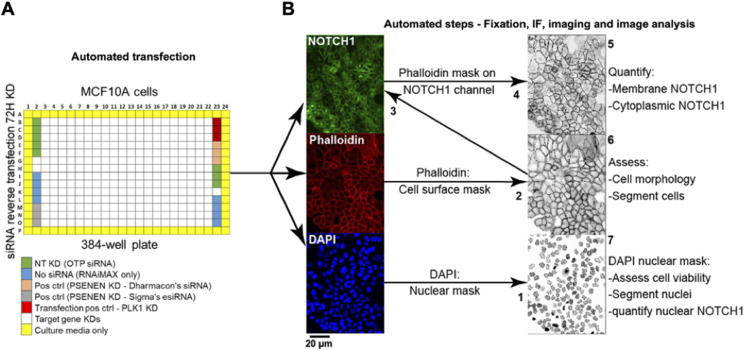
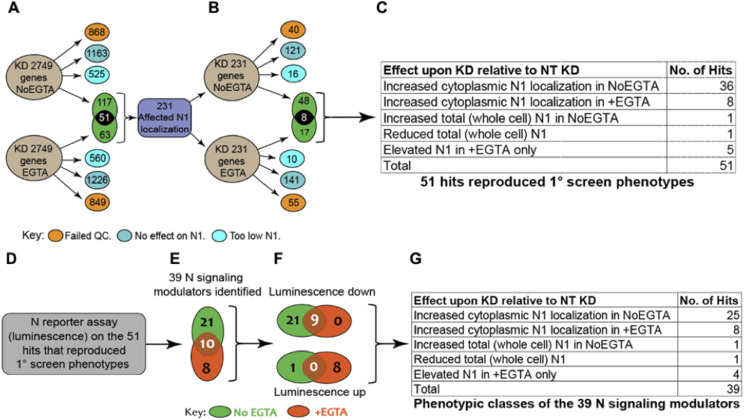
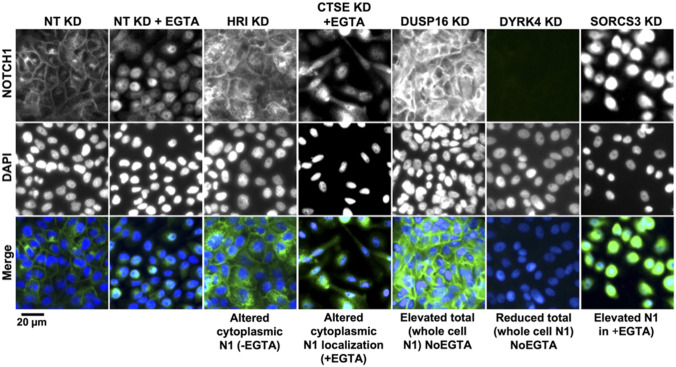
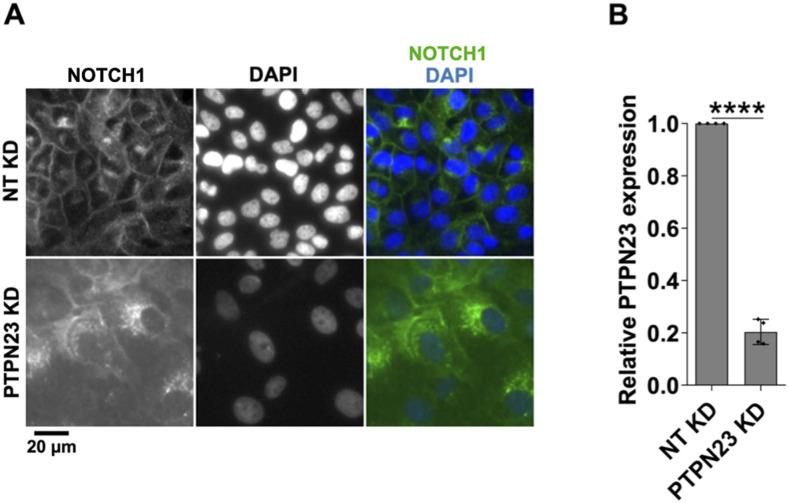
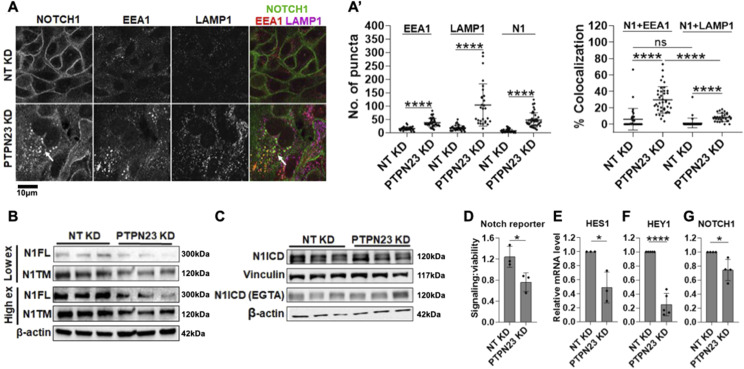
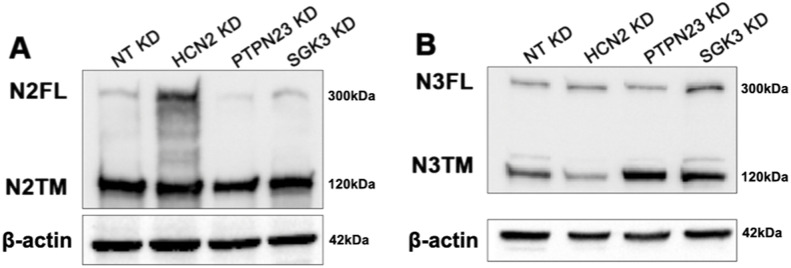
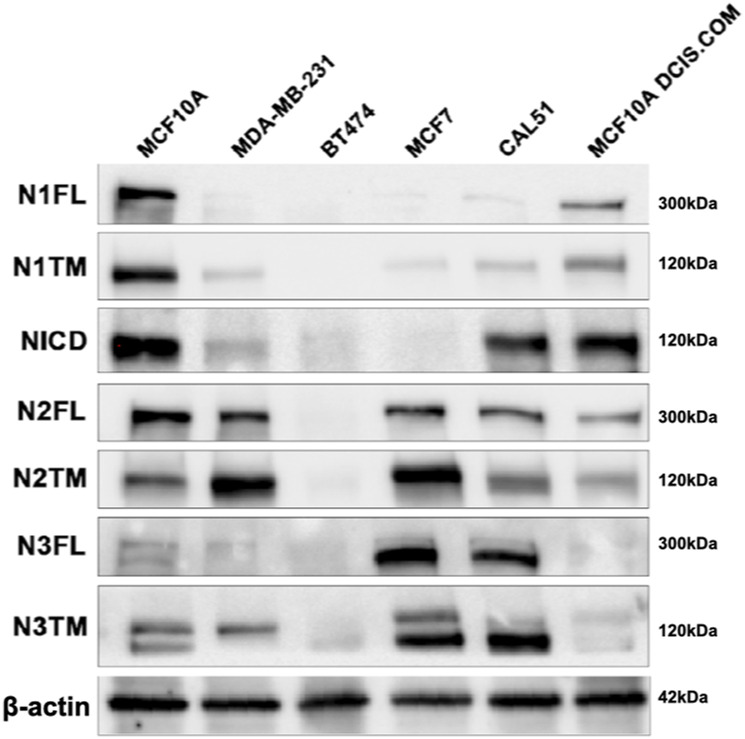
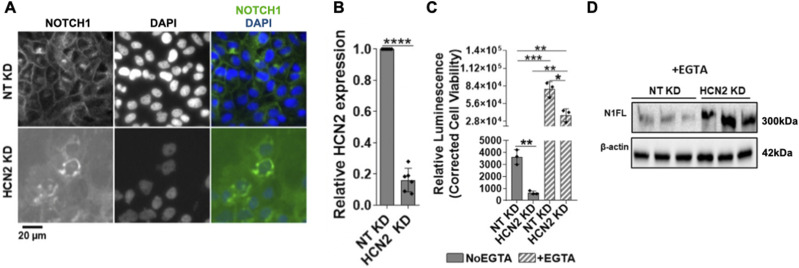
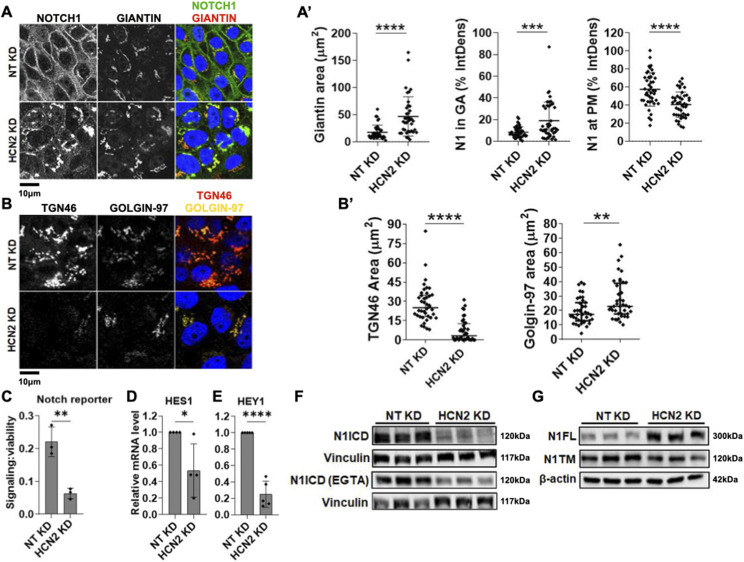
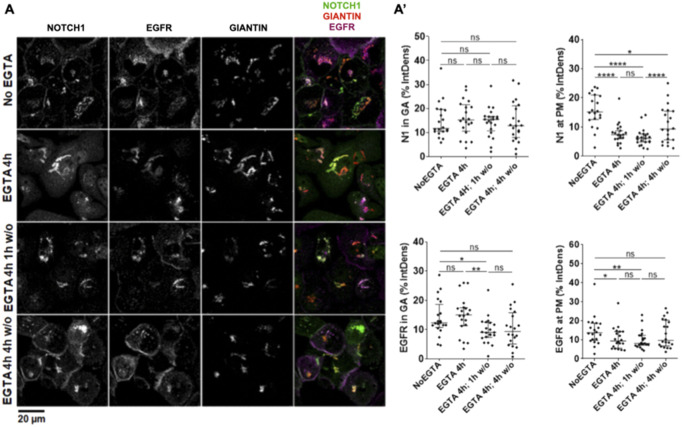
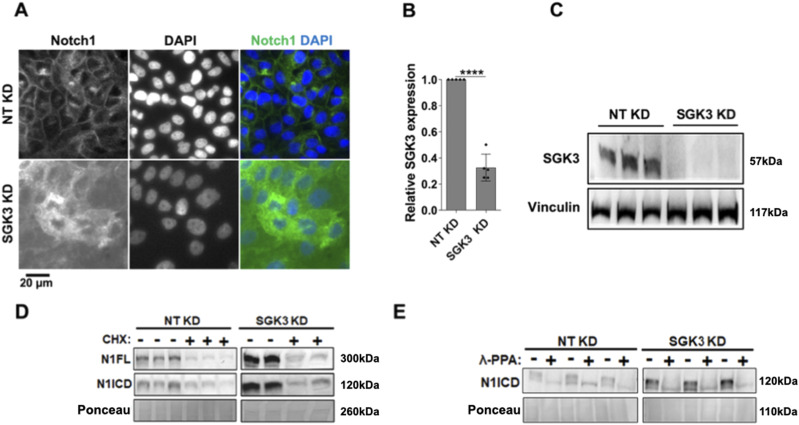
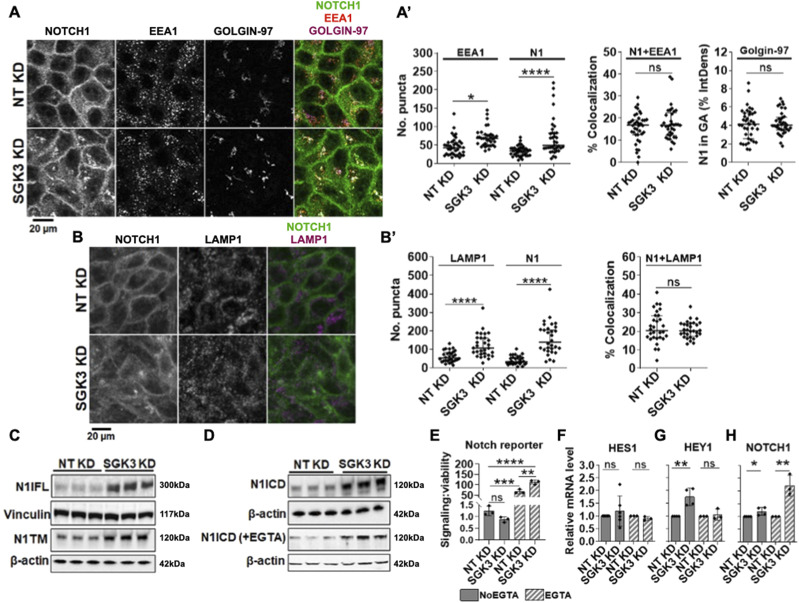
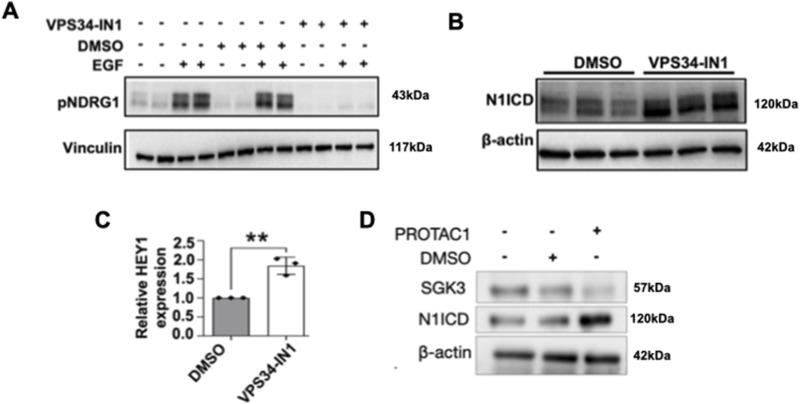
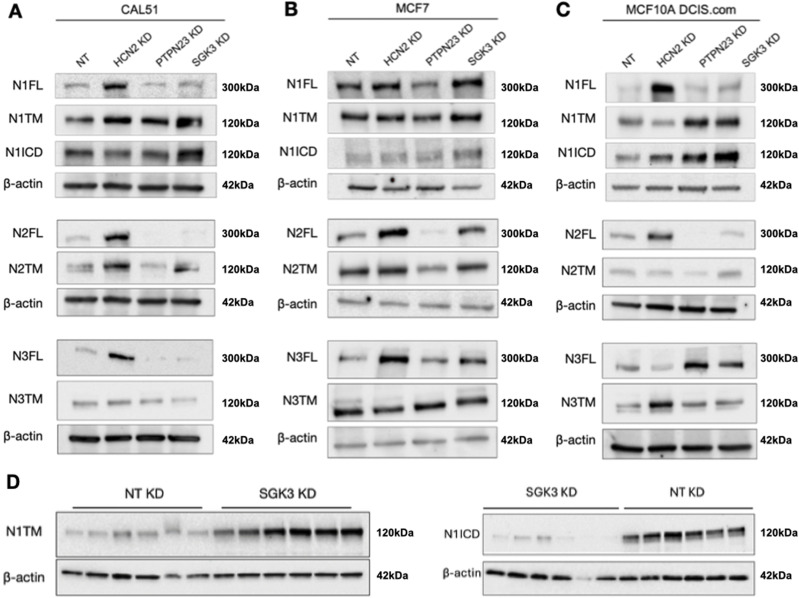
The evolutionarily conserved Notch signaling pathway controls cell-cell communication, enacting cell fate decisions during development and tissue homeostasis. Its dysregulation is associated with a wide range of diseases, including congenital disorders and cancers. Signaling outputs depend on maturation of Notch receptors and trafficking to the plasma membrane, endocytic uptake and sorting, lysosomal and proteasomal degradation, and ligand-dependent and independent proteolytic cleavages. We devised assays to follow quantitatively the trafficking and signaling of endogenous human NOTCH1 receptor in breast epithelial cells in culture. Based on such analyses, we executed a high-content screen of 2,749 human genes to identify new regulators of Notch that might be amenable to pharmacologic intervention. We uncovered 39 new NOTCH1 modulators for NOTCH1 trafficking and signaling. Among them, we find that PTPN23 and HCN2 act as positive NOTCH1 regulators by promoting endocytic trafficking and NOTCH1 maturation in the Golgi apparatus, respectively, whereas SGK3 serves as a negative regulator that can be modulated by pharmacologic inhibition. Our findings might be relevant in the search of new strategies to counteract pathologic Notch signaling.


Conflict of interest statement

The authors declare that they have no conflict of interest.

Figures

Figure 1.
Figure 1.. Manipulation of endogenous NOTCH1 signaling in MCF10A cells.
(A) The NOTCH1 (N1) full length receptor (N1FL) is composed of the N1 extracellular domain (N1ECD) and of the N1 transmembrane domain (N1TM). The N1ECD contains several EGF-like repeats, some of which are binding sites for Notch ligands and the negative regulatory region, which includes the Lin12/Notch Repeats (LNR) and the heterodimerization domain (HD). The N1ECD and N1TM portions of Notch receptors are produced by Furin cleavage occurring at the S1 site during trafficking to the trans-Golgi network and are non-covalently held together by Ca2+ at the HD. Ca2+ depletion causes ADAM10 and γ-secretase to sequentially cleave the receptor at S2 and S3 sites. This leads to the release in the cytoplasm of the N1 intracellular domain (N1ICD), which translocates to the nucleus. N1ICD contains the RBPJ-kappa-associated module, ankyrin repeats (ANK), nuclear localization signals, and the proline (P), glutamic acid (E), serine (S), and threonine (T) – PEST domain, which limits NICD half-life. (B) Immunofluorescence reveals that EGTA treatment relocates most endogenous NOTCH1 from the cell surface to the nucleus and this is inhibited by silencing ADAM10 or PSENEN. (C) siRNA against ADAM10 or PSENEN effectively depletes their mRNA. (D) The Notch reporter cell line, MCF10A-RbpJk-Luc, reports strong EGTA-induced Notch signaling, and this effect is markedly suppressed by silencing NOTCH1, PSENEN, or ADAM10. (E) Western blot analysis of MCF10A cell extracts using an antibody against S3-cleaved N1 shows that unstimulated cells express low levels of N1ICD, which appears as a doublet. γ-secretase inhibition for 3 h (DAPT) markedly reduces basal levels of the N1ICD lower band. (F) Western blot analysis of MCF10A lysates indicates that λ-phosphatase (λ-PPA) treatment leads to disappearance of the upper band of the N1ICD doublet, indicating that it corresponds to a phosphorylated N1CD form. *** and **** indicate P < 0.001 and P < 0.0001, respectively.
Figure 2.
Figure 2.. Endocytic and exocytic endogenous NOTCH1 receptor trafficking in MCF10A cells.
(A) Confocal sections of MCF10A cells treated and immunolabeled as indicated. Upon BafA1 treatment, plasma membrane (PM) localization of both NOTCH1 and EGFR is reduced, and both receptors accumulate in LAMP1-positive compartments (arrows) (A') Quantification of panel (A). (B) Confocal sections of MCF10A cells treated and immunolabeled as indicated. 4-h EGTA treatment depletes NOTCH1 from the PM and strongly accumulates it in a RTN3-positive compartment (yellow arrow), whereas EGFR remains on the PM (red arrow). In unstimulated cells, a pool of both NOTCH1 and EGFR is visible in the RTN3-positive compartment (white arrow). (B') Quantification of panel B. (C) Confocal sections of MCF10A cells treated and immunolabeled as indicated. An intracellular pool of NOTCH1 and EGFR colocalizes with the Golgi apparatus (GA) marker, GIANTIN (white arrow). Compared with non-EGTA–treated cells, 4-h EGTA treatment causes diffused NOTCH1 and EGFR accumulation in the cytosol, with some EGFR remaining on the PM (green arrows). The GIANTIN signal is also diffused consistent with an expected fragmentation of the GA. EGTA washout (w/o) for 1 h causes all NOTCH1 and most EGFR signal to localize in the GA (red arrows). EGTA w/o for 4 h or overnight (ON) restores normal intracellular distribution of NOTCH1 and EGFR. (C') Quantification of panel (C). *, **, ***, ****, ns indicate P < 0.05, P < 0.01, P < 0.001, P < 0.0001, and not significant, respectively).
Figure 3.
Figure 3.. High-content screen pipeline and image analysis strategy.
(A) The primary screen was performed on MCF10A cells in a 384-well format. Genes belonging to a subset of the human genome were knocked down in six replicate plates for 72 h by RNAi along with the listed controls. In a duplicate experiment, cells were stimulated with EGTA. Control wells were distributed on the plates as shown. NT: non-targeting KD – cells were transfected with non-targeting siRNA. No siRNA: cells received RNAiMAX only. Positive control (pos ctrl) – cells were transfected with siRNA against PSENEN. Transfection pos ctrl: cells were transfected with siRNA against polo-like kinase 1 (PLK1) as a cytotoxic indicator of transfection efficiency. Outer wells (yellow) were filled with media to prevent evaporation in experimental wells. (B) To assess endogenous NOTCH1 localization, cells in plates were subjected to automated IF and DAPI/phalloidin labeling to demarcate nuclei and the cell cortex, respectively. The script steps of the image acquisition and analysis developed in-house are as follows: (1) The nuclei were segmented based on DAPI signal. (2) The cell surface was segmented using the phalloidin signal and overlaid on the NOTCH1 channel (3) to quantify levels of cell surface NOTCH1 (4), and the area between the cell cortex and the nuclei was used to determine levels of cytoplasmic NOTCH1 (5). (6) The phalloidin mask was also used to count cells and establish cell-to-cell boundaries. (7) Nuclear size was used as readout of cell viability as compact; pyknotic nuclei identify dead cells. Using such a pipeline, each gene KD was defined by its effects on the amount of NOTCH1 in the cell cortex, in the cytoplasm or in the nucleus.
Figure 4.
Figure 4.. Schematics of the screens and of the candidate gene classification process.
(A) A total of 2,749 genes were silenced in the primary screen. Candidates that, when compared with controls, led to marked cytotoxicity, did not affect intracellular NOTCH1 (N1) localization, or caused general loss of NOTCH1 signal, were excluded from further analysis (orange, blue, and light blue circles, respectively). A total of 231 genes that altered intracellular NOTCH1 localization were identified (green). 117 did so in unstimulated condition, 63 upon EGTA stimulation and 51 in both conditions. (B) The 231 candidates underwent secondary screening. 73 of the 231 led to changes in NOTCH1 localization, but only 51 genes reproduced the primary screen phenotypes. (C) Of these 51, 38 affected NOTCH1 trafficking in the unstimulated No EGTA condition, 13 altered NOTCH1 trafficking in the stimulated +EGTA condition. (D, E) MCF10A-RbpJk-Luc Notch reporter assay identifies 39 candidates that affect Notch signaling. (F) Of the 39, 30 suppress Notch signaling, whereas nine enhance Notch signaling. (G) Classification of the 39 candidates by their effect on intracellular NOTCH1 (N1) localization and/or levels.
Figure S1.
Figure S1.. Representative images of the Notch phenotypic classes.
High-content screening (primary screen) widefield images of MCF10A cells treated and immunolabeled as indicated. Genes were grouped into the indicated classes based on their effect on intracellular NOTCH1 (N1) localization in NoEGTA or EGTA conditions.
Figure S2.
Figure S2.. Effects of PTPN23 silencing.
(A) A high-content screening widefield image of MCF10A cells treated and immunolabeled as indicated. PTPN23 silencing causes marked accumulation of NOTCH1-positive puncta. (B) RT-qPCR analysis indicates effective PTPN23 depletion. **** indicates P < 0.0001.
Figure 5.
Figure 5.. Analysis of NOTCH1 localization and signaling activity upon PTPN23 silencing.
(A) Confocal sections of MCF10A cells treated and immunolabeled as indicated. (A’) PTPN23 silencing causes marked increase in the number of EEA1, LAMP1, and NOTCH1 (N1) puncta, as well as accumulation of intracellular NOTCH1-positive puncta, which mostly colocalize with EEA1 (arrows; quantified in (A’)). (B, C) Western blot analyses indicate that PTPN23 depletion reduces the levels of N1FL and N1TM but does not alter N1ICD levels with or without EGTA. (C) Note that levels of N1ICD in unstimulated and EGTA-stimulated cells are not comparable in (C) because of different detection methods (see the Materials and Methods section). (D, E, F, G) The Notch reporter cell line MCF10A-RbpJk-Luc and RT-qPCR analysis reveal that PTPN23 depletion suppresses basal Notch signaling. *, ****, and ns indicates P < 0.05, P < 0.0001, and not significant, respectively.
Figure S3.
Figure S3.. NOTCH2 and NOTCH3 expression upon silencing.
(A, B) Western blot analysis of MCF10A cell extracts using antibodies against N2FL, N2TM (A) and N3FL, N3TM (B) upon HCN2, PTPN23, and SGK3 knockdown. β-actin was used as loading control.
Figure S4.
Figure S4.. NOTCH1, NOTCH 2 and NOTCH3 expression in a panel of breast cancer cell lines.
Western blot analysis of extracts from a panel of breast cancer cell lines using antibodies against N1, N2, and N3. β-actin was used as loading control.
Figure S5.
Figure S5.. Effects of HCN2 silencing.
(A) A high-content screening widefield image of MCF10A cells treated and immunolabeled as indicated. HCN2 silencing causes marked NOTCH1 accumulation in the perinuclear region. (B) RT-qPCR analysis indicates effective HCN2 depletion. (C) The Notch reporter cell line MCF10A-RbpJk-Luc reveals that HCN2 silencing suppresses Notch signaling in No EGTA and EGTA conditions. (D) Western blot analysis indicates that HCN2 silencing enhances N1FL levels in EGTA conditions. *, **, ***, and **** indicate P < 0.05, P < 0.01, P < 0.001, and P < 0.0001, respectively.
Figure 6.
Figure 6.. Analysis of NOTCH1 localization and signaling activity upon HCN2 silencing.
(A) Confocal sections of MCF10A cells treated and immunolabeled as indicated. (A’) HCN2 silencing causes marked NOTCH1 accumulation in the Giantin-positive cis-GA compartment when significantly reducing cell surface NOTCH1 (N1) levels (quantified in (A’)). (B) Confocal sections of MCF10A cells treated and immunolabeled as indicated. (B’) HCN2 silencing markedly depletes the TGN46-positive TGN compartment but not the golgin-97-positive TGN compartment (quantified in (B’)). (C, D, E) The Notch reporter cell line, MCF10A-RbpJk-Luc and RT-qPCR analysis reveal that HCN2 silencing suppresses basal Notch signaling. (F) Western blot analyses indicate that HCN2 depletion reduces both basal and EGTA-stimulated N1ICD levels. (F) Note that levels of N1ICD in unstimulated and EGTA-stimulated cells are not comparable in (F) because of different detection methods (see materials and methods). (G) Western blot analysis indicates that HCN2 silencing results in marked accumulation of N1FL. *, **, ****, and ns indicate P < 0.05, P < 0.01, P < 0.0001, and not significant, respectively.
Figure S6.
Figure S6.. NOTCH1 secretion dynamics upon HCN2 KD.
(A) Confocal sections of MCF10A cells treated and immunolabeled as indicated. (A') Quantification of panel (A); *, **, ****, and ns indicate P < 0.05, P < 0.01, P < 0.0001, and not significant, respectively.
Figure S7.
Figure S7.. Effects of SGK3 silencing.
(A) A high-content S7 widefield image of MCF10A cells treated and immunolabeled as indicated. SGK3 silencing causes marked NOTCH1 accumulation in the cytoplasm. (B, C) RT-qPCR and Western blot analyses indicate effective SGK3 depletion. **** indicates P < 0.0001. (D) Western blot analyses indicate that SGK3 does not destabilize N1ICD or N1FL. (E) Western blot analyses of lysates treated with λ-phosphatase (λ-PPA) showed that similar to controls, most of the N1ICD that accumulates upon SGK3 silencing is phosphorylated.
Figure 7.
Figure 7.. Analysis of NOTCH1 localization and signaling activity upon SGK3 silencing.
(A) Confocal sections of MCF10A cells treated and immunolabeled as indicated. (A’) SGK3 silencing causes NOTCH1 (N1) accumulation in the cytoplasm without apparent colocalization with EEA1 or golgin-97 (quantified in (A’)). (B) Confocal sections of MCF10A cells treated and immunolabeled as indicated. (B’) The accumulated N1 upon SGK3 silencing does not colocalize with LAMP1 (quantified in (B’)). (C, D) Western blot analyses show that SGK3 depletion causes strong accumulation of all forms of the NOTCH1 receptor. (D) Note that levels of N1ICD in unstimulated and EGTA-stimulated cells are not comparable in (D) because of different detection methods (see the Materials and Methods section). (E) The Notch reporter cell line MCF10A-RbpJk-Luc reveals that SGK3 silencing enhances Notch signaling in EGTA-stimulated cells. (F, G, H) RT-qPCR analysis reveals that SGK3 depletion enhances basal expression of NOTCH1 both unstimulated and EGTA-stimulated cells.
Figure 8.
Figure 8.. Pharmacologic SGK3 inhibition elevates γ-secretase-derived N1ICD and Notch signaling.
(A) Western blot analysis reveals that serum-starved, VPS34-IN1-treated, MCF10A cells fail to phosphorylate the SGK3 target NDRG1 upon EGF treatment. (B) Western blot analysis reveals that pharmacologic VPS34-IN1 treatment enhances N1ICD levels. (C) RT-qPCR analysis shows that pharmacologic VPS34-IN1 treatment significantly enhances the expression of the Notch target gene HEY1. (D) Western blot analysis confirms that a specific pharmacological treatment with PROTAC1 enhances N1ICD levels. ** indicates P < 0.01.
Figure 9.
Figure 9.. NOTCH1 expression upon KD in cancer cells.
(A, B, C, D) Western blot analysis of CAL-51 (A), MCF7 (B), and MCF10ADCIS.COM (C) or SCC022 (D) protein extracts treated as indicated, using antibodies against N1ICD and N1FL, N1TM. β-actin was used as loading control.

References

    1. Acar M, Jafar-Nejad H, Takeuchi H, Rajan A, Ibrani D, Rana NA, Pan H, Haltiwanger RS, Bellen HJ (2008) Rumi is a CAP10 domain glycosyltransferase that modifies Notch and is required for Notch signaling. Cell 132: 247–258. 10.1016/J.CELL.2007.12.016 - DOI - PMC - PubMed
    1. Ali N, Zhang L, Taylor S, Mironov A, Urbé S, Woodman P (2013) Recruitment of UBPY and ESCRT exchange drive HD-PTP-dependent sorting of EGFR to the MVB. Curr Biol 23: 453–461. 10.1016/j.cub.2013.02.033 - DOI - PubMed
    1. Andersson ER, Sandberg R, Lendahl U (2011) Notch signaling: Simplicity in design, versatility in function. Development 138: 3593–3612. 10.1242/dev.063610 - DOI - PubMed
    1. Artavanis-Tsakonas S, Rand MD, Lake RJ (1999) Notch signaling: Cell fate control and signal integration in development. Science 284: 770–776. 10.1126/science.284.5415.770 - DOI - PubMed
    1. Aster JC, Pear WS, Blacklow SC (2017) The varied roles of notch in cancer. Annu Rev Pathol 12: 245–275. 10.1146/annurev-pathol-052016-100127 - DOI - PMC - PubMed

MeSH terms

Substances