. 2025 Feb 5;45(6):e1507242024.
doi: 10.1523/JNEUROSCI.1507-24.2024.

Convergence of Type 1 Spiral Ganglion Neuron Subtypes onto Principal Neurons of the Anteroventral Cochlear Nucleus

Affiliations

Convergence of Type 1 Spiral Ganglion Neuron Subtypes onto Principal Neurons of the Anteroventral Cochlear Nucleus

Nicole F Wong et al. J Neurosci. .

Abstract

The mammalian auditory system encodes sounds with subtypes of spiral ganglion neurons (SGNs) that differ in sound level sensitivity, permitting discrimination across a wide range of levels. Recent work suggests the physiologically defined SGN subtypes correspond to at least three molecular subtypes. It is not known how information from the different subtypes converges within the cochlear nucleus. We examined this issue using transgenic mice of both sexes that express Cre recombinase in SGNs that are positive for markers of two subtypes: CALB2 (calretinin) in type 1a SGNs and LYPD1 in type 1c SGNs, which correspond to high- and low-sensitivity subtypes, respectively. We crossed these with mice expressing floxed channelrhodopsin, which allowed specific activation of axons from type 1a or 1c SGNs using optogenetics. We made voltage-clamp recordings from bushy cells in the anteroventral cochlear nucleus (AVCN) and found that the synapses formed by CALB2- and LYPD1-positive SGNs had similar EPSC amplitudes and short-term plasticity. Immunohistochemistry revealed that individual bushy cells receive a mix of 1a, 1b, and 1c synapses with VGluT1-positive puncta of similar sizes. We used optogenetic stimulation during in vivo recordings to classify chopper and primary-like units as receiving versus nonreceiving 1a- or 1c-type inputs. These groups showed no significant difference in threshold or spontaneous rate, suggesting the subtypes do not segregate into distinct processing streams in the AVCN. Our results indicate that principal cells in the AVCN integrate information from all SGN subtypes with extensive convergence, which could optimize sound encoding across a large dynamic range.

Keywords: T-stellate cell; bushy cell; cochlear nucleus; endbulb of Held; spiral ganglion.


Conflict of interest statement

The authors declare no competing financial interest.

Figures
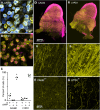
Figure 1.
Figure 1.
ChR2-eYFP expression in the spiral ganglion and cochlear nucleus. A, B, Confocal images of the spiral ganglion from (A) CALB2 and (B) LYPD1 mice. Images show eYFP fluorescence (yellow) overlaid with immunoreactivity to antibodies against (A, blue) calretinin or (B, red) Pou4f1. The white arrow in B indicates a cell that shows eYFP fluorescence, but no Pou4f1 immunoreactivity. Scale bar in A also applies to B. C, Quantification of SGNs that did or did not express eYFP and subtype-specific markers. Markers are values from individual cochleas (1 to 2 cochleas per mouse, 3 mice). eYFP expression is closely linked to marker expression in both 1a and 1c mouse lines. DG, Confocal stacks showing overviews of the cochlear nucleus (Di, Fi) and closeups where the auditory nerve enters (Dii, E, Fii, G). eYFP (yellow) is highly expressed in tamoxifen-injected mice (D, CALB2; F, LYPD1) and sparse in mice not injected with tamoxifen (E, CALB2TI−; G, LYPD1TI−). VGluT1-immunolabelling (magenta) labels endbulbs in the AVCN, for context. Scale bar in E applies to close-ups in D–G. The dotted boxes in Di and Fi show locations of closeups in Dii and Fii.
Figure 2.
Figure 2.
ABR assessment of transgenic lines showing relatively normal auditory activity. A, Representative ABR waveforms from a CBA/CaJ mouse (left, black), a CALB2 mouse (middle, red), and a LYPD1 mouse (right, blue), in response to 0.1 ms click stimuli. B, ABR thresholds for ears from CBA/CaJ mice (“CBA”), CALB2 mice not injected with tamoxifen (“CTI−”), LYPD1 not injected with tamoxifen (“LTI−”), CALB2 mice injected with tamoxifen (“C”), and LYPD1 mice injected with tamoxifen (“L”). C, ABR-level functions for wave 1 of the ABR for control (black), CALB2 (red), and LYPD1 (blue) mice. Markers show mean and standard error of the mean (SEM) for each genotype.
Figure 3.
Figure 3.
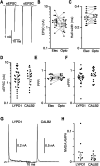
Properties of SGN synapses onto bushy cells in the AVCN. A, Representative EPSCs recorded in a bushy cell following paired electrical (left) or optogenetic (right) stimulation in a slice from a LYPD1 mouse (interpulse interval of 15 ms). Stimulus artifact after electrical stimulation is blanked. Optogenetic EPSCs were aligned by their rising phase before averaging. B, C, Comparison of EPSC amplitudes (B) and half-widths (C) evoked by electrical or optogenetic stimulation in the same bushy cell. Lines connect data recorded from the same bushy cells. Open markers are (B) median ± median deviation or (C) mean ± standard error from 14 cells in four LYPD1 mice. D, Amplitudes of optogenetically evoked EPSCs from LYPD1 and CALB2 mice. E, Paired-pulse ratio (PPR, 15 ms) in response to electrical or optogenetic stimulation. Lines connect data recorded from the same bushy cells (11 cells, 4 mice). F, Optogenetically evoked PPRs from LYPD1 and CALB2 mice. G, EPSCs evoked optogenetically at +40 mV from LYPD1 (left) and CALB2 (right) mice, showing a short-latency AMPA-receptor–mediated peak, followed by a NMDA-receptor–mediated slow component, which was quantified at 2 ms after the AMPA peak. H, NMDA:AMPA ratios from traces similar to panel G, from LYPD1 (8 cells, 4 mice) and CALB2 (9 cells, 4 mice). No comparisons show significant differences.
Figure 4.
Figure 4.
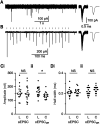
Quantal properties in subtypes. A, Representative recording from a LYPD1 mouse (left) with individual sEPSCs overlaid (middle) and average sEPSC (right). B, Optogenetically evoked EPSCs in the same cell as panel A with 3 mM Sr2+ in the ACSF to enhance delayed release (oEPSCDR). Left panel, Representative trace in response to optogenetic stimulation (markers). The middle panel shows overlaid oEPSCDR, with average at right. C, Amplitudes of sEPSCs (i) and oEPSCDR (ii) recorded in LYPD1 (“L”; i, 16 cells, 8 mice; ii, 17 cells, 9 mice) and CALB2 (“C”; i, 18 cells, 10 mice; ii, 16 cells, 9 mice). oEPSCDR amplitude differed significantly between the two groups (p = 0.01), but sEPSC amplitude did not (p = 0.61). D, Width at half-maximum (half-width) of sEPSCs (i) and oEPSCDR (ii). There were no significant differences between LYPD1 and CALB2 mice.
Figure 5.
Figure 5.
Convergence of subtypes. A, Representative confocal section of the AVCN, with synaptic areas around bushy cells labeled with antibodies against VGluT1 (i, αVGluT1) and calretinin (ii, αCR) in a LYPD1 mouse (iii, eYFP). iv, Merged images from panels iiii. Puncta labeled with eYFP and immunopositive for αVGluT1 (1c-like) appear magenta, puncta labeled with eYFP and immunopositive for αCR (1a-like) appear yellow, and puncta only immunopositive for αVGluT1 (1b-like) are red. B, Volumes of reconstructed αVGluT1+ puncta immunopositive for αCR (1a-like, 20 puncta), labeled with eYFP (1c-like, 15 puncta), and neither (1b-like, 16 puncta). Solid markers are measures of individual puncta (51 puncta, 11 cells, 3 mice), and open markers are median ± median absolute deviation. C, Percent of αVGluT1+ volume onto each cell that is immunopositive for αCR (1a-like), labeled with eYFP (1c-like) and neither (1b-like). Solid markers are individual measures for 11 cells from 3 mice, and open markers are mean ± standard error of the mean.
Figure 6.
Figure 6.
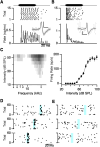
Using optogenetics to identify 1a- and 1c-receiving units in the AVCN in vivo. A, B, Responses to sound for representative chopper (A) and primary-like (B) units. Top traces, CF tone stimulus (A, 17 kHz, 42.4 dB SPL; B, 16 kHz, 88.8 dB SPL). Middle, Rasters of responses over 15 trials. Bottom, Histogram from all trials. Insets, Individual (gray) and average (black) spikes. Scale bars in insets: A, 0.1 mV, 1 ms; B, 0.2 mV, 1 ms. C, Representative tuning curve and rate-level function for a primary-like unit in a LYPD1 mouse. D, E, Rasters showing action potentials (dots) and optogenetic stimulation (blue rectangles) of representative units in a LYPD1 mouse. The occurrence of spikes during optogenetic stimulation indicates that the chopper unit in D is 1c-receiving, whereas the lack of spikes indicates that the primary-like unit in E is 1c-nonreceiving. There was a reduction in spiking shortly after the light flash in E, most likely because excitatory inputs to unrecorded inhibitory cells were activated.
Figure 7.
Figure 7.
Comparing features of 1a- and 1c-receiving units in AVCN. Spontaneous rate and sound level thresholds are indistinguishable between 1c-receiving versus 1c-nonreceiving units (A, B) or between 1a-receiving versus 1a-nonreceiving units (C, D), for both primary-like (A, C) and chopper (B, D) units. Small markers indicate spontaneous rate and relative threshold of individual units, and large markers indicate median ± median absolute deviation.

References

    1. Cant NB, Morest DK (1979) Organization of the neurons in the anterior division of the anteroventral cochlear nucleus of the cat. Light-microscopic observations. Neuroscience 4:1909–1923. 10.1016/0306-4522(79)90065-4 - DOI - PubMed
    1. Cao XJ, Oertel D (2010) Auditory nerve fibers excite targets through synapses that vary in convergence, strength, and short-term plasticity. J Neurophysiol 104:2308–2320. 10.1152/jn.00451.2010 - DOI - PMC - PubMed
    1. Chanda S, Xu-Friedman MA (2010) A low-affinity antagonist reveals saturation and desensitization in mature synapses in the auditory brainstem. J Neurophysiol 103:1915–1926. 10.1152/jn.00751.2009 - DOI - PMC - PubMed
    1. Chen C, Regehr WG (2000) Developmental remodeling of the retinogeniculate synapse. Neuron 28:955–966. 10.1016/S0896-6273(00)00166-5 - DOI - PubMed
    1. Dodge FA Jr, Miledi R, Rahamimoff R (1969) Strontium and quantal release of transmitter at the neuromuscular junction. J Physiol 200:267–283. 10.1113/jphysiol.1969.sp008692 - DOI - PMC - PubMed

LinkOut - more resources