. 2025 Jan;33(1):177-189.
doi: 10.1002/oby.24174. Epub 2024 Dec 11.

DNA methylation in cord blood partially mediates the effects of prepregnancy BMI on early childhood offspring BMI

Affiliations

DNA methylation in cord blood partially mediates the effects of prepregnancy BMI on early childhood offspring BMI

Alice Maguolo et al. Obesity (Silver Spring). 2025 Jan.

Abstract

Objective: We investigated whether prepregnancy BMI (prePregBMI) in women with obesity was associated with differential DNA methylation (DNAm) in cord blood (CB) and whether DNAm may mediate the association of prePregBMI and early childhood BMI z score (BMIz).

Methods: From the Treatment of Obese Pregnant Women (TOP) study, 232 mother-child pairs were included. We conducted an epigenome-wide association study on prePregBMI and CB DNAm (450k array), followed by causal mediation analyses to test whether DNAm may mediate effects of prePregBMI on BMIz at age 36 months (BMIz36).

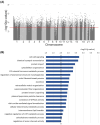
Results: DNAm at 5345 CpG sites annotated to 2842 genes, which were overrepresented in biological processes linked to carbohydrate metabolism and plasma lipoprotein particle clearance, was associated with prePregBMI (false discovery rate < 10%). Causal mediation analyses of 168 methylation sites associated with BMIz36 (p < 0.05) and overlapping with the 5345 prePregBMI-associated sites identified two sites on SYT7 and DEAF1, partially mediating the effect of prePregBMI on BMIz36 (p ≤ 0.01). After cross-validation, a methylation risk score including these two sites could predict the highest quartile of BMIz36 and fat mass (in grams) with area under the curve = 0.72 (95% CI: 0.58-0.85) and area under the curve = 0.71 (95% CI: 0.58-0.85), respectively.

Conclusions: CB DNAm at birth may partially mediate effects of prePregBMI on early childhood BMIz36, supporting its plausible role in influencing individual future obesity risk.


Conflict of interest statement

The authors declared no conflicts of interest.

Figures

FIGURE 1
FIGURE 1
Aims and methods of the study. (A) The aims of the study were as follows: 1) to test whether prepregnancy BMI (prePregBMI) was associated with DNA methylation (DNAm) in cord blood (CB); and 2) to use a causal mediation analysis to test whether DNAm at any of the discovered sites could partially explain the effect that prePregBMI exerts on BMI z score at age 36 months (BMIz36). The solid blue arrow represents the effect of prePregBMI on children's anthropometric measurements that operate directly (average direct effect [ADE]) or through a pathway different from the mediator analyzed in the current study (DNAm in CB). The dotted blue arrows represent a suggested alternative pathway, in which an indirect effect (average causal mediator effect [ACME]) of prePregBMI on children's anthropometric measurements is mediated by CB DNAm at each respective CpG site chosen as the mediator. Created with BioRender.com. (B) The cohort and data collection are illustrated. Created with BioRender.com.
FIGURE 2
FIGURE 2
Study design and analytic workflow. All the analyses considering BMI z score at age 36 months were not adjusted for smoking because only two mothers smoked during pregnancy in the subset of 79 children with anthropometric follow‐up at 36 months. ACME, average causal mediator effect; DNAm, DNA methylation; GA, gestational age; GWG, gestational weight gain; TOP, Treatment of Obese Pregnant Women; PACE, Pregnancy and Childhood Epigenetics Consortium; QC, quality control.
FIGURE 3
FIGURE 3
Manhattan plot and Gene Ontology (GO) analysis. (A) The Manhattan plot represents the distribution of methylation sites across the genome for the association between prepregnancy BMI and DNA methylation in cord blood, after adjustment for covariates. The red line shows q < 0.1. (B) GO analysis of the 5345 (q < 0.1) methylation sites after the selection of biological processes (BP) with p < 0.01 and the removal of the redundant terms using REViGO. Some of the most relevant nonredundant enrichment items in the BP retained in REViGO analysis with the corresponding p value of these items. The dotted line represents p = 0.01. All the 30 nonredundant enrichment items in the BP retained in the REViGO analysis are shown in Table S3.
FIGURE 4
FIGURE 4
Box plot of methylation risk score (MRS) and receiver operating characteristic (ROC) curves. (A) Box plot of MRS generated by DNA methylation levels of cg13395854 (SYT7) and cg03608093 (DEAF1) in cord blood of 79 mother–child pairs. Comparison between the highest quartile (4°) of BMI z score at 36 months (BMIz36) and the other quartiles considered together (1°–3°) (reference group). An independent t test was used for the analysis. (B) ROC curves show the predictive ability of MRS to predict the highest quartile of BMIz36 after leave‐one‐out cross‐validation (area under the ROC [AUC] of 0.72). The clinical factors alone (i.e., prepregnancy BMI and BMIz at birth) and in combination with MRS could predict the highest quartile of BMIz36 with an AUC of 0.60 (95% CI: 0.47–0.74) and 0.73 (95% CI: 0.60–0.85), respectively, after leave‐one‐out cross‐validation.
FIGURE 5
FIGURE 5
Epigenome‐wide association studies (EWAS) and genome‐wide association studies (GWAS) catalog search. (A) EWAS catalog traits wheel of the 168 methylation sites associated with prepregnancy BMI (prePregBMI; q < 0.1) and with BMI z score at 36 months (BMIz36; p < 0.05; covariate‐adjusted models). The figure shows the methylation sites and annotated genes, where available, that have been previously associated with traits related to metabolic health (i.e., maternal BMI, hypertensive disorders of pregnancy, physical activity and low‐energy diet during pregnancy, cholesterol esters to total lipids ratio in chylomicrons and very low‐density lipoprotein, ratio of omega 3 fatty acids to total fatty acids, and incident or prevalent type 2 diabetes [T2D]) (accessed December 2023). (B) GWAS catalog traits wheel of the 119 protein‐coding genes annotated to the 168 methylation sites associated with prePregBMI (q < 0.1) and with BMIz36 (p < 0.05; covariate‐adjusted models). The figure shows the genes annotated to the 168 methylation sites and to the single‐nucleotide polymorphisms that have previously been associated with obesity or obesity‐related traits (i.e., obesity or visceral adiposity, dyslipidemia, blood pressure, T2D, nonalcoholic fatty liver disease, cardiovascular disease, and hyperuricemia) (accessed December 2023).

References

    1. World Health Organization . WHO European Regional Obesity Report 2022. WHO; 2022.
    1. Oestreich AK, Moley KH. Developmental and transmittable origins of obesity‐associated health disorders. Trends Genet. 2017;33(6):399‐407. - PMC - PubMed
    1. Schellong K, Schulz S, Harder T, Plagemann A. Birth weight and long‐term overweight risk: systematic review and a meta‐analysis including 643,902 persons from 66 studies and 26 countries globally. PLoS One. 2012;7(10):e47776. - PMC - PubMed
    1. Lawlor DA, Relton C, Sattar N, Nelson SM. Maternal adiposity—a determinant of perinatal and offspring outcomes? Nat Rev Endocrinol. 2012;8(11):679‐688. - PubMed
    1. Carlsen EM, Renault KM, Nørgaard K, et al. Newborn regional body composition is influenced by maternal obesity, gestational weight gain and the birthweight standard score. Acta Paediatr. 1992;103(9):939‐945. - PubMed

Substances

LinkOut - more resources