. 2024 Dec 11;4(1):264.
doi: 10.1038/s43856-024-00696-4.

Genomic virulence markers are associated with severe outcomes in patients with Pseudomonas aeruginosa bloodstream infection

Affiliations

Genomic virulence markers are associated with severe outcomes in patients with Pseudomonas aeruginosa bloodstream infection

John Karlsson Valik et al. Commun Med (Lond). .

Abstract

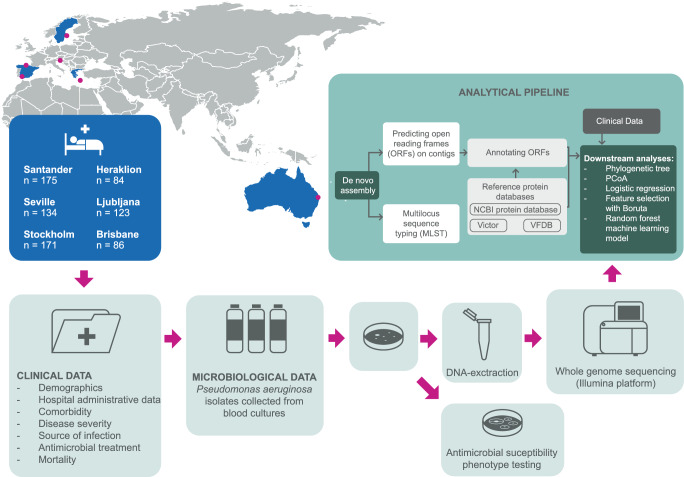
Background: Pseudomonas aeruginosa (PA) bloodstream infection (BSI) is a common healthcare-associated complication linked to antimicrobial resistance and high mortality. Ongoing clinical trials are exploring novel anti-virulence agents, yet studies on how bacterial virulence affects PA infection outcomes is conflicting and data from real-world clinical populations is limited.

Methods: We studied a multicentre cohort of 773 adult patients with PA BSI consecutively collected during 7-years from sites in Europe and Australia. Comprehensive clinical data and whole-genome sequencing of all bacterial strains were obtained.

Results: Based on the virulence genotype, we identify several virulence clusters, each showing varying proportions of multidrug-resistant phenotypes. Genes tied to biofilm synthesis and epidemic clones ST175 and ST235 are associated with mortality, while the type III secretion system is associated with septic shock. Adding genomic biomarkers to machine learning models based on clinical data indicates improved prediction of severe outcomes in PA BSI patients.

Conclusions: These findings suggest that virulence markers provide prognostic information with potential applications in guiding adjuvant sepsis treatments.

Plain language summary

Pseudomonas aeruginosa bacteria are often found in the hospital environment, primarily infecting vulnerable patients with underlying health conditions. Due to antibiotic resistance, which occurs when bacteria are not killed by antibiotic treatment, these infections are often difficult to treat, and death rates are high. In this study, we analyzed data from patients in Europe and Australia with bloodstream infections to understand how bacterial traits affect patient outcomes. Using genetic information from the bacteria, we identified characteristics associated with antibiotic resistance. In addition, we found certain bacterial traits, such as the ability to synthesize toxins and biofilms, were linked to disease severity and mortality risk. These findings indicate that specific characteristics of P. aeruginosa may influence the severity of infection and could be targeted in newly developed treatments.


Conflict of interest statement

Competing interests: The authors declare the following competing interests: L.M.-M. reports receiving grants from Shionogi, Merck Sharp, and Dohme, and payment or honoraria for lectures, presentations, speakers bureaus, manuscript writing, or educational events from Pfizer, hionogi, Merck Sharp, and Dohme. No other authors report any conflict of interest.

Figures

Fig. 1
Fig. 1. Schematic overview of the study.
The figure illustrates the study design, setting, study population, and analytical pipeline. It was created by the authors using Adobe Illustrator and R. Open Reading Frames (ORFs), Multilocus Sequence Typing (MLST), The National Center for Biotechnology Information (NCBI), Virulence Factor Database (VFDB), and Principal Coordinate Analysis (PCoA).
Fig. 2
Fig. 2. Distribution of virulence genes and function.
Bar chart showing the level of collinearity between virulence genes based on function and occurrence in the 773 isolates. A gene identity threshold of 80% was used. Lipopolysaccharides (LPS), type III secretion system (T3SS), and type VI secretion system (T6SS).
Fig. 3
Fig. 3. The evolutionary relationships and geographical distribution among P. aeruginosa bloodstream infection isolates.
a Phylogenetic tree of the P. aeruginosa Multilocus Sequence Types (MLST) (n = 773). Tree color annotation is based on STs occurring more than twice in the dataset. The outer circles show a heatmap of exoenzyme gene detection (dark) or not (light). b Circle plot showing the geographical distribution of all the different STs from the 773 samples. The scale below the name of the study site marks the number of isolates. c Prevalence of antimicrobial resistance stratified by study site (Australia n = 86, Greece n = 84, Spain [Santander] n = 175, Spain [Seville] n = 134, Slovenia n = 123, and Sweden n = 171). Sequence Type (ST).
Fig. 4
Fig. 4. Identification of genotypic virulence clusters.
a Principal Coordinate Analysis based on the virulence gene content shown in two dimensions. Cluster color annotation has been calculated using k-means clustering. The ellipse covers 95% of the isolates in each cluster. b Heatmap of the virulence genes with the most variability (n = 45) on the y-axis and samples (n = 773) on the x-axis. All isolates were annotated based on virulence gene detection (dark) or not (light) and stratified by virulence cluster A to K (each cluster separated by a white space). Principal Coordinate Analysis (PCoA), Australia (AUS), Greece (GRE), Spain Santander (SAN), Spain Seville (SEV), Slovenia (SLO), and Sweden (SWE).
Fig. 5
Fig. 5. Relationship between bacterial genotype, multidrug resistance, and patient characteristics.
The figure is organized from left to right, starting with the number of strains in each group displayed in the first bar chart. In the subsequent graphs to the right, the proportions and the box plot are derived from these groups. a Distribution of resistance phenotypes, age, chronic lung disease, vulnerable host characteristics, and no underlying comorbidity in sequence types occurring >10 times in the cohort. b Distribution of resistance phenotypes, age, chronic lung disease, vulnerable hosts characteristics, and no underlying comorbidity in the virulence cluster. In both (a and b), Chronic lung disease was defined according to the Charlson Comorbidity Index, and vulnerable host characteristics were defined as either chemotherapy during the last 30 days, systemic corticosteroid treatment (>10 milligrams of prednisone for >29 days), neutropenia (absolute neutrophil count <0.5 × 109/liter), solid organ transplant, bone marrow transplant and/or chronic dialysis treatment. The age distribution is displayed in a box plot showing the median, interquartile range [IQR], whiskers extending 1.5 * IQR, and outliers. Multidrug-resistant (MDR), Extensively drug-resistant (XDR).
Fig. 6
Fig. 6. Association between genomic virulence markers and patient outcomes.
The sample size was n = 772 due to missing data on the department of hospitalization for 1 patient. a–c Logistic regression models fitted for virulence factors with p-value < 0.1 in the univariate analysis, epidemic clones with all other STs as reference, and virulence cluster with the largest cluster E as reference. All models were adjusted for confounders: geographical site, age group, sex, Charlson comorbidity index group, immunosuppressed state, department of hospitalization, and nosocomial infection. The dashed line marks odds ratio = 1, the circles symbolize the odds ratios for each predictor variable, and the error bars show the 95% confidence interval for each odds ratio. d The importance of specific virulence genes to predict outcomes based on the Boruta feature selection algorithm applied in the development set for each of the 1000 random splits of the data into the development and validation set. Genes selected at least one time are shown on the y-axis. The heatmap color is based on the number of times a feature was selected ranging between 1 and 1000, with lighter colors indicating lower counts and darker colors indicating higher counts. e Box plot (median, interquartile range [IQR], whiskers extending 1.5 * IQR, and outliers) of 6 random forest classifiers fitted to predict mortality or septic shock and assessed in the validation set. All models were based on different combinations of predictors. Reference model: patient characteristics alone (age, sex, comorbidity, immunosuppression, hospital department, and nosocomial infection), Model 2: combination of patient characteristics and all filtered and grouped virulence genes (n = 29), Model 3: combination of patient characteristics and epidemic clones occurring >5 times (n = 25), Model 4: combination of patient characteristics and epidemic clones occurring >10 times (n = 11), Model 5: combination of patient characteristics and virulence clusters A–K, Model 6: combination of patient characteristics and virulence genes selected by the Boruta algorithm, and Model 7: combination of patient characteristics with virulence genes and resistance genes selected by the Boruta algorithm. The plot shows the area under receiver operating characteristics (AUROC) for each of the 1000 random splits of the data into development and validation set, with a dashed line marking the median of the Reference model. f Box plot (median, IQR, whiskers extending 1.5 * IQR, and outliers) of the difference in AUROC between Models 2–7 and the Reference model for each of the 1000 splits, with a dashed line marking 0.00 difference. A positive difference occurs when the AUROC of the virulence model is greater than the Reference model. A negative difference occurs when the AUROC of the virulence model is less than the Reference model.

References

    1. Rudd, K. E. et al. Global, regional, and national sepsis incidence and mortality, 1990-2017: analysis for the Global Burden of Disease Study. Lancet395, 200–211 (2020). - PMC - PubMed
    1. Wenzel, R. P. et al. Nosocomial bloodstream infections in US hospitals: analysis of 24,179 Cases from a Prospective Nationwide Surveillance Study. Clin. Infect. Dis.39, 309–317 (2004). - PubMed
    1. Diekema, D. J. et al. The microbiology of bloodstream infection: 20-year trends from the SENTRY Antimicrobial Surveillance Program. Antimicrob. Agents Chemother.10.1128/AAC.00355-19 (2019). - PMC - PubMed
    1. Tacconelli, E. et al. Discovery, research, and development of new antibiotics: the WHO priority list of antibiotic-resistant bacteria and tuberculosis. Lancet Infect. Dis.18, 318–327 (2018). - PubMed
    1. Parkins, M. D., Gregson, D. B., Pitout, J. D. D., Ross, T. & Laupland, K. B. Population-based study of the epidemiology and the risk factors for Pseudomonas aeruginosa bloodstream infection. Infection38, 25–32 (2010). - PubMed

LinkOut - more resources