. 2025 Jan;637(8045):412-421.
doi: 10.1038/s41586-024-08291-2. Epub 2024 Dec 11.

Placenta-tropic VEGF mRNA lipid nanoparticles ameliorate murine pre-eclampsia

Affiliations

Placenta-tropic VEGF mRNA lipid nanoparticles ameliorate murine pre-eclampsia

Kelsey L Swingle et al. Nature. 2025 Jan.

Erratum in

Abstract

Pre-eclampsia is a placental disorder that affects 3-5% of all pregnancies and is a leading cause of maternal and fetal morbidity worldwide1,2. With no drug available to slow disease progression, engineering ionizable lipid nanoparticles (LNPs) for extrahepatic messenger RNA (mRNA) delivery to the placenta is an attractive therapeutic option for pre-eclampsia. Here we use high-throughput screening to evaluate a library of 98 LNP formulations in vivo and identify a placenta-tropic LNP (LNP 55) that mediates more than 100-fold greater mRNA delivery to the placenta in pregnant mice than a formulation based on the Food and Drug Administration-approved Onpattro LNP (DLin-MC3-DMA)3. We propose an endogenous targeting mechanism based on β2-glycoprotein I adsorption that enables LNP delivery to the placenta. In both inflammation- and hypoxia-induced models of pre-eclampsia, a single administration of LNP 55 encapsulating vascular endothelial growth factor (VEGF) mRNA resolves maternal hypertension until the end of gestation. In addition, with our VEGF mRNA LNP 55 therapeutic, we demonstrate improvements in fetal health and partially restore placental vasculature, the local and systemic immune landscape and serum levels of soluble Fms-like tyrosine kinase-1, a clinical biomarker of pre-eclampsia1. Together, these results demonstrate the potential of this mRNA LNP platform for treating placental disorders such as pre-eclampsia.


Conflict of interest statement

Competing interests: K.L.S., H.C.S., H.C.G. and M.J.M. have filed a patent application based on this work. M.J.M. is an inventor on a patent related to this work filed by the Trustees of the University of Pennsylvania (PCT/US20/56252). D.W. is an inventor on several patents related to this work filed by the Trustees of the University of Pennsylvania (11/990,646; 13/ 585,517; 13/839,023; 13/839,155; 14/456,302; 15/339,363; 16/299,202). The remaining authors declare no competing interests.

Figures

Extended Data Fig. 1 ∣
Extended Data Fig. 1 ∣. High-throughput in vivo evaluation of a 98 LNP library using molecular barcoding in non-pregnant and pregnant mice.
a, A large library of 98 LNP formulations was designed by synthesizing 24 unique ionizable lipid structures from 8 polyamine cores and 3 epoxide tails. 12 of these ionizable lipids were then further explored to formulate LNPs of varied excipient composition. b, Each of the 98 LNPs was formulated encapsulating a unique DNA barcode (b-DNA) to enable high-throughput, in vivo screening. The pooled LNPs were administered i.v. to non-pregnant and pregnant mice (n = 6 biological replicates) following which tissues were collected, processed, and prepared for next generation sequencing. Demultiplexing and subsequent data analysis identified a placenta-tropic LNP formulation. c, Heatmap depicting relative accumulation for each LNP/b-DNA in non-pregnant mouse tissues. Ion., ionizable; chol., cholesterol. Illustrations in b were created using BioRender (https://biorender.com).
Extended Data Fig. 2 ∣
Extended Data Fig. 2 ∣. Enrichment and correlation analysis of b-DNA LNP delivery in non-pregnant and pregnant mice.
a–c, Volcano plots depicting significantly enriched (top right quadrant) and significantly depleted (top left quadrant) LNPs compared with the liver-tropic C12-200 LNP formulation in (a) non-pregnant and (b) pregnant tissues as well as (c) placentas and fetuses. Normalized delivery is reported as the mean (n = 6 biological replicates). For each tissue, two-sided, one-way ANOVAs with post hoc Student’s t tests using the Holm-Bonferroni correction for multiple comparisons with the C12-200 LNP were used to compare normalized delivery across LNP formulations for generating p values. d–g, The squared Pearson’s correlation coefficient for mean normalized delivery (r2) was calculated for each tissue pair and is presented as a heatmap for (d) non-pregnant mouse tissues, (e) pregnant mouse tissues, (f) between non-pregnant and pregnant mouse tissues, and (g) between pregnant mouse tissues and the placentas and fetuses. Dist., distal; Prox., proximal.
Extended Data Fig. 3 ∣
Extended Data Fig. 3 ∣. Validation of results from high-throughput screening via luciferase mRNA delivery in non-pregnant mice.
LNP 6 (negative control), LNP 55 (placenta-tropic), LNP 97 (C12-200), and LNP 98 (DLin-MC3-DMA) were formulated with luciferase mRNA and administered to non-pregnant mice at a dose of 0.6 mg kg−1 mRNA. a, Six hours after administration, tissues (H: heart, Lu: lungs, Li: liver, K: kidneys, S: spleen) were dissected and imaged using an in vivo imaging system (IVIS). be, Luminescence was quantified in the (b) lungs, (c) liver, and (d) spleen which was then used to calculate (e) a spleen-to-liver ratio. Luminescence measurements are reported as the mean ± s.e.m. (n = 4 biological replicates). Ordinary two-sided, one-way ANOVAs with post hoc Student’s t tests using the Holm-Šídák correction for multiple comparisons were used to compare luminescence across treatment groups.
Extended Data Fig. 4 ∣
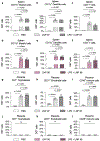
Extended Data Fig. 4 ∣. Cellular LNP delivery in the spleen and placenta for industry and clinical standard LNPs in healthy and inflammation-induced pre-eclamptic mice.
To evaluate differences in biodistribution between healthy and pre-eclamptic pregnant mice,inflammation-induced pre-eclampsia was established via i.p. administration of 1 μg kg−1 lipopolysaccharide (LPS). DiD-labelled LNPs 97 and 98 were administered at an mRNA dose of 1 mg kg-1. Twelve hours later, cellular LNP delivery was evaluated in the (a–f) spleen and (g–l) placenta via flow cytometry. The percentage of DiD+ cells is reported as the mean ± s.e.m. (PBS, LNP 97, LNP 98, LPS + LNP 98: n = 4 biological replicates; LPS + LNP 97: n = 3 biological replicates). Either ordinary (a–f) or nested (g–l) two-sided, one-way ANOVAs with post hoc Student’s t tests using the Holm-Šídák correction for multiple comparisons were used to compare the percentage of DiD+ cells across treatment groups. CK7: cytokeratin 7.
Extended Data Fig. 5 ∣
Extended Data Fig. 5 ∣. VEGF mRNA LNP 55 improves maternal weight and serum concentration of inflammatory cytokines in inflammation-induced pre-eclampsia.
Inflammation-induced pre-eclampsia was established through i.p. administration of 1 μg kg−1 lipopolysaccharide (LPS) on gestational day E7.5. 1 mg kg−1 VEGF mRNA LNP 55 was then administered i.v. on gestational day E11. ac, Change in maternal weight was measured daily (a), and on gestational day E17 (b,c) fetal and placental weight were recorded. dj, Serum levels of (d) VEGF, (e) sFlt-1, (f) alanine transaminase (ALT), (g) aspartate aminotransferase (AST), (h) tumour necrosis factor (TNF), (i) interleukin-6 (IL-6), and (j) interferon-γ (IFNγ) were evaluated on gestational days E11.5 and E17. k, Mean blood vessel area in the placental labyrinth was quantified from H&E-stainined placental sections. Maternal weight change and serum protein levels are reported as the mean ± s.e.m. (n = 8 biological replicates). Fetal and placental weight are reported as the median with the 25th and 75th percentiles (n = 8 biological replicates, 6–9 fetuses or placentas per mouse). Mean blood vessel area is reported as the median with the 25th and 75th percentiles (n = 8 biological replicates, 1–2 placentas per mouse, 2 sections per placenta, 2–3 images per section). Ordinary two-sided, two-way (a, d–j) or nested two-sided, one-way (b–c, k) ANOVAs with post hoc Student’s ttests using the Holm-Šídák correction for multiple comparisons were used to compare responses across treatment groups.
Extended Data Fig. 6 ∣
Extended Data Fig. 6 ∣. VEGF mRNA LNP 55 reduces liver enzyme levels in serum and improves placental blood vessel area in hypoxia-induced pre-eclampsia.
Hypoxia-induced pre-eclampsia was established through i.v. administration of 1 × 10⁹ plaque forming units (PFU) of soluble Fms-like tyrosine kinase-1 adenovirus (Adv-sFlt-1) on gestational day E7.5. 1 mg kg−1 VEGF mRNA LNPs 55 or 98 were then administered i.v. on gestational day E11. ad, Maternal weight change was recorded daily (a), and on gestational day E17 (b) total litter weight, (c) litter size, and (d) albumin concentration in urine were measured. ej, Serum levels of (e) VEGF, (f) alanine transaminase (ALT), (g) aspartate aminotransferase (AST), (h) tumour necrosis factor (TNF), (i) interleukin-6 (IL-6), and (j) interferon-γ (IFNγ) were evaluated on gestational days E11.5 and E17. k, Placental vasculature in the labyrinth was visualized with H&E staining; stained sections were used to quantify mean blood vessel area. l, Similarly, renal histology was visualized using H&E staining with arrows indicating glomeruli. Maternal weight change, total litter weight, litter size, urine albumin concentration, and serum protein levels are reported as the mean ± s.e.m. (Adv-sFlt-1 + VEGF mRNA LNP 55: n = 5 biological replicates; PBS, Adv-sFlt-1: n = 4 biological replicates; Adv-sFlt-1 + VEGF mRNA LNP 98: n = 3 biological replicates). Mean blood vessel area is reported as the median with the 25th and 75th percentiles (1–2 placentas per mouse, 2 sections per placenta, 2–3 images per section). Ordinary (b–d) or nested (k) two-sided, one-way ANOVAs or ordinary two-sided, two-way ANOVAs (a, e–j) with post hoc Student’s ttests using the Holm-Šídák correction for multiple comparisons were used to compare responses across treatment groups.
Extended Data Fig. 7 ∣
Extended Data Fig. 7 ∣. In inflammation-induced pre-eclampsia, VEGF mRNA LNP 55 partially restores a healthy immune landscape in the blood and placenta.
ac, Immunophenotyping was performed to evaluate differences in the proportion of immune cell populations in the (a) blood, (b) spleen, and (c) placenta in inflammation-induced pre-eclampsia following administration of the VEGF mRNA LNP 55 therapeutic. The proportion of immune cells are reported as mean ± s.e.m. (n = 8 biological replicates). Ordinary two-sided, one-way (a–b) or nested two-sided, one-way (c) ANOVAs with post hoc Student’s t tests using the Holm-Šídák correction for multiple comparisons were used to compare responses across treatment groups.
Fig. 1 ∣
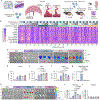
Fig. 1 ∣. High-throughput in vivo screening to identify a placenta-tropic LNP formulation for the treatment of pre-eclampsia.
a, High-throughput in vivo screening was employed to identify a placenta-tropic formulation LNP 55 from a library of 98 LNP formulations. LNP 55 was used to deliver therapeutic VEGF mRNA in inflammation- and hypoxia-induced murine models of pre-eclampsia. b, Using a high-throughput in vivo screening approach, 98 LNP formulations encapsulating a unique b-DNA cargo were pooled and administered i.v. to pregnant mice. Delivery to an assortment of tissues was evaluated using next-generation sequencing. The heatmap depicts mean relative accumulation for each LNP/b-DNA in pregnant mouse tissues, placentas and fetuses (n = 6 biological replicates). cj, LNP 6 (negative control), LNP 55 (placenta-tropic), LNP 97 (C12-200) and LNP 98 (DLin-MC3-DMA) were formulated with luciferase mRNA and administered to pregnant mice at a dose of 0.6 mg kg−1 mRNA; 6 h after administration, tissues, fetuses and placentas were dissected and imaged using IVIS (c,h). Luminescence was quantified in the lungs (d), liver (e) and spleen (f) and used to calculate a spleen-to-liver ratio (g). Luminescence was also quantified in the placentas (i) and fetuses (j). Representative images are shown from the mouse with luminescence values in the placenta closest to the mean for each treatment group. Luminescence measurements are reported as the mean ± s.e.m. (n = 4 biological replicates). Either ordinary (dg) or nested (ij) two-sided, one-way ANOVAs with post hoc Student’s t-tests using the Holm–Šídák correction for multiple comparisons were used to compare luminescence across treatment groups. Dist., distal; F, fetuses; H, heart; K, kidneys; Li, liver; Lum., luminescence; Lu, lungs; P, placentas; Prox., proximal; S, spleen. Illustrations in a were created using BioRender (https://biorender.com).
Fig. 2 ∣
Fig. 2 ∣. A potential protein-adsorption-based endogenous targeting mechanism for LNP delivery to the placenta.
af, LNPs were precoated with either β2-GPI (a,d,f) or ApoE (b,c,e) and used to treat liver Hep G2 (ac) and placenta BeWo b30 cells (df). In a, b, d and e, luciferase expression was used to evaluate mRNA expression, whereas in c and f, confocal microscopy and flow cytometry were used to evaluate intracellular uptake of DiD-labelled LNPs. Normalized luciferase expression is reported as mean ± s.e.m. (n = 5 biological replicates with 3–6 technical replicates each). Nested two-sided, one-way ANOVAs with post hoc Student’s t-tests using the Holm–Šídák correction for multiple comparisons were used to compare normalized luciferase expression across treatment groups. Representative histograms are shown from the technical replicate with the percentage of DiD+ cells closest to the mean for each treatment group. gj, To evaluate the effects of in vivo β2-GPI knockdown on LNP mRNA delivery, 72 h before LNP administration, pregnant mice were treated with 1 mg kg−1 β2-GPI siRNA. Pregnant mice were treated with luciferase mRNA LNPs 55 (g,i) or 98 (h,j) at a dose of 0.6 mg kg−1 mRNA. Six hours later, tissues were dissected and imaged using IVIS. Luminescence was quantified in the liver (g,h) and placentas (i,j). Luminescence is reported as the mean ± s.e.m. (LNP 55, β2-GPI siRNA + LNP 55, LNP 98: n = 4 biological replicates; β2-GPI siRNA + LNP 98: n = 3 biological replicates). Representative images are shown from the mouse with luminescence values in the placenta closest to the mean for each treatment group. Either ordinary (g,h) or nested (i,j) unpaired, two-tailed Student’s t-tests were used to compare luminescence across treatment groups. Lum., luminescence; Norm., normalized. Scale bars, 50 μm (insets, 10 μm).
Fig. 3 ∣
Fig. 3 ∣. Inflammation-induced pre-eclampsia increases LNP 55 delivery to placental immune cells while decreasing off-target delivery to splenic T cells.
ad, To evaluate differences in biodistribution and mRNA transfection between healthy and pre-eclamptic pregnant mice, an early-onset model of pre-eclampsia was induced through i.p. administration of 1 μg kg−1 LPS. LNP 55 was formulated with luciferase mRNA, labelled with DiD fluorescent dye and administered at a dose of 1 mg kg−1 mRNA. Twelve hours later, tissues (a,b), placentas and fetuses (c,d) were dissected, and fluorescence (a,c) and luminescence (b,d) imaging was performed. Representative images are shown from the mouse with fluorescence or luminescence values in the placenta (c,d) closest to the mean for each treatment group. el, Cellular LNP delivery was evaluated in splenic myeloid cells (e), dendritic cells (f), and T cells (g) as well as placental trophoblasts (h), endothelial cells (i), and immune cells (j) by flow cytometry. The percentage of DiD+ cells is reported as the mean ± s.e.m. (n = 4 biological replicates). Representative histograms for splenic CD3+ T cells (g) and placental CD45+ immune cells (j) are shown from samples with the percentage of DiD+ cells closest to the mean for each treatment group. Immunofluorescence staining of placental sections for pan-trophoblast marker cytokeratin 7 (CK7) (k) and an endothelial cell marker (endomucin) (l) demonstrated colocalization of placental cells and DiD-labelled LNPs. Either ordinary (eg) or nested (hj) two-sided, one-way ANOVAs with post hoc Student’s t-tests using the Holm–Šídák correction for multiple comparisons were used to compare the percentages of DiD+ cells across treatment groups. Scale bars, 50 μm.
Fig. 4 ∣
Fig. 4 ∣. VEGF mRNA LNP 55 alleviates maternal hypertension in inflammation- and hypoxia-induced models of pre-eclampsia.
a, Inflammation-induced pre-eclampsia was established through i.p. administration of 1 μg kg−1 LPS, whereas hypoxia-induced pre-eclampsia was established through i.v. administration of 1 × 10⁹ PFU of Adv-sFlt-1 on gestational day E7.5. Then, VEGF mRNA LNP 55 or LNP 98 was administered i.v. on gestational day E11 at an mRNA dose of 1 mg kg−1. b,g, In both inflammation-induced (b) and hypoxia-induced (g) pre-eclampsia, maternal blood pressure (BP) was recorded daily, and on gestational day E17, litter size (d), total litter weight (e), fetal weight (i) and placental weight (j) were recorded. In c and h, representative fetus images are shown from the mouse with the total litter weight or fetal weight measurements closest to the mean for each treatment group. f, Placental vasculature in the labyrinth was visualized with H&E staining. k, Serum levels of sFlt-1 were evaluated on gestational days E11.5 and E17. For the inflammation-induced model of pre-eclampsia, mean BP, litter size and total litter weight are reported as mean ± s.e.m. (n = 8 biological replicates). For the hypoxia-induced model of pre-eclampsia, mean BP and serum levels of sFlt-1 are reported as mean ± s.e.m. (Adv-sFlt-1 + VEGF mRNA LNP 55: n = 5 biological replicates; PBS, Adv-sFlt-1: n = 4 biological replicates; Adv-sFlt-1 + VEGF mRNA LNP 98: n = 3 biological replicates). Fetal and placental weights are reported as medians with 25th and 75th percentiles (2–12 fetuses or placentas per mouse). Ordinary (d,e) or nested (i,j) two-sided, one-way ANOVAs or ordinary two-sided, two-way ANOVAs (b,g,k) with post hoc Student’s t-tests using the Holm–Šídák correction for multiple comparisons were used to compare responses across treatment groups. Scale bars, 100 μm. The illustration of mice and syringes in a was created using Microsoft PowerPoint stock icons.

Comment in

References

    1. Chappell LC, Cluver CA, Kingdom J & Tong S. Pre-eclampsia. Lancet 398, 341–354 (2021). - PubMed
    1. Swingle KL, Ricciardi AS, Peranteau WH & Mitchell MJ Delivery technologies for women’s health applications. Nat. Rev. Bioeng 1, 408–425 (2023).
    1. Adams D. et al. Patisiran, an RNAi therapeutic, for hereditary transthyretin amyloidosis. New Engl. J. Med 379, 11–21 (2018). - PubMed
    1. Geisler HC, Safford HC & Mitchell MJ Rational design of nanomedicine for placental disorders: birthing a new era in women’s reproductive health. Small 20, 2300852 (2023). - PMC - PubMed
    1. Gilbert JS et al. Recombinant vascular endothelial growth factor 121 infusion lowers blood pressure and improves renal function in rats with placentalischemia-induced hypertension. Hypertension 55, 380–385 (2010). - PMC - PubMed

MeSH terms

LinkOut - more resources