. 2025 Jan;637(8047):930-939.
doi: 10.1038/s41586-024-08314-y. Epub 2024 Dec 11.

Central control of dynamic gene circuits governs T cell rest and activation

Affiliations

Central control of dynamic gene circuits governs T cell rest and activation

Maya M Arce et al. Nature. 2025 Jan.

Abstract

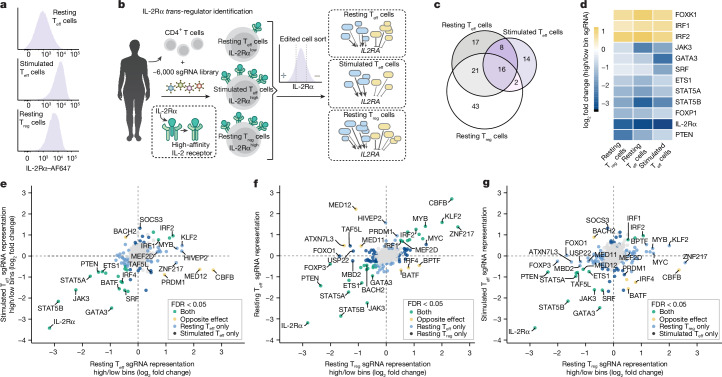
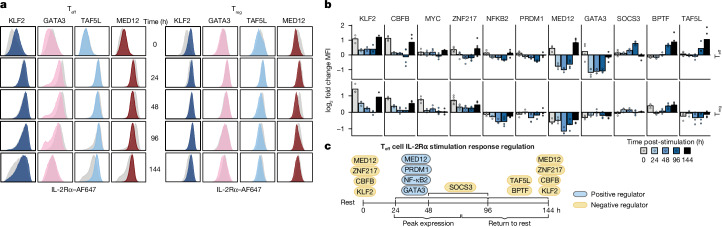
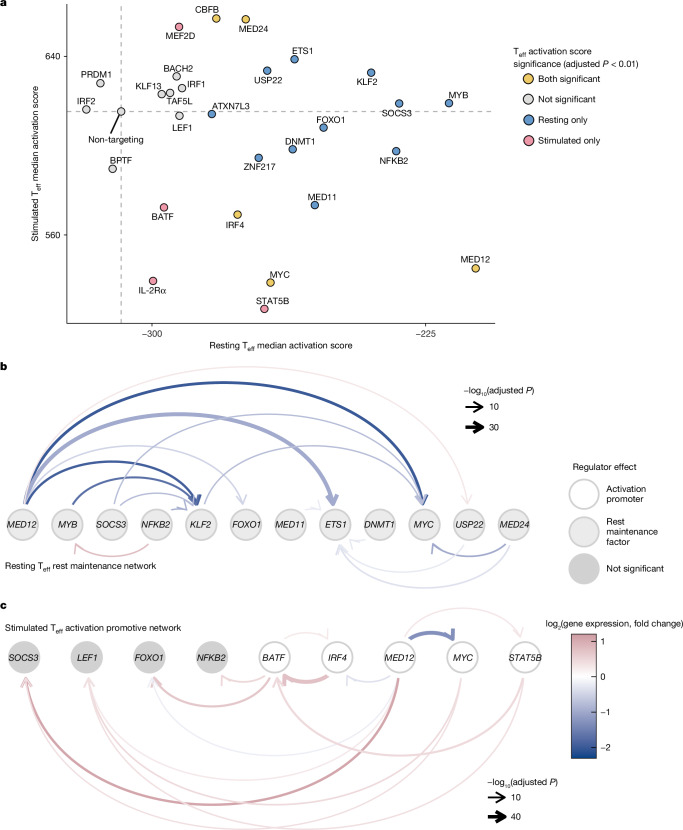
The ability of cells to maintain distinct identities and respond to transient environmental signals requires tightly controlled regulation of gene networks1-3. These dynamic regulatory circuits that respond to extracellular cues in primary human cells remain poorly defined. The need for context-dependent regulation is prominent in T cells, where distinct lineages must respond to diverse signals to mount effective immune responses and maintain homeostasis4-8. Here we performed CRISPR screens in multiple primary human CD4+ T cell contexts to identify regulators that control expression of IL-2Rα, a canonical marker of T cell activation transiently expressed by pro-inflammatory effector T cells and constitutively expressed by anti-inflammatory regulatory T cells where it is required for fitness9-11. Approximately 90% of identified regulators of IL-2Rα had effects that varied across cell types and/or stimulation states, including a subset that even had opposite effects across conditions. Using single-cell transcriptomics after pooled perturbation of context-specific screen hits, we characterized specific factors as regulators of overall rest or activation and constructed state-specific regulatory networks. MED12 - a component of the Mediator complex - serves as a dynamic orchestrator of key regulators, controlling expression of distinct sets of regulators in different T cell contexts. Immunoprecipitation-mass spectrometry revealed that MED12 interacts with the histone methylating COMPASS complex. MED12 was required for histone methylation and expression of genes encoding key context-specific regulators, including the rest maintenance factor KLF2 and the versatile regulator MYC. CRISPR ablation of MED12 blunted the cell-state transitions between rest and activation and protected from activation-induced cell death. Overall, this work leverages CRISPR screens performed across conditions to define dynamic gene circuits required to establish resting and activated T cell states.


Conflict of interest statement

Competing interests: A.M. is a cofounder of Site Tx, Arsenal Biosciences, Spotlight Therapeutics and Survey Genomics; serves on the boards of directors at Site Tx, Spotlight Therapeutics and Survey Genomics; is a member of the scientific advisory boards of Site Tx, Arsenal Biosciences, Cellanome, Spotlight Therapeutics, Survey Genomics, NewLimit, Amgen and Tenaya; owns stock in Arsenal Biosciences, Site Tx, Cellanome, Spotlight Therapeutics, NewLimit, Survey Genomics, Tenaya and Lightcast; has received fees from Site Tx, Arsenal Biosciences, Cellanome, Spotlight Therapeutics, NewLimit, Gilead, Pfizer, 23andMe, PACT Pharma, Juno Therapeutics, Tenaya, Lightcast, Trizell, Vertex, Merck, Amgen, Genentech, GLG, ClearView Healthcare, AlphaSights, Rupert Case Management, Bernstein and ALDA; is an investor in and informal advisor to Offline Ventures; and a client of EPIQ. The Marson laboratory has received research support from the Parker Institute for Cancer Immunotherapy, the Emerson Collective, Arc Institute, Juno Therapeutics, Epinomics, Sanofi, GlaxoSmithKline, Gilead and Anthem and reagents from Genscript and Illumina. The Krogan Laboratory has received research support from Vir Biotechnology, F. Hoffmann-La Roche and Rezo Therapeutics. N.J.K. has a financially compensated consulting agreement with Maze Therapeutics. N.J.K. is the President and on the Board of Directors of Rezo Therapeutics; and is a shareholder in Tenaya Therapeutics, Maze Therapeutics, Rezo Therapeutics, GEn1E Lifesciences and Interline Therapeutics. J.W.F. was a consultant for NewLimit; is an employee of Genentech; and has equity in Roche. A.T.S. is a founder of Immunai, Cartography Biosciences, Santa Ana Bio and Prox Biosciences; is an advisor to Zafrens and Wing Venture Capital; and receives research funding from Astellas and Merck Research Laboratories. Patent applications have been filed based on the findings described here. The other authors declare no competing interests.

Figures

Fig. 1
Fig. 1. Identification of context-dependent regulators of IL-2Rα expression.
a, IL-2Rα surface expression levels by flow cytometry. b, Schematic of the context-specific trans-regulatory CRISPR screens. Schematic includes content from S. Pyle and BioRender (https://biorender.com). c, Venn diagram of regulators identified across screen conditions. d, Consistent regulators of IL-2Rα identified as significant in the same direction across all three screens (FDR < 0.05; n = 2 donors for the Treg screen, n = 3 donors for the resting Teff screen and n = 3 donors for the stimulated Teff screen). eg, Comparisons of IL-2Rα screen results (resting versus stimulated Teff IL-2Rα screens (e), resting Treg versus resting Teff IL-2Rα screens (f) and resting Treg versus stimulated Teff IL-2Rα screens (g)) coloured by significance and direction of effect in both screens (significant denotes FDR < 0.05; n = 2 donors for the Treg screen, n = 3 donors for the resting Teff screen and n = 3 donors for the stimulated Teff screen).
Fig. 2
Fig. 2. Temporal regulation of IL-2Rα following stimulation by distinct factors.
a, Representative flow cytometry histograms of IL-2Rα expression after arrayed knockout. AAVS1 safe harbour control knockout results are shown in grey, and the y axis is normalized to the mode. Timepoints represent time after restimulation starting with 0 h (no restimulation). b, Quantification of the knockout effect on IL-2Rα expression across stimulation timepoints for select regulators. log2 Fold change IL-2Rα median fluorescent intensity (MFI) calculated for knockout compared with AAVS1-knockout control samples from the same donor. Each point represents a donor and sgRNA combination (n = 2 donors × 2 sgRNAs per knockout, except KLF2 knockout where n = 3 and ZNF217 knockout where n = 6). c, Schematic of select IL-2Rα regulators that enable temporal control of IL-2Rα in Teff cells. The schematic was created using BioRender (https://biorender.com). Source Data
Fig. 3
Fig. 3. Perturb-seq reveals regulator networks controlling T cell rest and activation.
a, Activation scores computed for each perturbed gene based on single-cell gene signatures across resting and stimulated states. Each point represents the median activation score of cells targeted for CRISPRi knockdown of the indicated gene. The grey dashed lines indicate the activation scores for non-targeting control cells. The coloured dots indicate perturbation with activation scores significantly different compared with control cells for each condition, determined by a two-sided Wilcoxon rank-sum test with continuity correction (adjusted P < 0.01). b,c, Regulatory network of factors controlling rest (b) and activation (c). Differentially expressed genes resulting from a perturbation (identified by pseudo-bulking knockdown versus non-targeting cells) are represented as arrows from the perturbed gene (Wald test with Benjamini–Hochberg multiple test correction, adjusted P < 0.05 threshold; n = 2 donors per target gene). The light grey nodes indicate rest maintenance factors in resting Teff cells. The white nodes indicate activation-promoting factors in stimulated Teff cells. The dark grey nodes indicate regulators without significant effects on activation scores in stimulated Teff cells (categorization from panel a). Source Data
Fig. 4
Fig. 4. MED12 coordinates expression of IL-2Rα regulators across CD4+ T cell conditions.
a, Genes differentially expressed in MED12-knockout samples compared with control AAVS1-knockout samples (Wald test with Benjamini–Hochberg multiple test correction, adjusted P < 0.05; n = 3 donors per knockout) are grouped according to their stimulation-responsive behaviour in AAVS1-knockout control cells. The Bonferroni-adjusted P value resulting from a two-tailed t-test is displayed comparing each stimulation-responsive group to the non-stimulation-responsive group (Methods). Box plot centre line denotes the median; box limits indicate upper and lower quartiles; and whiskers denote 1.5× interquartile range. b, Proportions of IL-2Rα regulators versus non-regulators (NSs) whose expression levels are affected by MED12 knockout (KO). One-sided Fisher’s exact test for regulators of IL-2Rα downstream of MED12 (Methods) was used. c, Heatmap of IL-2Rα regulators differentially expressed between MED12-knockout cells and control cells (as described in a). Gene annotation boxes represent the result of the IL-2Rα screens (FDR < 0.05; navy denotes a positive regulator of IL-2Rα, and gold represents a negative regulator of IL-2Rα). d, Directed network plots depicting select trans-regulators downstream of MED12. The solid lines depict effects of MED12-knockout based on significant gene expression changes as described in a, and the dashed lines represent effects on IL-2Rα based on the screen results as described in Fig. 1e–g. e, Comparison of transcriptional effects of MED12 ablation versus ablation of the core Mediator subunit MED11. Each point represents the effect on genes significantly differentially expressed in both knockouts, as described in a. Linear regression equation and Pearson coefficient are provided for each condition. Source Data
Fig. 5
Fig. 5. MED12 shapes chromatin landscapes to promote cell-type-specific and stimulation-specific regulation.
a, Proteins enriched in CD4+ Teff MED12 IP-MS with more than 100-fold enrichment relative to IgG control in one or more conditions (Bayesian FDR ≤ 0.05; n = 3 donors). The pink lines indicate enrichment in immunoprecipitation, and the grey lines are reported physical interactions in the STRING database. b, Gene loci with H3K4me3 altered by MED12-knockout relative to AAVS1-knockout control Teff cells determined by CUT&RUN (n = 3 donors per condition). Significant regions intersecting MED12 high-confidence ChIP–seq peaks (Methods; n = 2 donors per condition) are coloured in red with select genes labelled. c, KLF2 and MYC loci depicting differential H3K4me3 and RNA polymerase (Pol) II C-terminal domain (CTD) occupancy between the MED12-knockout (purple and turquoise) and AAVS1-knockout (grey) conditions from a representative donor. The light grey boxes indicate the region of differential H3K4me3 between the MED12 knockout and AAVS1 knockout (adjusted P < 0.05; n = 3 donors). The coloured boxes indicate CXXC1 peaks and MED12 high-confidence peaks in AAVS1-knockout Teff cells (n = 2 donors). d, Differentially expressed genes (DEGs) downstream of MED12 and KLF2 in resting CD4+ Teff cells as described in Fig. 4c. KLF2-regulated genes are from Freimer et al. (adjusted P). e, Gene set enrichment analysis with Benjamini–Hochberg multiple test correction depicting significantly reduced enrichment of MYC signature genes (MYC_UP.V1_UP from msigdb) in MED12-knockout cells versus AAVS1-knockout control cells. Source Data
Fig. 6
Fig. 6. MED12 ablation limits activation-induced T cell apoptosis.
a, Total cell abundance for each gene knockdown within the indicated Perturb-seq pool of single cells normalized using the sgRNA distribution in the plasmid library and represented as the log2 fold change compared with non-targeting cells (dashed line). b, Percentage of apoptotic cells and live Teff cell count following various dosages of anti-CD3–CD28–CD2 stimulation reported relative to the manufacturer recommended dose. Two-tailed t-test comparing groups (n = 4 donors × 2 sgRNAs per target gene; for apoptosis, dose 0: P = 0.56, 0.1: ***P = 0.00087, 0.25: **P = 0.0011, 1: **P = 0.003 and 2.5: ***P = 0.00032; for live counts, dose 0: P = 0.68, 0.1: P = 0.14, 0.25: **P = 0.0026, 1: *P = 0.036 and 2.5: **P = 0.0017). c, Model of core regulatory networks controlling T cell rest and activation, both coordinated by MED12. The solid lines indicate regulatory effects on other factors, the dashed lines represent effects on overall states, and the solid black lines indicate potential direct regulation by MED12 as supported by ChIP–seq data. d, Phenotypic effects of MED12 ablation in CD4+ Teff cells. Dashed lines represent the effects on overall states. Schematics in panels c,d were created using BioRender (https://biorender.com). Source Data
Extended Data Fig. 1
Extended Data Fig. 1. Pooled KO screens across cell states and lineages reveal context-specific regulators.
a. Kinetics of IL-2Rα expression in Teffs and Tregs following restimulation. Representative histograms of IL-2Rα expression assessed via flow cytometry adjusted to the mode of each sample. b. Donor-to-donor correlations for all screening conditions (FDR < 0.05; Treg screen: n = 2, Teff screen: n = 3, Stimulated Teff screen: n = 3 donors). c. Comparison of resting IL-2Rα screen results between Freimer et al. and new screen data. Non-significant genes are shown in grey and significant hits (FDR < 0.05) colored by direction of effect in both screens. d. Comparison of IL-2Rα screen results for IL-2Rα KO and GATA3 KO sgRNAs. Each dot represents an individual sgRNA average effect for the respective gene KO (Treg screen: n = 2, Teff screen: n = 3, Stimulated Teff screen: n = 3 donors). e. Heatmap showing expression of genes encoding screen hits. Transcript levels were assessed in AAVS1 KO control cells by bulk RNAseq. The color bar represents the log10(mean normalized counts) for the gene expression level of each IL-2Rα regulator across each cell type and stimulation condition (n = 3 donors). The annotation bars on the top illustrate the direction of effect for each regulator in the three IL-2Rα screens (colored boxes = FDR < 0.05, navy = positive regulator of IL-2Rα and gold = negative regulator of IL-2Rα). Source Data
Extended Data Fig. 2
Extended Data Fig. 2. Cell type- and stimulation-specific regulators of IL-2Rα control dynamic gene expression.
a. Volcano plot of screen results for regulators of IL-2Rα in resting primary human Tregs. Significant hits (FDR < 0.05, n = 2 donors) colored by direction of effect. b. Validation of select Treg screen hits using arrayed KO and flow cytometry. IL-2Rα expression displayed as the mean log2 fold change median fluorescent intensity (MFI) of the perturbed samples compared to control AAVS1 KO control samples vs. the log2 fold change IL-2Rα Treg screen effect (flow cytometry n = 4 donors; Treg screen n = 2 donors). c. Flow cytometry gating strategy for IL-2Rα expression in arrayed assays displayed as contour plots with outliers. d. Amplicon-seq genotyping of arrayed validation KOs to confirm editing. The mean percent modified (edited) reads as quantified by NGS is shown on the y axis for each of the targeted genes (Teff genotyping n = 3, Treg genotyping n = 2 donors). e. Select regulators of IL-2Rα demonstrate cell type-specific effects. Regulators from arrayed KO in b selected for visualization based on apparent cell type differential effect and membership to Mediator or SAGA. IL-2Rα surface expression displayed as the log2 fold change median fluorescent intensity (MFI) of the perturbed samples compared to control AAVS1 KO sample from the same donor (Teffs: n = 3 donors, Tregs: n = 4 donors). f. Schematic of IL-2Rα screen hits with cell type-differential regulatory roles. The schematic was created using BioRender (https://biorender.com). g. Intracellular CTLA-4 expression is affected by perturbation of stimulation-responsive regulators of IL-2Rα. Data displayed as described in e., but for CTLA-4 expression. (n = 2 donors x 2 sgRNAs per KO except KLF2 KO where n = 3 and ZNF217 KO where n = 6) ZNF217 KO and AAVS1 KO data of CTLA-4 for time 0 Tregs was published in Mowery et al.. Gating strategy is as displayed in c. Source Data
Extended Data Fig. 3
Extended Data Fig. 3. MED12 controls expression of stimulation-responsive genes in Tregs and Teffs.
a. Differential gene expression results for CRISPRi targeted genes using pseudobulked Perturb-seq counts relative to non-targeting control cells (Wald test with BH multiple test correction, padj <0.05, n = 2 donors). b-c. Differentially expressed cell surface proteins from pseudobulked Perturb-CITE-seq samples (Wald test with Benjamini-Hochberg (BH) multiple test correction, padj <0.05, n = 2 donors). d. Activation scores for each perturbed gene computed based on single cell gene signatures. Each point represents the median activation score of cells targeted for CRISPRi knock-down of the indicated gene in Tregs. Dashed grey lines indicate the activation score for non-targeting control cells within each respective condition; colored points indicate perturbation with activation scores significantly different than control cells for each condition as determined by a two-sided Wilcoxon rank sum test with continuity correction (padj <0.01). e. Regulatory network of factors controlling rest and activation in Tregs. Differentially expressed genes resulting from a perturbation (identified by pseudo-bulking knock-down vs. non-targeting cells) are represented as arrows from the perturbed gene (padj <0.05, n = 2 donors per target gene). Light grey nodes indicate rest maintenance factors in resting Tregs, dark grey nodes indicate regulators without significantly different activation scores in the respective condition, and white nodes indicate activation promoting regulators in stimulated Tregs f. Log2 fold change of differentially expressed genes in MED12 KO vs AAVS1 KO bulk RNAseq samples (padj <0.05 as described in 4a) compared to the log2 fold change of differentially expressed genes between stimulated and resting control AAVS1 KO cells (Wald test with Benjamini-Hochberg (BH) multiple test correction, padj <0.05, n = 3 donors). Two-sided binomial test results are displayed comparing the proportion of genes downstream of MED12 that are concordant in direction with stimulation-responsive genes to genes discordant in direction. Source Data
Extended Data Fig. 4
Extended Data Fig. 4. MED12 is required for distinct functional features in specific CD4 + T cell subsets.
a. Flow gating strategy for suppression assays. b. In vitro Treg suppression assays showing absolute proliferative Teff count and percent suppression by Tregs (Methods). Unedited (wild type) CD4+ Teffs were used in the assay with MED12 KO Tregs or AAVS1 KO control Tregs. Paired two-tailed T test comparing MED12 KO and AAVS1 KO control samples (n = 4 donors per KO; Teff count: Ratio 2:1 p = 0.11, 1:1 p = 0.067, 1:2 p = 0.023, 1:4 p = 0.12, 1:8 p = 0.15; Suppression: Ratio 2:1 p = 0.067, 1:1 p = 0.061, 1:2 p = 0.045, 1:4 p = 0.24, 1:8 p = 0.14). c. Gene expression of selected genes associated with indicated cell identities. Color indicates the log2 fold change of differentially expressed genes in bulk RNAseq (Wald test with BH multiple test correction, padj <0.05, n = 3 donors) comparing stimulated MED12 KO to AAVS1 KO control samples. Data are shown in Teffs (left) and Tregs (right). d. Cytokine expression measured by Luminex. Heatmaps represent the log2 fold change cytokine concentration in the MED12 KO sample supernatant relative to AAVS1 KO control supernatant. Teff heatmap values display the average concentration of 2 sgRNAs per gene KO (n = 4 donors per cell type x 2 sgRNA for Teff or 1 sgRNA for Tregs). e. Cytokine concentrations as represented in d for select cytokines. Two-tailed T test comparing MED12 KO and AAVS1 KO samples (paired for Tregs only) (n = 4 donors x 2 sgRNAs per KO (Teff only); Teff cytokines: IL-13: p = 0.054, IL-4: p = 0.025, IL-5: p = 0.0099, IL-8: p = 0.0095, CXCL10 (IP-10): p = 0.00072, CXCL9: p = 0.0096; Treg cytokines: IL-10: p = 0.043, TGF-β1: p = 0.54, TGF-β2: p = 0.84, TGF-β3: p = 0.19). Source Data
Extended Data Fig. 5
Extended Data Fig. 5. Partially-shared transcriptional effects of MED12 and other Mediator subunits.
a. Comparison of the transcriptional effects of MED12 KO compared to KO of Mediator subunits MED14 (middle/backbone), MED31 (middle), MED24 (tail), MED30 (tail) as described in Fig. 4e. b. Regulators of IL-2Rα in the network downstream of several Mediator complex subunits. Differentially expressed genes as assessed by bulk RNAseq are displayed as the log2 fold change gene expression in the subunit KO/AAVS1 KO samples for the respective condition (Wald test with Benjamini-Hochberg (BH) multiple test correction, padj <0.05, n = 3 donors per KO). The horizontal annotation bars on the top of the figure represent the stimulation condition (dark grey for resting and light for restimulated) and the vertical annotation bars represent the effect of the regulator in the IL-2Rα screens (colored boxes = statistically significant FDR < 0.05, navy = positive regulator of IL-2Rα and gold = negative regulator of IL-2Rα). Source Data
Extended Data Fig. 6
Extended Data Fig. 6. Mediator and SAGA complexes shape context-dependent regulation of IL-2Rα.
a. Mediator complex subunit KO effects on expression of IL-2Rα as quantified by flow cytometry across contexts. Each color represents a Mediator complex structural module (n = 3 donors for Teffs and 2 donors for Tregs x 1 sgRNA per condition). b. Amplicon-seq genotyping of arrayed validation KOs to confirm editing. The mean percent modified (edited) reads as quantified by NGS is depicted for each of the targeted genes (Teff genotyping n = 3 donors, Tregs genotyping n = 2 donors). c. Select regulators of IL-2Rα affect H3K27ac distribution in CD4 + T cells. The number of differentially H3K27 acetylated regions in each KO cell population compared to control AAVS1 KO cells is displayed on the y axis (Two-tailed Wald test with BH multiple test correction, padj <0.05, n = 2 donors per KO). The direction in which H3K27ac was altered is depicted as the color of the bar. d. Trackplot of the IL2RA locus depicting regions of differential acetylation between the MED12 KO (solid color) and AAVS1 control KO (grey transparent) conditions from a representative donor. Light grey boxes distinguish regions of significantly differential acetylation between the MED12 KO and the AAVS1 KO (Two-tailed Wald test with BH multiple test correction, padj <0.05, n = 2 donors per KO). IL2RA CaRE enhancer elements are annotated in grey boxes below gene tracks. STAT5A ChIP data sourced from public data (Methods). e. Venn diagram depicting differentially acetylated regions (relative to AAVS1 KO control cells) for MED12, TAF5L, and MED11 KO samples. Differentially acetylated regions determined as described in c. f. Histogram depicting the distribution of differentially acetylated regions based on distance to the transcription start site of the nearest gene. The peak height is the proportional to the number of differentially acetylated regions across the samples. g. Correlation of TAF5L and MED12 differentially acetylated regions. Regions as described in c. depicted as the log2 fold change acetylation for the respective perturbations. h. Trackplot of H3K27ac as described in d for TAF5L KO instead of MED12 KO. Source Data
Extended Data Fig. 7
Extended Data Fig. 7. SETD1A/COMPASS complex members are enriched within an extensive MED12 protein interaction network within CD4+ Teffs.
a. MED12 interaction partners in CD4+ Teffs. Proteins enriched in MED12 immunoprecipitation mass spectrometry (IP-MS) relative to IgG control (BFDR < = 0.05, n = 3 donors). Pink lines indicate enrichment in immunoprecipitation and grey lines are derived from reported physical interactions in STRING database. b. Proteins from a. plotted by log2 fold change enrichment demonstrate high representation of SETD1A/COMPASS members. c. Western blot confirmation of MED12 protein loss with MED12 KO sgRNA s2770 targeting MED12 using antibody clone D9K5J used in IP experiments. Two donors were processed in one experiment. For gel source data, see Supplementary Fig. 1. d. MED12 IP validation of select interactors by western blot. Western blot of IgG and MED12 IP samples demonstrating interaction between MED12 and SETD1A, CXXC1, and MED17 in resting and stimulated Teffs in two human donors. For gel source data, see Supplementary Fig. 1.
Extended Data Fig. 8
Extended Data Fig. 8. MED12 ablation disrupts chromatin at loci encoding regulators of rest and activation.
a. Sites of H3K4me2/1 altered by MED12 KO relative to AAVS1 KO Teffs (n = 3 donors per condition) determined by CUT&RUN. Significant regions intersecting high-confidence MED12 peaks, assessed by ChIP-seq (Methods, n = 2 donors per condition), are colored in red with select genes labeled. b. Correlation between genes with differential H3K4me3 and transcript expression comparing MED12 KO to AAVS1 KO Teffs. c. Genes differentially expressed in MED12 KO relative to AAVS1 KO (n = 3 donors per condition) colored as in a. d. Intersection of MED12 high-confidence peaks and CXXC1 peaks (left plot) and MED12 high-confidence bound genes and CXXC1 bound genes (middle plot) in resting Teffs. Intersection of MED12 high-confidence peaks between resting and stimulated states (right plot, n = 2 donors per condition). e. Genes differentially expressed in MED12 KO relative to AAVS1 KO Teffs. CXXC1 bound genes determined by ChIP-seq (Methods, n = 2 donors per condition) are colored in dark blue with select genes labeled. f. Trackplots of ETS1 and GATA3 loci depicting differential H3K4me3 and RNA Pol II CTD occupancy between the MED12 KO (purple and turquoise) and AAVS1 KO control (grey) conditions from a representative donor. Light grey boxes define significantly differential H3K4me3 peaks comparing MED12 KO and AAVS1 KO control (padj <0.05, n = 3 donors). Colored boxes indicate CXXC1 peaks and MED12 high-confidence peaks (padj <0.05, n = 2 donors, Methods). g. CXXC1 binding distribution at expressed genes in CD4+ Teffs determined via ChIP-seq. h. Trackplots of KLF2 and SOC3 loci depicting regions of differential H3K27ac between the MED12 KO (solid color tracks) and AAVS1 control KO (grey transparent tracks) conditions from a representative donor. Light grey boxes distinguish regions of significantly differential acetylation between the MED12 KO and the AAVS1 KO control (padj <0.05, n = 2 donors). Source Data
Extended Data Fig. 9
Extended Data Fig. 9. MED12 ablation results in widespread changes in polymerase pausing.
a. Mean Pausing Index (left) and polymerase abundance at the TSS’s depicted for all genes expressed in Teffs (n = 2 donors per condition). Boxplots are separated by presence or absence of MED12 high-confidence peak(s) at the loci. Boxplot center line, median; box limits, upper and lower quartiles; whiskers, 1.5x interquartile range. b. Empirical cumulative distribution function plot displaying the mean pausing index for all genes expressed in Teffs (n = 2 donors per condition, left). RNA Pol CTD distribution across genes (right). c. Teff ChIP-seq binding distributions across genes expressed in Teffs (n = 2 donors per condition). d. Trackplot of the IL2RA locus depicting differences in occupancy of RNA Polymerase II CTD and NELFA in MED12 KO (turquoise and gold) and AAVS1 control KO (grey tracks) conditions from a representative donor. Colored boxes indicate CXXC1 (blue) peaks and MED12 high-confidence peaks (red, Methods). e. IL-2Rα expression of CRISPR perturbed or kinase inhibitor (SEL120-34A) treated samples. Statistics performed using a paired two-tailed T test (MED12 KO: n = 4 donors, SEL120-34A: n = 7 donors all timepoints except T144 where n = 4 donors and T48 where n = 6 donors for SEL120-34A assay; MED12 KO assay: 0 hrs: p = 0.015, 24 hrs: p = 0.00013, 48 hrs: p = 0.025, 96 hrs: p = 0.75, 144 hrs: p = 0.02; SEL120-34A assay: 0 hrs: p = 0.045, 24 hrs: p = 0.002, 48 hrs: p = 0.0015, 96 hrs: p = 0.024, 144 hrs: p = 0.052). f. Representative flow plots from e. g. Stimulation responsive histone methylation shared between AAVS1 KO control cells and vehicle-treated control cells. Top plot compares significantly differentially methylated sites in AAVS1 KO resting vs stimulated Teffs (x axis) and vehicle (H2O)-treated resting vs stimulated Teffs (y axis). Euler plots below depict the overlap of all differentially methylated stimulation responsive sites displayed in the scatter plot (padj <0.05 significance threshold, n = 3 donors per condition). h. Top plot compares significantly differentially methylated sites in MED12 vs AAVS1 KO Teffs (x axis) and SEL120-34A vs vehicle (H2O)-treated Teffs (y axis). Euler plots below depict the overlap of all differentially histone methylated sites displayed in scatter plot (padj <0.05, n = 3 donors per condition). Source Data
Extended Data Fig. 10
Extended Data Fig. 10. Activation-induced cell death pathways are dysregulated in MED12 KO T cells.
a. MED12 KO CAR-T gene expression activation scores based on gene expression signature analysis of RNAseq data from Freitas et al. (GEO series GSE174279). The GSVA activation score for each group of samples is compared using a two-tailed T test and the Bonferroni adjusted p value displayed for significantly different groups. Boxplot center line, median; box limits, upper and lower quartiles; whiskers, 1.5x interquartile range (n = 3 donors per KO). b. Rank plot of cell abundance within the Perturb-seq single cell pools for each CRISPRi gene target for resting and stimulated Tregs. Cell abundance normalized by the sgRNA distribution in the plasmid library and represented as the log2 fold change compared to non-targeting control cells. The dashed line indicates the abundance of non-targeting control cells. c. Proliferative cell ratios assessed by gene signature of cycling cells within each CRISPRi regulator knockdown condition in the Perturb-seq pool. The estimated ratio of G2M/G1 cells within each condition is represented on the x axis. * Used to denote MED12. d. Differentially expressed genes (padj <0.05) from stimulated Teff MED12 KO vs AAVS1 KO control cell bulk RNAseq data are illustrated on a schematic of the Apoptosis-Homo sapiens pathway from WikiPathways. e. Top pathways affected by MED12 KO in bulk RNAseq data. Apoptosis pathway genes were dysregulated by MED12 KO in stimulated Teffs. f. Flow cytometry gating strategy for activation-induced cell death (AICD) apoptosis assays. g. FAS cell surface expression in MED12 KO and AAVS1 KO control cells (FAS MFI as quantified by flow cytometry is compared across perturbation conditions). Stars indicate significantly different MFI in MED12 KO cells compared to control AAVS1 KO cells using a two-tailed T test (n = 2 donors x 2 sgRNAs per gene; Dose 0: p = 0.019, 0.1: p = 0.0071, 0.25: p = 0.0056, 1: p = 0.0047, 2.5: p = 0.0018). Source Data

References

    1. Lee, T. I. & Young, R. A. Transcriptional regulation and its misregulation in disease. Cell152, 1237–1251 (2013). - PMC - PubMed
    1. Ong, C. T. & Corces, V. G. Enhancer function: new insights into the regulation of tissue-specific gene expression. Nat. Rev. Genet.12, 283–293 (2011). - PMC - PubMed
    1. Almeida, N. et al. Employing core regulatory circuits to define cell identity. EMBO J.40, e106785 (2021). - PMC - PubMed
    1. Lee, W. & Lee, G. R. Transcriptional regulation and development of regulatory T cells. Exp. Mol. Med.50, e456 (2018). - PMC - PubMed
    1. Ota, M. et al. Dynamic landscape of immune cell-specific gene regulation in immune-mediated diseases. Cell184, 3006–3021.e17 (2021). - PubMed

MeSH terms