. 2024 Dec 11;24(1):1510.
doi: 10.1186/s12885-024-13248-9.

Prediction of gene expression-based breast cancer proliferation scores from histopathology whole slide images using deep learning

Affiliations

Prediction of gene expression-based breast cancer proliferation scores from histopathology whole slide images using deep learning

Andreas Ekholm et al. BMC Cancer. .

Abstract

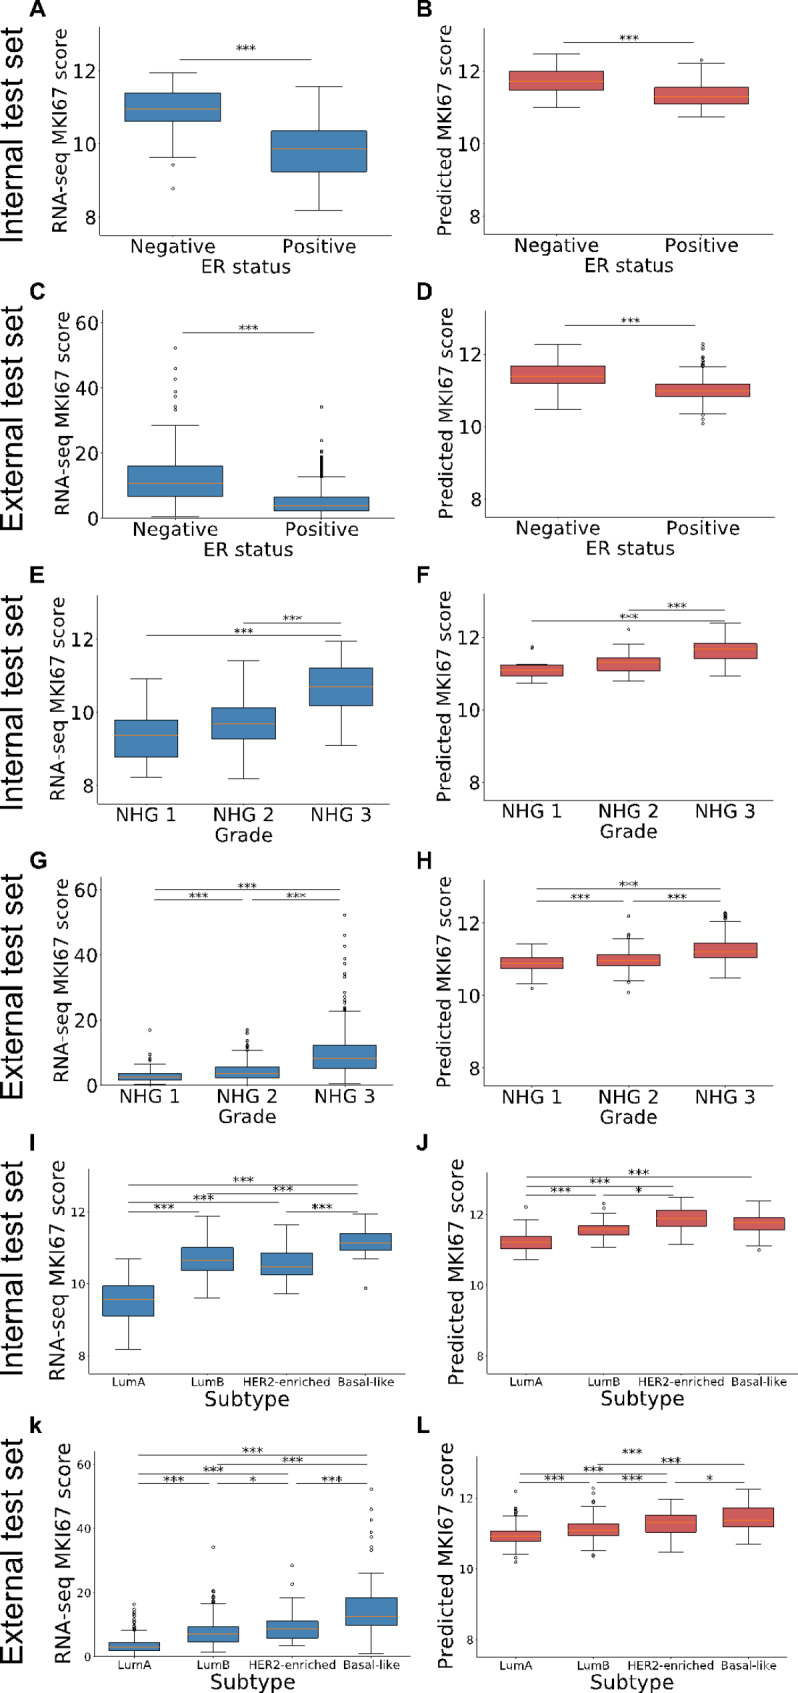
Background: In breast cancer, several gene expression assays have been developed to provide a more personalised treatment. This study focuses on the prediction of two molecular proliferation signatures: an 11-gene proliferation score and the MKI67 proliferation marker gene. The aim was to assess whether these could be predicted from digital whole slide images (WSIs) using deep learning models.

Methods: WSIs and RNA-sequencing data from 819 invasive breast cancer patients were included for training, and models were evaluated on an internal test set of 172 cases as well as on 997 cases from a fully independent external test set. Two deep Convolutional Neural Network (CNN) models were optimised using WSIs and gene expression readouts from RNA-sequencing data of either the proliferation signature or the proliferation marker, and assessed using Spearman correlation (r). Prognostic performance was assessed through Cox proportional hazard modelling, estimating hazard ratios (HR).

Results: Optimised CNNs successfully predicted the proliferation score and proliferation marker on the unseen internal test set (ρ = 0.691(p < 0.001) with R2 = 0.438, and ρ = 0.564 (p < 0.001) with R2 = 0.251 respectively) and on the external test set (ρ = 0.502 (p < 0.001) with R2 = 0.319, and ρ = 0.403 (p < 0.001) with R2 = 0.222 respectively). Patients with a high proliferation score or marker were significantly associated with a higher risk of recurrence or death in the external test set (HR = 1.65 (95% CI: 1.05-2.61) and HR = 1.84 (95% CI: 1.17-2.89), respectively).

Conclusions: The results from this study suggest that gene expression levels of proliferation scores can be predicted directly from breast cancer morphology in WSIs using CNNs and that the predictions provide prognostic information that could be used in research as well as in the clinical setting.

Keywords: Artificial intelligence; Breast cancer; Computational pathology; Gene expression; Proliferation.


Conflict of interest statement

Declarations. Ethics approval and consent to participate: The Clinseq study was approved by the Ethical Committee of Karolinska Institutet. Stockholm, Sweden, with reference 2013/1833-31/2. The SCAN-B study was approved by the Regional Ethical Review Board in Lund, Sweden (registration numbers 2009/658, 2010/383, 2012/58, 2013/459, 2014/521, 2015/277, 2016/541, 2016/742, 2016/944, 2018/267 and the Swedish Ethical Review Authority (registration numbers 2019-01252, 2024-02040-02). All patients provided written informed consent prior to enrollment. All analyses were performed in accordance with patient consent and ethical regulations and decisions. The study was further approved by the Swedish Ethical Review Authority (Etiksprovningsmyndigheten, Stockholm, Sweden, reference 2017/2106-31, with amendments 2018/1462-32 and 2019–02336). Consent for publication: Not applicable. Competing interests: MR is a cofounder and shareholder of Stratipath AB. YW is employed by Stratipath AB and holds employee stock options. AE, JVC and CB declare no financial or non-financial competing interests.

Figures

Fig. 1
Fig. 1
Model performance for the 11-gene proliferation score prediction Scatterplots of the 11-gene proliferation score predictions and RNA-seq values. (A) Results for the internal test set of TCGA and ClinSeq patients (n = 172). (B) Performance on the external test set from SCAN-B (n = 997).
Fig. 2
Fig. 2
Model performance for the 11-gene proliferation score prediction by patients’ ER status Scatterplots of the 11-gene proliferation score predictions and RNA-seq values. (A) Results for the internal test set, ER- patients (n = 38) (B) Results for the internal test set, ER + patients (n = 121) (C) Results for the external test set, ER- patients (n = 110) (D) Results for the external test set, ER + patients (n = 885).
Fig. 3
Fig. 3
Model performance for the MKI67 proliferation marker prediction Scatterplots of the MKI67 proliferation gene predictions and RNA-seq values. (A) Results for the internal test set TCGA + ClinSeq patients (n = 172). (B) Performance on the external test set of SCAN-B patients (n = 997).
Fig. 4
Fig. 4
Model performance for the MKI67 proliferation marker prediction by patients’ ER status Scatterplots of the MKI67 proliferation marker predictions and RNA-seq values. (A) Results for the internal test set, ER- patients (n = 38) (B) Results for the internal test set, ER + patients (n = 121) (C) Results for the external test set, ER- patients (n = 110) (D) Results for the internal test set, ER + patients (n = 885)
Fig. 5
Fig. 5
11-gene proliferation score by ER status, grade and subtype Box-plot presenting RNA-seq values (blue) and predicted values (red) for the 11-gene set proliferation score by ER status, grade and subtype. (A) RNA-seq score by ER status in the internal test set (B) Predicted score by ER status in the internal test set (C) RNA-seq score by ER status in the external test set (D) Predicted score by ER status in the external test set (E) RNA-seq score by grade in the internal test set (F) Predicted score by grade in the internal test set (G) RNA-seq score by grade in the external test set (H) Predicted score by grade in the external test set (I) RNA-seq score by subtype in the internal test set. (J) Predicted score by subtype in the internal test set K) RNA-seq score by subtype in the external test set L) Predicted score by subtype in the external test set. *p-value < 0.05, **p-value < 0.01, ***p-value < 0.001.
Fig. 6
Fig. 6
MKI67 proliferation marker by ER status, grade and subtype Box-plot presenting RNA-seq based marker values (blue) and predicted marker values (red) for the MKI67 proliferation marker by ER status, grade and subtype. (A) RNA-seq score by ER status in the internal test set (B) Predicted score by ER status in the internal test set (C) RNA-seq score by ER status in the external test set (D) Predicted score by ER status in the external test set (E) RNA-seq score by grade in the internal test set (F) Predicted score by grade in the internal test set (G) RNA-seq score by grade in the external test set (H) Predicted score by grade in the external test set (I) RNA-seq score by subtype in the internal test set. (J) Predicted score by subtype in the internal test set K) RNA-seq score by subtype in the external test set L) Predicted score by subtype in the external test set. *p-value < 0.05, **p-value < 0.01, ***p-value < 0.001
Fig. 7
Fig. 7
Prognostic performance of the predicted 11-gene set proliferation score Evaluation of the prognostic performance on recurrence-free survival (defined as the time to having a locoregional or distant metastasis, contralateral tumour or death) in the external SCAN-B dataset. (A) Kaplan-Meier curve for all patients stratified by the predicted 11-gene proliferation score into high- and low-risk groups. (B) Forest plot from multivariable Cox proportional hazard regression in all patients for the predicted 11-gene proliferation score based risk groups, adjusting for age, tumour size, lymph node status, grade, ER status and HER2 status. (C) Kaplan-Meier curve for ER-positive patients stratified by the predicted 11-gene proliferation score into high- and low-risk groups. (D) Forest plot from multivariable Cox proportional Hazard regression in ER-positive patients for the predicted 11-gene proliferation score based risk groups, adjusting for age, tumour size, lymph node status, grade and HER2 status
Fig. 8
Fig. 8
Prognostic performance of the predicted MKI67 gene proliferation marker Evaluation of the prognostic performance on recurrence-free survival (defined as the time to having a locoregional or distant metastasis, contralateral tumour or death) in the external SCAN-B dataset. (A) Kaplan-Meier curve for all patients stratified by the predicted MKI67 gene proliferation marker into high- and low-risk groups. (B) Forest plot from multivariable Cox proportional hazard regression in all patients for the predicted MKI67 gene proliferation marker based risk groups, adjusting for age, tumour size, lymph node status, grade, ER status and HER2 status. (C) Kaplan-Meier curve for ER-positive patients stratified by the predicted MKI67 gene proliferation marker into high- and low-risk groups. (D) Forest plot from multivariable Cox proportional Hazard regression in ER-positive patients for the predicted MKI67 gene proliferation marker risk groups, adjusting for age, tumour size, lymph node status, grade and HER2 status

References

    1. Sung H, Ferlay J, Siegel RL, Laversanne M, Soerjomataram I, Jemal A et al. Global Cancer Statistics 2020: GLOBOCAN Estimates of Incidence and Mortality Worldwide for 36 Cancers in 185 Countries. CA: A Cancer Journal for Clinicians. 2021;71(3):209 – 49. - PubMed
    1. Heng YJ, Lester SC, Tse GM, Factor RE, Allison KH, Collins LC, et al. The molecular basis of breast cancer pathological phenotypes. J Pathol. 2017;241(3):375–91. - PMC - PubMed
    1. Elston CW, Ellis IO. Pathological prognostic factors in breast cancer. I. The value of histological grade in breast cancer: experience from a large study with long-term follow-up. Histopathology. 1991;19(5):403–10. - PubMed
    1. Parker JS, Mullins M, Cheang MCU, Leung S, Voduc D, Vickery T, et al. Supervised risk predictor of breast Cancer based on intrinsic subtypes. J Clin Oncol. 2009;27(8):1160–7. - PMC - PubMed
    1. Paik S, Shak S, Tang G, Kim C, Baker J, Cronin M, et al. A multigene assay to predict recurrence of tamoxifen-treated, node-negative breast cancer. N Engl J Med. 2004;351(27):2817–26. - PubMed

LinkOut - more resources