. 2025 Apr;21(4):771-788.
doi: 10.1080/15548627.2024.2429371. Epub 2024 Dec 11.

USP4 depletion-driven RAB7A ubiquitylation impairs autophagosome-lysosome fusion and aggravates periodontitis

Affiliations

USP4 depletion-driven RAB7A ubiquitylation impairs autophagosome-lysosome fusion and aggravates periodontitis

Sen Kang et al. Autophagy. 2025 Apr.

Abstract

Periodontitis, a prevalent and chronic inflammatory disease, is intricately linked with macroautophagy/autophagy, which has a dual role in maintaining periodontal homeostasis. Despite its importance, the precise interplay between autophagy and periodontitis pathogenesis remains to be fully elucidated. In this study, our investigation revealed that the ubiquitination of RAB7A, mediated by reduced levels of the deubiquitinating enzyme USP4 (ubiquitin specific peptidase 4), disrupts normal lysosomal trafficking and autophagosome-lysosome fusion, thereby contributing significantly to periodontitis progression. Specifically, through genomic and histological analysis of clinical gingival samples, we observed a decreased RAB7A expression and impaired autophagic activity in periodontitis. This was further substantiated through experimental periodontitis mice, where RAB7A inactivation was shown to directly affect autophagy efficiency and drive periodontitis progression. Next, we explored the function of active RAB7A to promote lysosomal trafficking dynamics and autophagosome-lysosome fusion, which was inhibited by RAB7A ubiquitination in macrophages stimulated by Porphyromonas gingivalis (P. g.), one of the keystone pathogens of periodontitis. Last, by proteomics analysis, we revealed that the ubiquitination of RAB7A was mediated by USP4 and validated that upregulation of USP4 could attenuate periodontitis in vivo. In conclusion, these findings highlight the interaction between USP4 and RAB7A as a promising target for therapeutic intervention in managing periodontal diseases.Abbreviation: 3-MA: 3-methyladenine; Baf A1:bafilomycin A1; BECN1: beclin 1, autophagy related; CEJ-ABC: cementoenamel junctionto alveolar bone crest; IL1B/IL-1β: interleukin 1 beta; KD:knockdown; LPS: lipopolysaccharide; MOI: multiplicity of infection;OE: overexpression; P.g.: Porphyromonasgingivalis; RILP: Rabinteracting lysosomal protein; ScRNA-seq: single-cell RNA sequencing; SQSTM1/p62: sequestosome 1; S.s.: Streptococcus sanguinis; USP4:ubiquitin specific peptidase 4.

Keywords: Autophagy; GTP-RAB7A; IL1B; porphyromonas gingivalis; ubiquitination.


Conflict of interest statement

No potential conflict of interest was reported by the author(s).

Figures
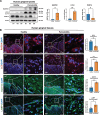
Figure 1.
Figure 1.
Impaired autophagy and decreased RAB7A expression are found in periodontitis patients. (A) Western blot analysis of autophagy regulator RAB7A and autophagy markers (LC3, SQSTM1) in healthy and periodontitis gingiva (n = 3 for each group). Anti-RAB7A (cell signaling technology 95,746), anti-LC3 (cell signaling technology 12,741), anti-SQSTM1 (cell signaling technology 88,588). (B) immunofluorescence analysis of autophagy regulator RAB7A, LC3, SQSTM1, LAMP1 in lamina propria of healthy and periodontitis gingiva (n = 3 for each group). Scale bars: 50 μm; zoom: 20 μm. Anti-RAB7A (cell signaling technology 95,746). anti-LC3 (cell signaling Technology,12741), anti-SQSTM1 (cell signaling Technology,88588). Data were presented as mean ± SEM. p-values were calculated through two-tailed Student’s t-tests.
Figure 2.
Figure 2.
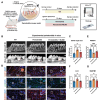
RAB7A agonist ML098 promotes autophagy and inhibits alveolar bone loss in periodontitis mice. (A) mouse experimental periodontitis scheme. The 6-8-week-old mice were randomly divided into three groups. The control group was not treated. The periodontitis group was subjected to ligature and P. g. on the maxillary second molars with or without RAB7A agonist ML098 (1 mg/kg) intraperitoneal injection (every 2 days). Mice were harvested 10 days later for periodontal tissue analysis. (B) Representative micro-ct analysis of alveolar bone in normal control mice, periodontitis mice, and periodontitis mice with ML098 group. Scale bars: 500 μm. (C) micro-ct analysis of the CEJ-ABC distance at the palatal side of the second molar (indicated by red lines) in three groups of mice (n = 5 for each group). CEJ-ABC, the cementoenamel junction to the alveolar bone crest. (D) Representative Immunofluorescence staining of autophagy regulator RAB7A and autophagy maker LC3 and SQSTM1 in three groups of mice. Scale bars: 50 μm; zoom: 10 μm. Anti-RAB7A (cell signaling Technology,95746), anti-LC3 (cell signaling Technology,12741), anti-SQSTM1 (CST 88,588). (E, F, G) expression of RAB7A, LC3, and SQSTM1 in the gingiva of three groups of mice (n = 5 for each group). Data were presented as mean ± SEM. p-values were calculated through one-way ANOVA test.
Figure 3.
Figure 3.
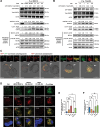
Autophagy impairment is mediated by blocking autophagosome-lysosome fusion in macrophages. (A-B) time-dependent (left panel) and dose-dependent (right panel) assay of P. g.stimulation were performed on THP-1-derived macrophages. Western blot analysis was performed for the expression RAB7A and active RAB7A, autophagy markers (SQSTM1 and LC3), autophagy initiation-related proteins (BECN1, MTOR, and p-mtor). One representative blot is shown in two independent experiments. (C) GFP-RFP-LC3 THP-1 cells were stimulated with P. g. (MOI = 100), and representative time-lapse confocal images were captured to detect autophagic flux. Red dots represent autolysosomes and yellow dots autophagosomes. Scale bars: 10 μm. Zoom, 5 μm. (D) GFP-RFP-LC3 THP-1 cells were treated with P. g. (MOI = 100), Rapa (10 nM), and Baf A1 (50 nM) for 8 h to detect autophagy flux. Representative images of fluorescent LC3 puncta were shown. Red dots represent autolysosomes and yellow dots autophagosomes. Scale bars: 10 μm. (E-F) the number of GFP+ RFP+ LC3 (autophagosome) and GFP RFP+ LC3 (autolysosome) was calculated from multicell images. Data were presented as mean ± SEM. p-values were calculated through one-way ANOVA test. Rapa, rapamycin. Baf A1, bafilomycin A1.
Figure 4.
Figure 4.
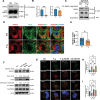
Autophagosome-lysosome fusion is blocked by decreased GTP-RAB7A. (A) Western blot analysis of total RAB7A and GTP-RAB7A (active form, immunoprecipitated by anti-GTP-RAB7A antibody) in control vs. P. g-stimulated THP-1 cells (MOI = 100, 8 h). One representative blot is shown in three independent experiments. Anti-RAB7A (cell signaling Technology,95746), anti-GTP-RAB7A (NewEast 26,923). (B) quantity analysis of the ratio of GTP-RAB7A expression to total RAB7A. (C) Western blot analysis of co-ip from THP-1 cells transfected and treated as indicated. RAB7A pulled down by GST-RILP represents GTP-RAB7A. (D) confocal microscopy analysis for colocalizations of RAB7A with RILP in control vs. P. g-stimulated THP-1 cells (MOI = 100, 8 h). RAB7A (red) and RILP (green) were stained using anti-RAB7A and anti-rilp antibodies. Scale bars: 10 μm. (E) colocalization plots report Mander’s overlap quantified from multicell images (black dots). (F) Western blot analysis of SQSTM1, LC3, total RAB7A and GTP-RAB7A (immunoprecipitated by anti-GTP-RAB7A antibody) in four groups as indicated. CID-1067700 (100 μM), ML098 (100 nM), baf A1 (50 nM). (G) GFP-RFP-LC3 THP-1 cells were treated with P. g. (MOI = 100), ML098 (100 nm), and CID-1067700 (100 μM) for 8 h and the colocalization of GFP-LC3 and RFP-LC3 was captured to detect the autophagy. Red dots represent autolysosomes and yellow dots autophagosomes. Scale bars: 10 μm. (H-I) the number of GFP+ RFP+ LC3 (autophagosome) and to GFP RFP+ LC3 (autolysosome) was calculated from multicell images. One representative blot is shown in two independent experiments. Data were presented as mean ± SEM. p-values were calculated through two-tailed Student’s t-tests (B, E) and one-way ANOVA test (H, I).
Figure 5.
Figure 5.
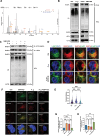
USP4 promotes autophagosome-lysosome fusion by deubiquitination of RAB7A. (A) the whole lysates were extracted from THP-1 cells with or without P. g. stimulation. Lysosomal interacting proteins were immunoprecipitated and were subject to mass spectrometry. The data revealed multiple USP4 peptides in lysosome-bound protein samples, indicating the interaction between RAB7A and USP4. (B, C) Western blot analysis of Co-ip from THP-1 cells transfected and treated as indicated. (B) THP-1 cells were transfected with siRNA to knock down the USP gene. Ubiquitin-conjugated proteins were pulled down using anti-ub antibody, followed by Western blot analysis using anti-RAB7A antibody. (C) THP-1 cells were transfected with USP4 overexpression lentivirus and used GTP-RAB7A and USP4 antibodies to pull down GTP-RAB7A-binding and USP4-binding proteins to measure RAB7A (GTP-RAB7A and USP4 bounding RAB7A. (D) Representative confocal images of RAB7A with lysosome marker LAMP1. Scale bars: 10 μm. (E) LAMP1 fluorescent intensity distribution is expressed as distance along a straight line from the center of the nucleus to the peripheral area. Fluorescence intensities were quantified along a straight line extending from the center of the cell’s nucleus (designated as fractional distance = 0) to the plasma membrane (designated as fractional distance = 1.0). (F) GFP-RFP-LC3 THP-1 cells were transfected with USP4 siRNA and USP4 overexpressed lentivirus to detect autophagy flux. Representative images were captured to display the colocalization of GFP-LC3 and RFP-LC3 after being treated with P. g. (MOI = 100, 8 h). Red dots represent autolysosomes and yellow dots autophagosomes. Scale bars: 10 μm. (G-H) the number of GFP+ RFP+ LC3 (autophagosome) and to GFP RFP+ LC3 (autolysosome) was calculated from multicell images. Data were presented as mean ± SEM. p-values were calculated through one-way ANOVA test.
Figure 6.
Figure 6.
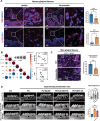
Decreased USP4 and enhanced IL1B expression are found in periodontitis. (A) immunofluorescence analysis of USP4, IL1B in lamina propria of healthy and periodontitis gingiva (n = 3 for each group). Scale bars: 50 μm; zoom: 20 μm. (B) Spearman correlation for the autophagy related genes (MAP1LC3A, MAP1LC3B2, SQSTM1, RAB7A), inflammation relation genes (IL1B), and USP4 across clinical healthy and periodontitis gingiva samples. The data was obtained from rna-seq analysis of the total RNA extracted from clinical human gingival tissue lysates (n = 5 in the healthy group, n = 4 in the periodontitis group). (C) the immunofluorescence analysis of USP4 in control group mice and periodontitis mice (n = 5 for each group). Scale bars: 50 μm. Zoom, 10 μm. (D) Representative micro-ct analysis of alveolar bone in normal control mice and periodontitis mice treated with ML098 (1 mg/kg),CID-1067700 (10 mg/kg), and USP4 overexpression adenovirus. Scale bars: 500 μm. Data were presented as mean ± SEM. p-values were calculated through two-tailed Student’s t-tests (A, C) and one-way ANOVA test (D).
Figure 7.
Figure 7.
Model of RAB7A ubiquitination-mediated impaired autophagosome-lysosome fusion in periodontitis pathogenesis. Research Paperhe periodontitis condition (right panel): in the absence of USP4, lack of RAB7A deubiquitination (GDP-RAB7A form) results in impaired autophagosome-lysosome fusion. The impaired autophagy leads to increased IL1B maturation and release, which contributes to periodontitis pathogenesis.

References

    1. Kassebaum NJ, Bernabé E, Dahiya M, et al. Global burden of severe periodontitis in 1990-2010: a systematic review and meta-regression. J Dent Res. 2014;93(11):1045–1053. doi: 10.1177/0022034514552491 - DOI - PMC - PubMed
    1. Zheng S, Yu S, Fan X, et al. Porphyromonas gingivalis survival skills: immune evasion. J Periodontal Res. 2021;56(6):1007–1018. doi: 10.1111/jre.12915 - DOI - PubMed
    1. Zheng X, Tizzano M, Redding K, et al. Gingival solitary chemosensory cells are immune sentinels for periodontitis. Nat Commun. 2019;10(1):4496. doi: 10.1038/s41467-019-12505-x - DOI - PMC - PubMed
    1. Bao J, Li L, Zhang Y, et al. Periodontitis may induce gut microbiota dysbiosis via salivary microbiota. Int J Oral Sci. 2022;14(1):32. doi: 10.1038/s41368-022-00183-3 - DOI - PMC - PubMed
    1. Maekawa T, Krauss J, Abe T, et al. Porphyromonas gingivalis manipulates complement and TLR signaling to uncouple bacterial clearance from inflammation and promote dysbiosis. Cell Host & Microbe. 2014;15(6):768–778. doi: 10.1016/j.chom.2014.05.012 - DOI - PMC - PubMed

Publication types

MeSH terms

Substances