. 2025 Feb;55(2):e202451404.
doi: 10.1002/eji.202451404. Epub 2024 Dec 11.

Dual Activation-Induced Marker Combinations Efficiently Identify and Discern Antigen-Specific and Bystander-Activated Human CD4+ T Cells

Affiliations

Dual Activation-Induced Marker Combinations Efficiently Identify and Discern Antigen-Specific and Bystander-Activated Human CD4+ T Cells

Maria Grazia Ceraolo et al. Eur J Immunol. 2025 Feb.

Abstract

Identifying activated T lymphocytes and differentiating antigen-specific from bystander T cells is crucial for understanding adaptive immune responses. This study investigates the efficacy of activation-induced markers (AIMs) in distinguishing these cell populations. We measured the expression of commonly used AIMs (CD25, CD38, CD40L, CD69, CD137, HLA-DR, ICOS, and OX40) in an in vitro T-cell activation system and evaluated their sensitivity, specificity, and positive predictive value. We demonstrated that individual AIMs, while specific in detecting activated CD4+ T cells, poorly discriminate between antigen-specific and bystander activation, as assessed by a discriminative capacity (DC) score we developed. Our analysis revealed that dual AIM combinations significantly enhanced the ability to distinguish antigen-specific from bystander-activated T cells, achieving DC scores above 90%. These combinations also improved positive predictive value and specificity with a modest reduction in sensitivity. The CD25hi/ICOShi combination emerged as the most efficient, with an average sensitivity of 84.35%, specificity of 99.7%, and DC score of 90.12%. Validation through T-cell cloning and antigen re-stimulation confirmed the robustness of our predictions. This study provides a practical framework for researchers to optimize strategies for identifying and isolating antigen-specific human CD4+ T lymphocytes and studying their phenotype, function, and T-cell receptor repertoire.

Keywords: T‐cell clones; activation‐induced markers; antigen‐specific CD4+ T cells; bystander activation; human T cells.


Conflict of interest statement

The authors declare no conflicts of interest.

Figures

FIGURE 1
FIGURE 1
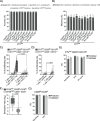
Individual AIMs detect activated CD4+ T cells with good sensitivity and high specificity but poorly distinguish true‐positive and false‐positive events. (A) Schematic representation of the experimental strategy, created with the help of Biorender.com. (B) CTV staining of CD4+ and CD8+ T cells stimulated with plate‐bound α‐CD3 + α‐CD28 antibodies or left unstimulated. Displayed are representative histograms (upper panels) and bar plots showing the frequency of proliferating T cells in three biologically independent replicates (mean ± SEM, lower panels). (C) Representative FACS contour plot of a CTV and AIM staining on CD4+ T cells stimulated with APCs + Ag illustrating the definition of true and false positive and negative events in the assay. (D) Mathematical formulas describing how sensitivity, specificity, and positive predictive value are calculated. Bar plots showing the sensitivity (E), specificity (F), and positive predictive value (G) of the indicated individual AIMs in three biologically independent replicates (mean ± SEM) of antigen‐specific (dark grey) and bystander (light grey) stimulations. In (B), (E), (F), and (G), the individual values of the biologically independent replicates are identified by different shapes. p‐values in (E), (F), and (G) are determined by a multiple paired t‐test.
FIGURE 2
FIGURE 2
Dual AIM combinations efficiently identify activated CD4+ T cells and discriminate between antigen‐specific and bystander activation. (A) Bar plot showing the discriminative capacity (DC) score of the indicated individual AIMs in three biologically independent replicates (mean ± SEM). The mathematical formula for calculating the DC score is clarified above the bar plot. (B) Representative overlayed FACS contour plot matrix of the indicated dual AIM staining in antigen‐specific (red) and bystander‐activated (cyan) CTVlow CD4+ T cells. Black boxes inside the contour plots show the AIMhi gates. The adjunct histograms display the fluorescence intensity of the corresponding individual AIMs. Bar plots showing the DC score (C), positive predictive value (D), sensitivity (E), and specificity (F) of the indicated dual AIM combinations (dark grey), compare in three biologically independent replicates of antigen‐specific stimulations (mean ± SEM). The parameters of the dual AIM combinations are directly compared with the values of the individual AIMs in the same combination (white and light grey). In (A), (C), (D), (E), and (F), the individual values of the biologically independent replicates are identified by different shapes. p‐values in (C), (D), and (F) are determined by a multiple unpaired t‐test: * p < 0.05, ** p < 0.01.
FIGURE 3
FIGURE 3
CD25/ICOS combination best identifies activated CD4+ T cells and distinguishes antigen‐specific from bystander‐activated cells. Bar plots showing the accuracy (A) and the efficiency (B) of the indicated dual AIM combinations in three biologically independent replicates (mean ± SEM). The individual values of the biologically independent replicates are identified by different shapes. The mathematical formula for calculating the two parameters is clarified above each bar plot. (C) Box and whiskers plots showing the frequency of proliferating cells in CD4+ T‐cell clones isolated from the CTVlowCD25hiCD137hi (n = 49) and CTVlowCD25CD137 (n = 49) subsets when re‐stimulated with unloaded APCs, Spike‐loaded APCs, or left unstimulated. Shown are the cumulative results of three biologically independent replicates. (D) Box and whiskers plots showing the frequency of proliferating cells in CD4+ T‐cell clones isolated from the CTVlowCD25hiCD137hi (n = 38) and CTVlowCD25CD137 (n = 42) subsets when re‐stimulated with the cytokine cocktail or left unstimulated. Shown are the cumulative results of two biologically independent replicates. (C, D) Each dot represents an individual T‐cell clone with lines connecting data from the same clone under the indicated different experimental conditions. p‐values are determined by a two‐tailed Mann–Whitney t‐test. (E) Bar plots displaying the sensitivity, positive predictive value, and DC score calculated for the CD25/CD137 combination based on the data shown in Figure S3C,D and summarized here in panels (C) and (D), in comparison with the predicted values. (F) Box and whiskers plots showing the stimulation index of CD4+ T‐cell clones isolated from the CSFElowCD25hiICOShi (n = 47) and CFSEhighCD25ICOS (n = 54) subsets when re‐stimulated with C. albicans‐loaded APCs. Shown are the cumulative results of two biologically independent replicates. The p‐value is determined by a two‐tailed Mann–Whitney t‐test. (G) Bar plots displaying the specificity and positive predictive value calculated for the CD25/ICOS combination based on the data shown in Figure S3F and summarized here in panel (F), in comparison with the predicted values.

References

    1. Unutmaz D., Pileri P., and Abrignani S., “Antigen‐Independent Activation of Naive and Memory Resting T Cells by a Cytokine Combination,” Journal of Experimental Medicine 180 (1994): 1159–1164, 10.1084/jem.180.3.1159. - DOI - PMC - PubMed
    1. Lee H., Jeong S., and Shin E. C., “Significance of Bystander T Cell Activation in Microbial Infection,” Nature Immunology 23 (2022): 13–22, 10.1038/s41590-021-00985-3. - DOI - PubMed
    1. Notarbartolo S. and Abrignani S., “Human T Lymphocytes at Tumor Sites,” Seminars in immunopathology 44 (2022): 883–901, 10.1007/s00281-022-00970-4. - DOI - PMC - PubMed
    1. Sallusto F., Lenig D., Forster R., Lipp M., and Lanzavecchia A., “Two Subsets of Memory T Lymphocytes With Distinct Homing Potentials and Effector Functions,” Nature 401 (1999): 708–712, 10.1038/44385. - DOI - PubMed
    1. Manz R., Assenmacher M., Pflüger E., Miltenyi S., and Radbruch A, “Analysis and Sorting of Live Cells According to Secreted Molecules, Relocated to a Cell‐Surface Affinity matrix,” Proceedings of the National Academy of Sciences 1995; 92:1921–1925, 10.1073/pnas.92.6.1921. - DOI - PMC - PubMed

MeSH terms

Substances