. 2024 Jun 14;4(6):531-543.
doi: 10.1515/mr-2024-0031. eCollection 2024 Dec.

MST1 interactomes profiling across cell death in esophageal squamous cell carcinoma

Affiliations

MST1 interactomes profiling across cell death in esophageal squamous cell carcinoma

Li Zhang et al. Med Rev (2021). .

Abstract

Objectives: Resistance to apoptosis in esophageal squamous cell carcinoma (ESCC) constitutes a significant impediment to treatment efficacy. Exploring alternative cell death pathways and their regulatory factors beyond apoptosis is crucial for overcoming drug resistance and enhancing therapeutic outcomes in ESCC.

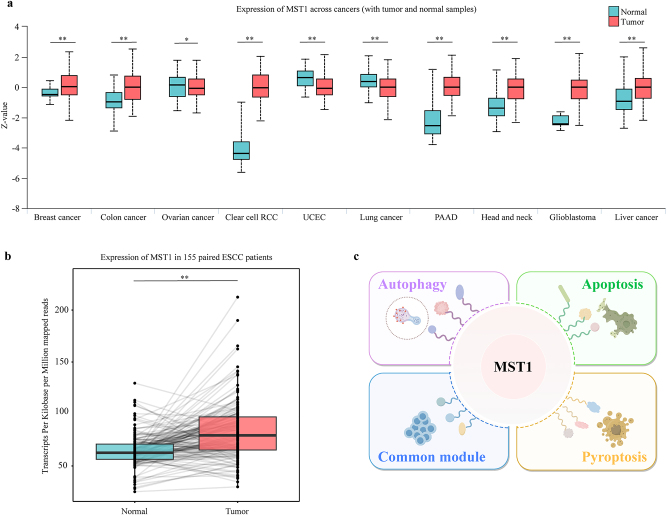
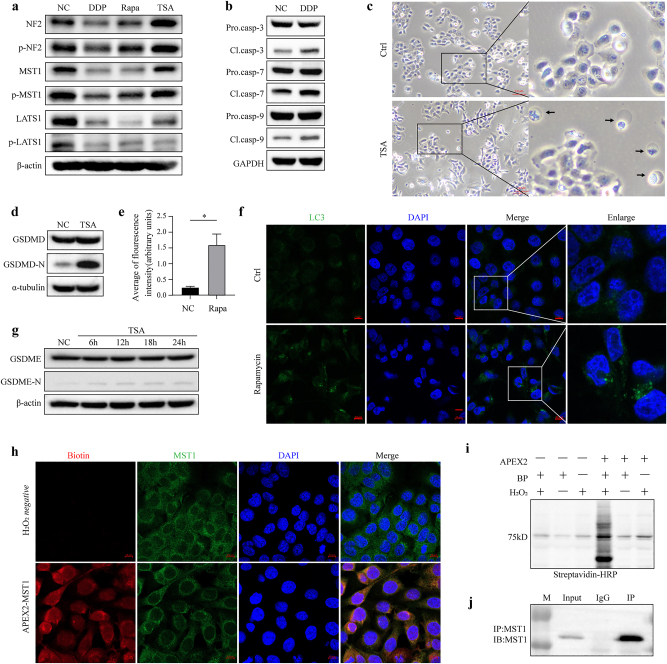
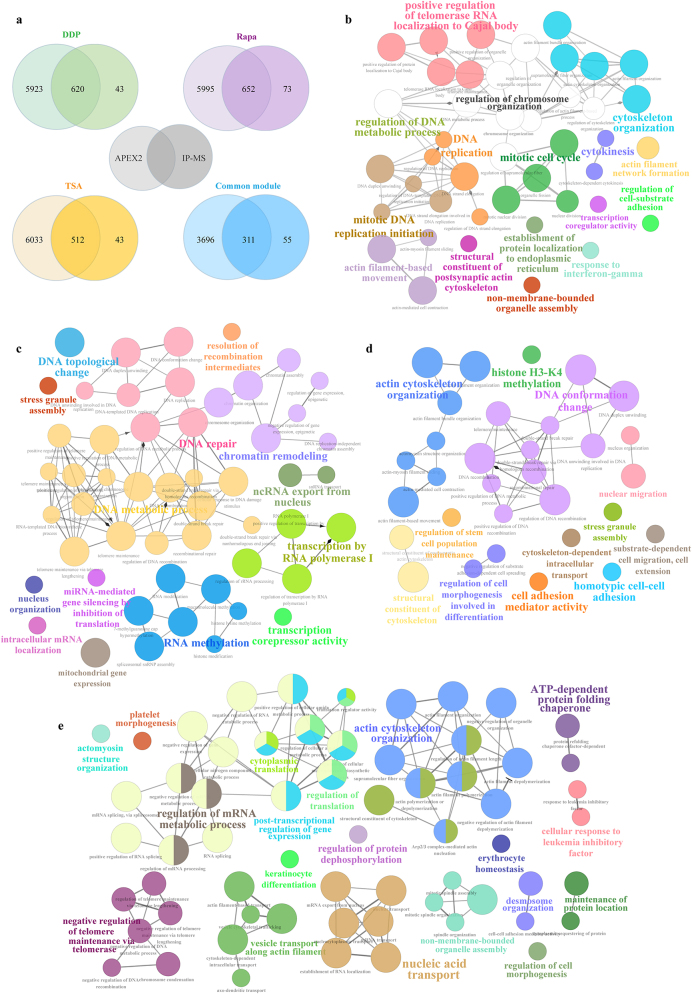
Methods: Mammalian Ste 20-like kinase 1 (MST1) is implicated in regulating various cell deaths, including apoptosis, autophagy, and pyroptosis. Employing enhanced ascorbate peroxidase 2 (APEX2) proximity labeling coupled with immunoprecipitation-mass spectrometry (IP-MS), we elucidated the interactomes of MST1 across these three cell death paradigms.

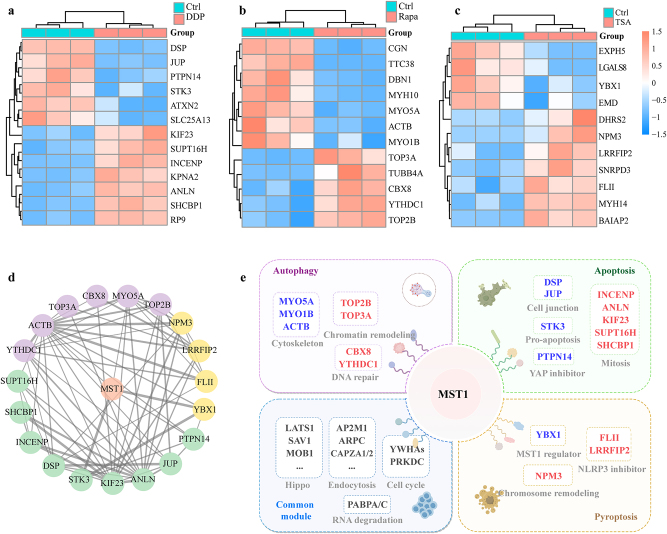
Results: Proteomic profiling unveiled the functional roles and subcellular localization of MST1 and its interacting proteins during normal proliferation and various cell death processes. Notably, MST1 exhibited an expanded interactome during cell death compared to normal proliferation and chromosome remodeling functions consistently. In apoptosis, there was a notable increase of mitosis-associated proteins such as INCENP, ANLN, KIF23, SHCBP1 and SUPT16H, which interacted with MST1, alongside decreased expression of the pre-apoptotic protein STK3. During autophagy, the bindings of DNA repair-related proteins CBX8 and m6A reader YTHDC1 to MST1 were enhanced. In pyroptosis, LRRFIP2 and FLII which can inhibit pyroptosis increasingly binding to MST1.

Conclusions: Our findings delineate potential mechanisms through which MST1 and its interactomes regulate cell death, paving the way for further investigation to validate and consolidate these observations.

Keywords: APEX2; ESCC; MST1; cell death; proteomics.


Conflict of interest statement

Competing interests: Authors state no conflict of interest.

Figures

Figure 1:
Figure 1:
Expression of MST1 across cancers. (a) The expression of MST1 in different cancer species. MST1 was significantly overexpressed in seven cancers, which was analyzed and visualized using the UALCAN (ualcan.path.uab.edu) website. RCC, renal cell carcinoma; UCEC, uterine corpus endometrial carcinoma; PAAD, pancreatic adenocarcinoma (**p<0.01; *p<0.05). (b) The expression of MST1 in tumor tissues of 155 patients with esophageal squamous cell carcinoma was significantly higher than that in adjacent normal tissues (**p<0.01). The data generated by this paper is available through the genome sequence archive (GSA) in the BIG Data Center (http://bigd.big.ac.cn/gsa), Beijing Institute of Genomics (BIG), Chinese Academy of Sciences: HRA003107 (WGS & RNA-seq, https://ngdc.cncb.ac.cn/gsa-human/browse/HRA003107), HRA003533 (WGBS, https://ngdc.cncb.ac.cn/gsa-human/browse/HRA003533). (c) The schematic diagram of MST1 and its interactomes exhibit varied roles in apoptosis, autophagy, pyroptosis and the c.
Figure 2:
Figure 2:
Induction of cell death in ESCC cells. (a) MST1 expression and phosphorylation decreased after 24 h of treatment with DDP, rapamycin, or TSA in KYSE150 cells. (b) Cleavage of Caspase-3, Caspase-7, and Caspase-9 in KYSE150 cells significantly increased after 24-h treatment with 35 μmol/L DDP. (c) Morphological features indicative of pyroptosis, including cell swelling and plasma membrane bubbling, were observed in cells 24 h after treatment with 1 μmol/L TSA. (d) Cleavage of GSDMD increased in cells following 24-h induction with 1 μmol/L TSA. (e) and (f) LC3 expression significantly increased in KYSE150 cells following treatment with 10 μmol/L rapamycin for 24 h (*p<0.05). (g) Cleavage of GSDME increased in cells following 24-h induction with 1 μmol/L TSA. (h) Immunofluorescence-validated APEX2-MST1 labeling specificity in KYSE150 cells, biotin red, MST1 green; right: expression of the APEX2-MST1 fusion protein. APEX2, ascorbate peroxidase 2. (i) Streptavidin-HRP Western blotting of induced protein biotinylation in lysates from cells expressing APEX2-MST1. BP, biotin-phenol. (j) The IP efficiency was verified by Western blotting. IP, immunoprecipitation.
Figure 3:
Figure 3:
Proteomic analysis of MST1-interacting proteins. (a) Venn diagram illustrating the overlap between APEX2 and IP-MS capture of MST1-interacting proteins. Biological processes analysis of MST1-binding proteins in (b) apoptosis, (c) autophagy, (d) pyroptosis, and (e) the common module. Top enriched GO terms are depicted as nodes, with node size indicating term enrichment significance (p<0.05 for each GO term).
Figure 4:
Figure 4:
Identification of significantly increased and decreased interacting proteins of MST1 in different cell death. Identification of significantly increased and decreased interacting proteins of MST1 in (a) apoptosis, (b) autophagy and (c) pyroptosis. (d) Protein interaction networks based on STRING database in three death models (purple, autophagy; green, apoptosis and yellow, pyroptosis). (e) Summary of proteins and their associated molecular functions binding to MST1 during various cell death processes. Blue indicates significantly decreased proteins, red indicates significantly increased proteins, and gray represents the molecular functions of these proteins.
Figure 5:
Figure 5:
Subcellular localization of MST1-interacting proteins in different cell death. Subcellular localization of MST1-interacting proteins in (a) the common module, (b) apoptosis, (c) autophagy, and (d) pyroptosis. The WebGestalt analysis software was employed to generate volcano plots for visualization (p<0.05 for each GO term).

References

    1. Abnet CC, Arnold M, Wei WQ. Epidemiology of esophageal squamous cell carcinoma. Gastroenterology. 2018;154:360–73. doi: 10.1053/j.gastro.2017.08.023. - DOI - PMC - PubMed
    1. Sung H, Ferlay J, Siegel RL, Laversanne M, Soerjomataram I, Jemal A, et al. Global cancer statistics 2020: GLOBOCAN estimates of incidence and mortality worldwide for 36 cancers in 185 countries. CA Cancer J Clin. 2021;71:209–49. doi: 10.3322/caac.21660. - DOI - PubMed
    1. Cui J, Zhou Z, Yang H, Jiao F, Li N, Gao Y, et al. MST1 suppresses pancreatic cancer progression via ROS-induced pyroptosis. Mol Cancer Res. 2019;17:1316–25. doi: 10.1158/1541-7786.mcr-18-0910. - DOI - PubMed
    1. Wilkinson DS, Jariwala JS, Anderson E, Mitra K, Meisenhelder J, Chang JT, et al. Phosphorylation of LC3 by the Hippo kinases STK3/STK4 is essential for autophagy. Mol Cell. 2015;57:55–68. doi: 10.1016/j.molcel.2014.11.019. - DOI - PMC - PubMed
    1. Rawat SJ, Chernoff J. Regulation of mammalian Ste20 (Mst) kinases. Trends Biochem Sci. 2015;40:149–56. doi: 10.1016/j.tibs.2015.01.001. - DOI - PMC - PubMed

LinkOut - more resources