. 2024 Nov 27:15:1465185.
doi: 10.3389/fimmu.2024.1465185. eCollection 2024.

The circadian clock gene BMAL1 modulates autoimmunity features in lupus

Affiliations

The circadian clock gene BMAL1 modulates autoimmunity features in lupus

Shuichiro Nakabo et al. Front Immunol. .

Abstract

Objectives: An important pathogenic role for neutrophils in systemic lupus erythematosus (SLE) has been proposed. Neutrophils that lack brain and muscle aryl hydrocarbon receptor nuclear translocator-like 1 (Bmal1), one of the clock genes, are defective in aging and proinflammatory responses. We assessed the role of Bmal1 in clinical and immunologic manifestations of murine lupus and in human SLE neutrophils.

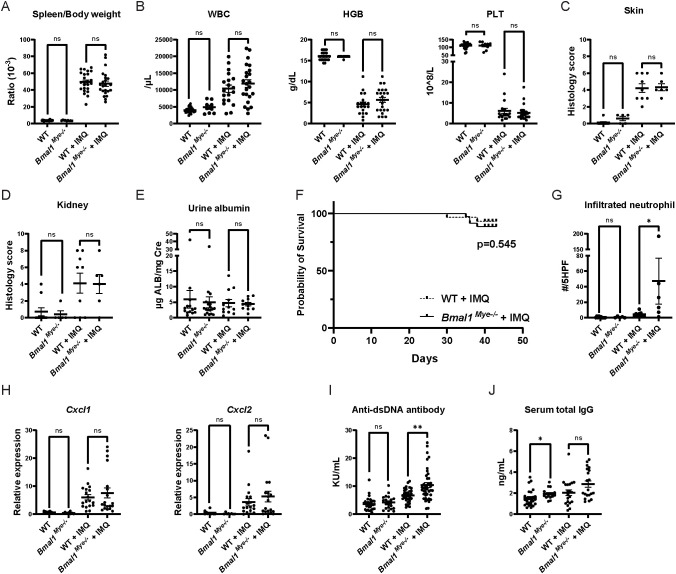
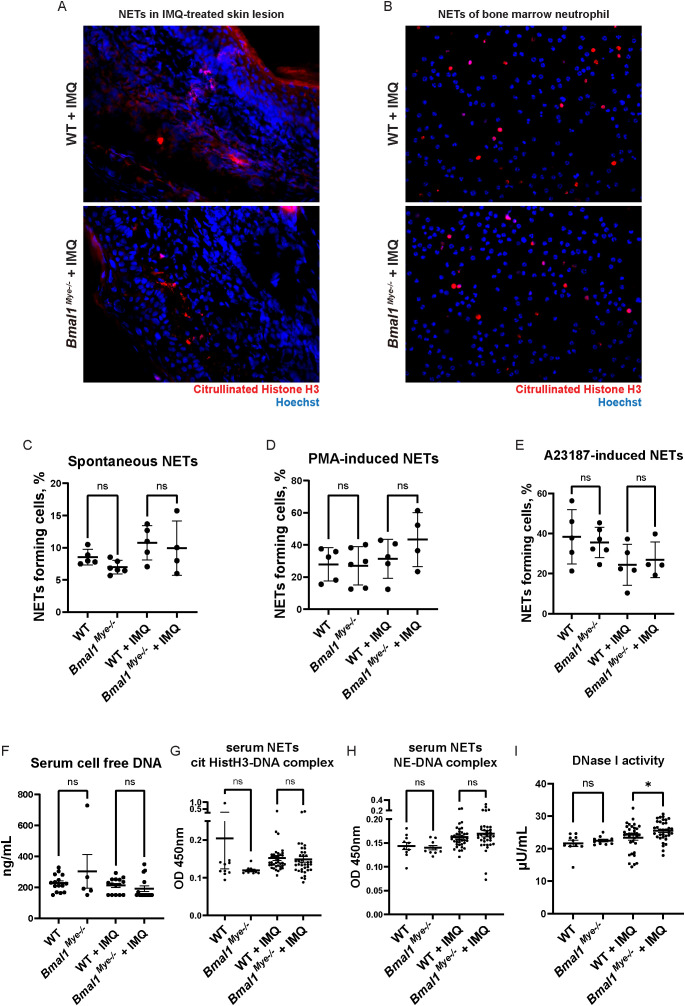
Methods: Myeloid-conditional Bmal1 knockout mice (Bmal1Mye-/- ) and wild type (WT) were treated with epicutaneous TLR7/8 agonist (imiquimod; IMQ) for 6 weeks to induce a lupus phenotype. Upon euthanasia, immune responses, autoantibodies and renal manifestations were evaluated. NET formation and gene expression of bone marrow (BM)-derived murine neutrophils were evaluated. BMAL1 expression was quantified in SLE neutrophils and compared with clinical disease.

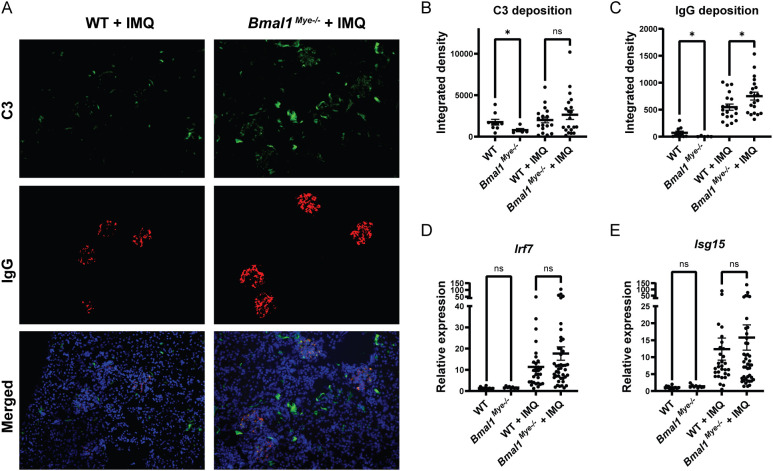
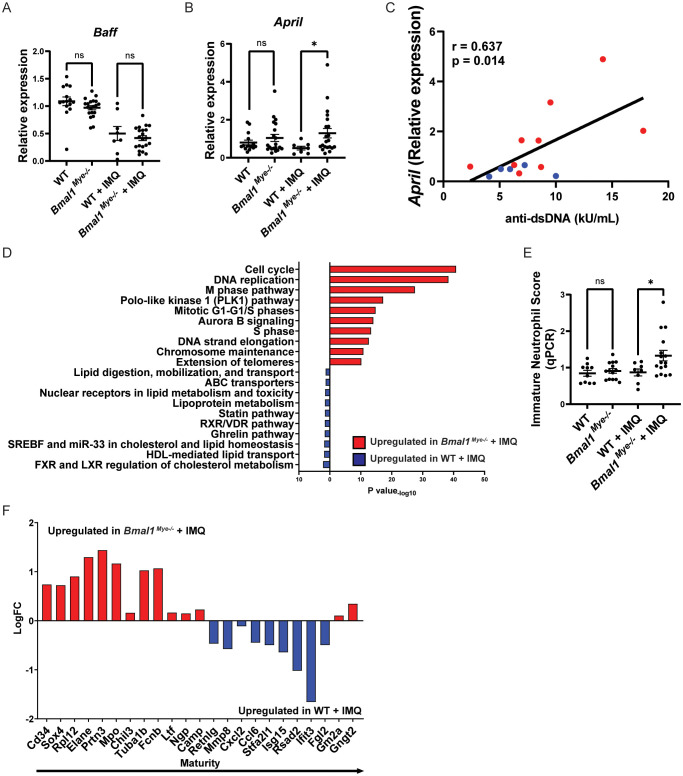
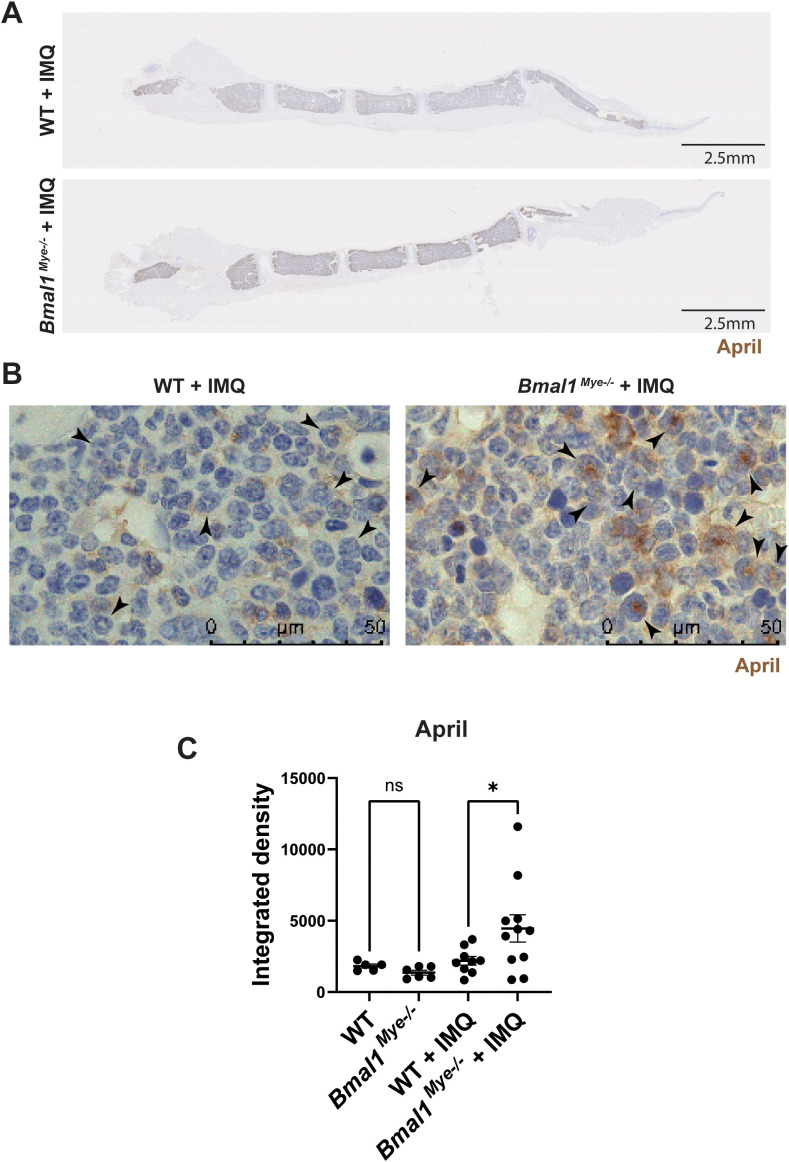
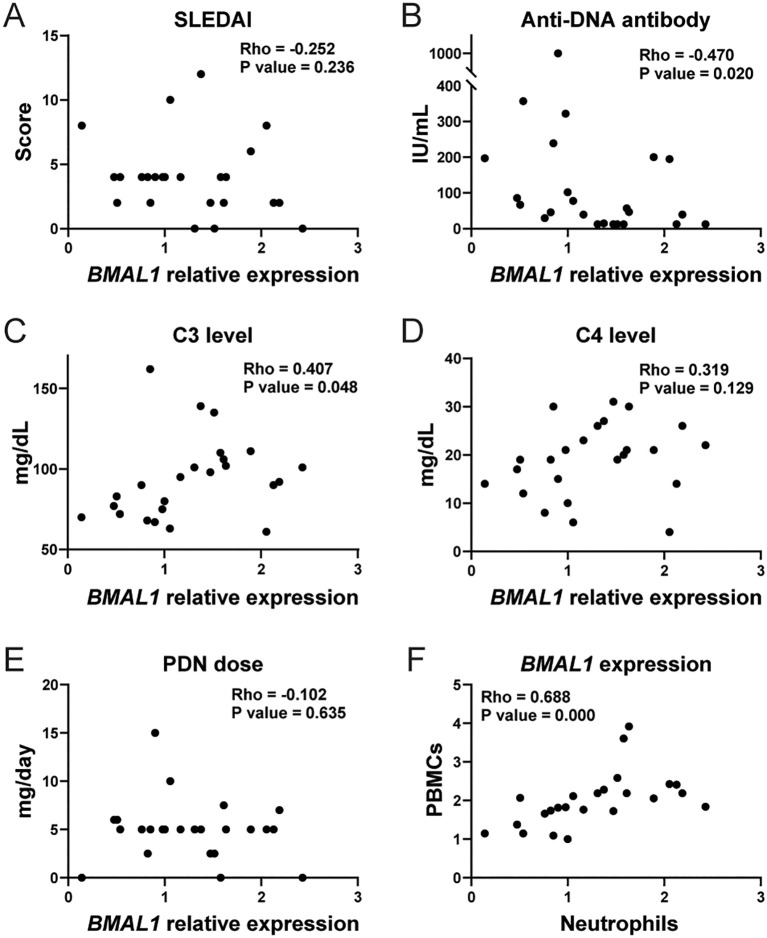
Results: IMQ-treated Bmal1Mye-/- and WT displayed comparable systemic inflammation. While renal function did not differ, serum anti-dsDNA levels and renal immune complex deposition were significantly increased in Bmal1Mye-/- . While no differences were observed in NET formation, expression levels of April in BM neutrophils were significantly higher in Bmal1Mye-/- . Bulk RNA-sequence data showed that BM neutrophils in IMQ-treated Bmal1Mye-/- were relatively immature when compared with IMQ-treated WT. BM showed an enhanced April protein expression in Bmal1Mye-/- mice. BMAL1 levels in human SLE peripheral blood neutrophils correlated positively with serum C3 and negatively with serum anti-dsDNA levels.

Conclusion: Bmal1 is associated with lower disease activity in SLE. These results indicate that perturbation in the circadian rhythm of neutrophils can have pathogenic consequences in SLE.

Keywords: April; Bmal1; autoantibody; clock gene; neutrophils; systemic lupus erythematosus.


Conflict of interest statement

The authors declare that the research was conducted in the absence of any commercial or financial relationships that could be construed as a potential conflict of interest.

Figures

Figure 1
Figure 1
Lupus phenotype triggered by imiquimod in Bmal1Mye−/− and WT mice. (A) Spleen weight corrected by body weight in untreated and imiquimod (IMQ)-treated wild type (WT) and Bmal1Mye−/− mice. WT; n=25, Bmal1Mye−/− ; n=9, WT + IMQ; n=24, Bmal1Mye−/− + IMQ; n=23. (B) Complete blood count (CBC) of peripheral blood. WT; n=25, Bmal1Mye−/− ; n=9, WT + IMQ; n=24, Bmal1Mye−/− + IMQ; n=23. (C, D) Histology inflammation score in skin and kidney, respectively. WT; n=10, Bmal1Mye−/− ; n=5, WT + IMQ; n=9, Bmal1Mye−/− + IMQ; n=6. (E) Urine albumin/creatinine ratio. WT; n=14, Bmal1Mye−/− ; n=18, WT + IMQ; n=12, Bmal1Mye−/− + IMQ; n=11. (F) Survival rates analyzed by the Kaplan–Meier curve. WT + IMQ; n=29, Bmal1Mye−/− + IMQ; n=35. (G) Number of neutrophils per five high-power fields (HPF) of H&E staining in lesional skin. WT; n=10, Bmal1Mye−/− ; n=5, WT + IMQ; n=9, Bmal1Mye−/− + IMQ; n=6. (H) Chemokine expression levels in skin (ear) lesion. Expression levels of the C–X–C motif chemokine ligand (Cxcl) 1 and Cxcl2 were assessed by qPCR. WT; n=10, Bmal1Mye−/− ; n=8, WT + IMQ; n=18, Bmal1Mye−/− + IMQ; n=19. (I, J) Serum concentration of anti-ds DNA and total IgG, respectively. WT; n=25, Bmal1Mye−/− ; n=16, WT + IMQ; n=20, Bmal1Mye−/− + IMQ; n=20. Bars in the graphs represent mean + SEM. The statistical analysis was done using unpaired t-test for spleen weight, CBC, urine albumin, and qPCR and Mann–Whitney test for histology score, infiltrated neutrophil count, anti-ds DNA antibody, total IgG. Log-rank test was used for survival rate analysis. *p<0.05, **p<0.01, ns, not significant. WBC, white blood cell; HGB, hemoglobin; PLT, platelet.
Figure 2
Figure 2
Immune complex deposition and inflammatory response in kidneys are modulated by Bmal1. (A) Representative images of kidney immunofluorescent staining of immune complex deposition. C3 (green), IgG (red), and Hoechst (blue). (B, C) Fluorescent intensity of C3 and IgG, respectively, quantified by ImageJ software. WT; n=9, Bmal1Mye−/− ; n=5, WT + IMQ; n=19, Bmal1Mye−/− + IMQ; n=20. (D, E) Expression levels of interferon regulatory factor (Irf)7 (D) and interferon-stimulated gene (Isg)15 (E) were assessed by qPCR. WT; n=15, Bmal1Mye−/− ; n=9, WT + IMQ; n=30, Bmal1Mye−/− + IMQ; n=43. Bar graphs represent mean + SEM. The statistical analysis was done using unpaired t-test for qPCR results, and Mann–Whitney test for immune complex deposition. *p<0.05, ns, not significant.
Figure 3
Figure 3
NET forming activity and DNA antigen levels are not regulated by Bmal1. (A) NETs in IMQ-treated local skin lesion. Frozen sections of imiquimod-treated ears were stained with anti-citrullinated histone H3 antibody (red) and Hoechst (blue). (B) Immunofluorescent staining of spontaneous NET formation of bone marrow neutrophils. Neutrophils were incubated on cover slips in serum-free RPMI media for 3h. NETs were stained with anti-citrullinated histone H3 antibody (red), and intra- and extracellular DNA was counterstained by Hoechst (blue). (C–E) Quantification of NETs with semi-automated live cell imaging method. Bone marrow neutrophils were incubated in serum-free RPMI media with or without stimulation. The percentage of cells externalizing NETs was calculated at 5 hours (C; spontaneous NETs, D; PMA-induced NETs) and 3 hours (E; A23187-induced NETs). WT; n=5, Bmal1Mye−/− ; n=6, WT + IMQ; n=5, Bmal1Mye−/− + IMQ; n=4. (F) Cell-free DNA in mouse serum. WT; n=15, Bmal1Mye−/− ; n=5, WT + IMQ; n=15, Bmal1Mye−/− + IMQ; n=15. (G, H) Serum NET complexes. cit HistH3-DNA complex (G) and NE-DNA complex (H) were quantified by sandwich ELISA. WT; n=10, Bmal1Mye−/− ; n=10, WT + IMQ; n=38, Bmal1Mye−/− + IMQ; n=37. (I) Serum DNase I activity. WT; n=10, Bmal1Mye−/− ; n=10, WT + IMQ; n=34, Bmal1Mye−/− + IMQ; n=34. Bars in the graphs represent mean + SEM. The statistical analysis was done using Mann–Whitney test. ns, not significant; WT, wild type; IMQ, imiquimod; NETs, neutrophil extracellular traps; PMA, phorbol-12-myristate-13-acetate; cit HistH3, citrullinated histone H3; NE, neutrophil elastase. *p<0.05.
Figure 4
Figure 4
April expression and maturation status of neutrophils and their modulation by Bmal1. (A, B) mRNA expression of Baff and April in bone marrow neutrophils, evaluated by qPCR. WT; n=15, Bmal1Mye−/− ; n=20, WT + IMQ; n=8, Bmal1Mye−/− + IMQ; n=21. (C) Correlation between April mRNA expression in bone marrow neutrophils and serum anti-dsDNA levels in IMQ-treated mice. WT + IMQ (blue dot); n=5, Bmal1Mye−/− + IMQ (red dot); n=9. (D) Pathway enrichment analysis of IMQ-treated WT and Bmal1Mye−/− . (E) Immature neutrophil score in bone marrow neutrophils calculated based on relative expression of 7 genes (Mpo, Elane, Bpi, Ctsg, Prtn3, Camp, and Defa4) analyzed by qPCR. WT; n=10, Bmal1Mye−/− ; n=14, WT + IMQ; n=8, Bmal1Mye−/− + IMQ; n=16. (F) Expression pattern of genes that are representative of neutrophil maturation status. Genes associated with immaturity are on the left and those associated with mature status are on the right. Calculation was done with RPKM of each gene. Bars in the graphs represent mean ± SEM. The statistical analysis was done using unpaired t-test for qPCR and immature neutrophil score, and Pearson correlation coefficient for correlation analysis. *p<0.05, ns, not significant.
Figure 5
Figure 5
Immunohistochemistry staining for the expression of April in mouse bone marrow. (A) Representative lower magnification (0.82×) images of IMQ-treated WT and Bmal1Mye−/− sternum bone marrow. April was stained with anti-mouse April antibody. (B) Higher-magnification (100×) images. April expressed in immature neutrophils (arrowhead) is increased in IMQ-treated Bmal1Mye−/− . (C) April levels in whole bone marrow were quantified with ImageJ and compared. WT; n=5, Bmal1Mye−/− ; n=5, WT + IMQ; n=9, Bmal1Mye−/− + IMQ; n=11. The statistical analysis was done using Mann–Whitney test. *p<0.05, ns, not significant.
Figure 6
Figure 6
Correlation between clinical parameters and BMAL1 expression level in human SLE peripheral blood neutrophils. Correlation between BMAL1 mRNA expression in peripheral blood neutrophils from human SLE patients (n= 24) and SLEDAI (A), serum anti-ds DNA level (B), serum C3 level (C), serum C4 level (D), and daily dose of oral prednisone (PDN) (E). (F) Correlation between BMAL1 expression in peripheral blood mononuclear cells (PBMCs) and neutrophils. The statistical analysis was done using Spearman’s rank correlation coefficient for correlation analyses.

References

    1. Wigerblad G, Kaplan MJ. Neutrophil extracellular traps in systemic autoimmune and autoinflammatory diseases. Nat Rev Immunol. (2023) 23:274–88. doi: 10.1038/s41577-022-00787-0 - DOI - PMC - PubMed
    1. Palanichamy A, Bauer JW, Yalavarthi S, Meednu N, Barnard J, Owen T, et al. . Neutrophil-mediated IFN activation in the bone marrow alters B cell development in human and murine systemic lupus erythematosus. J Immunol. (2014) 192:906–18. doi: 10.4049/jimmunol.1302112 - DOI - PMC - PubMed
    1. Adrover JM, Del Fresno C, Crainiciuc G, Cuartero MI, Casanova-Acebes M, Weiss LA, et al. . A neutrophil timer coordinates immune defense and vascular protection. Immunity. (2019) 50:390–402.e10. doi: 10.1016/j.immuni.2019.01.002 - DOI - PubMed
    1. Zielinski MR, Systrom DM, Rose NR. Fatigue, sleep, and autoimmune and related disorders. Front Immunol. (2019) 10:1827. doi: 10.3389/fimmu.2019.01827 - DOI - PMC - PubMed
    1. Palma BD, Gabriel A, Jr., Colugnati FA, Tufik S. Effects of sleep deprivation on the development of autoimmune disease in an experimental model of systemic lupus erythematosus. Am J Physiol Regul Integr Comp Physiol. (2006) 291:R1527–32. doi: 10.1152/ajpregu.00186.2006 - DOI - PubMed

MeSH terms