. 2024 Nov;14(11):4858-4873.
doi: 10.1016/j.apsb.2024.08.021. Epub 2024 Aug 30.

PPAR α affects hepatic lipid homeostasis by perturbing necroptosis signals in the intestinal epithelium

Affiliations

PPAR α affects hepatic lipid homeostasis by perturbing necroptosis signals in the intestinal epithelium

Shufang Na et al. Acta Pharm Sin B. 2024 Nov.

Abstract

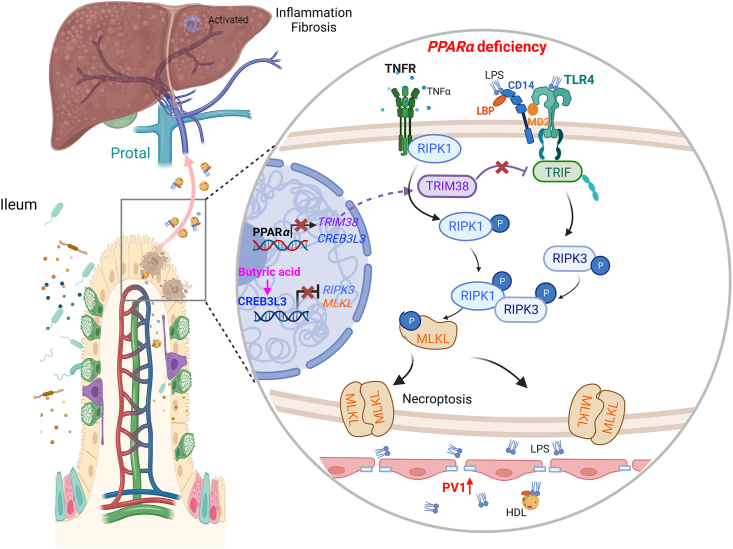
Rapid turnover of the intestinal epithelium is a critical strategy to balance the uptake of nutrients and defend against environmental insults, whereas inappropriate death promotes the spread of inflammation. PPARα is highly expressed in the small intestine and regulates the absorption of dietary lipids. However, as a key mediator of inflammation, the impact of intestinal PPARα signaling on cell death pathways is unknown. Here, we show that Pparα deficiency of intestinal epithelium up-regulates necroptosis signals, disrupts the gut vascular barrier, and promotes LPS translocation into the liver. Intestinal Pparα deficiency drives age-related hepatic steatosis and aggravates hepatic fibrosis induced by a high-fat plus high-sucrose diet (HFHS). PPARα levels correlate with TRIM38 and MLKL in the human ileum. Inhibition of PPARα up-regulates necroptosis signals in the intestinal organoids triggered by TNF-α and LPS stimuli via TRIM38/TRIF and CREB3L3/MLKL pathways. Butyric acid ameliorates hepatic steatosis induced by intestinal Pparα deficiency through the inhibition of necroptosis. Our data suggest that intestinal PPARα is essential for the maintenance of microenvironmental homeostasis and the spread of inflammation via the gut-liver axis.

Keywords: Butyric acid; Gut–liver axis; Intestine; LPS; Liver; NAFLD; Necroptosis; PPARα.


Conflict of interest statement

The authors declare no conflicts of interest.

Figures

Image 1
Graphical abstract
Figure 1
Figure 1
Pparα deficiency in intestinal epithelium promotes hepatic steatosis and mitochondria dysfunction in mice in a fed state. (A) Representative images of liver tissue stained with H&E and Oil Red O (n = 5). (B) Body weight of mice (n = 8). (C) Body weight, liver weight, and the length of the small intestine in 8-week-old mice (n = 20). (D) Triglyceride in serum and liver (n = 10). (E) Glycerol in serum and liver from 8-week-old mice (n = 10). (F) Cholesterol in serum and liver from 8-week-old mice (n = 10). (G) ALT, and AST in serum from 8- week-old mice (n = 10). (H) Relative mRNA levels of genes related with lipolysis, lipogenesis, and lipid droplet proteins in the liver from 8-week-old mice (n = 5). (I) GSEA analysis showing the changes in mitochondrial components in the liver from 8-week-old PparαΔIE mice (n = 3). (J) Relative mRNA levels of genes related with mitochondrial components in the liver from 8-week-old mice (n = 5). (K) Transmission electron microscopy images of hepatocytes from 24-week-old mice (n = 3). (L) Heatmap representation of hepatic genes related with mitochondrial protein complex and matrix in 8-week-old PparαΔIE relative to Pparαfl/fl (n = 3). LD: lipid droplet; M: mitochondria. Data are shown as the mean ± SD. An unpaired two-tailed Student's t-test; ∗P < 0.05, ∗∗P < 0.01, ∗∗∗P < 0.001.
Figure 2
Figure 2
Pparα deficiency in intestinal epithelium promotes hepatic steatosis and fibrosis in mice fed a high-fat plus high-sucrose diet (HFHS). (A) Schematic representation of HFHS experimental design. (B) Representative images of liver tissue stained with H&E and Oil Red O after short-term HFHS treatment (n = 5). (C) Relative mRNA levels of Col1a1, β-Pdgfr, Tgf-β, and Timp-1 in the liver after short-term HFHS treatment (n = 5). (D) Relative mRNA levels of F4/80, Clec4f, and Cd14 in the liver after short-term HFHS treatment (n = 5). (E) Body weight of mice after long-term HFHS treatment (n = 15). (F) Liver weight of mice after long-term HFHS treatment (n = 15). (G) The length of the small intestine after long-term HFHS treatment (n = 15). (H) Serum endotoxin levels after long-term HFHS treatment (n = 15). (I) The endotoxin levels in the liver after long-term HFHS treatment (n = 15). (J) Relative mRNA levels of F4/80, Clec4f, and Cd14 in the liver after short-term HFHS treatment (n = 5). (K) Relative mRNA levels of Col1a1, β-Pdgfr, Tgf-β, and Timp1 in the liver after the HFHS treatment for 16 weeks (n = 5). (L) Representative images of liver tissue stained with H&E, Oil Red O, and Masson's trichrome and immunohistochemical staining for α-SMA and TGF-β after long-term HFHS treatment (n = 5). (M) Levels of α-SMA and TGF-β were quantified using Image J software and expressed as AODs. Data are shown as the mean ± SD. For the two groups, statistical significance was tested by unpaired Student's t-test; for more than two groups, statistical significance was tested by one-way ANOVA followed by the least significant difference (LSD) test; ∗P < 0.05, ∗∗P < 0.01, ∗∗∗P < 0.001.
Figure 3
Figure 3
Pparα deficiency in intestinal epithelium activates inflammatory signaling pathways in both the ileum and liver. (A) Endotoxin in serum and liver (n = 10). (B) Immunofluorescent staining of F4/80 (red) in the liver of 8-week-old mice (n = 5). (C) Protein levels of F4/80 in the liver of 8-week-old mice (n = 3). (D) Relative mRNA levels of F4/80, Clec4f, and Cd14 in the liver of 8-week-old mice (n = 5). (E) Relative mRNA levels of Il-1β and Tnf-α in the liver of 8-week-old mice (n = 5). (F) Relative mRNA levels of Lbp in the liver of 8-week-old mice (n = 5). (G) Representative H&E staining, immunohistochemical staining for AP, and immunofluorescent staining for CD14 (green) in the ileum of 8-week-old mice (n = 5). (H) Protein levels of CD14 and relative mRNA levels of Lbp and CD14 in the ileum of 8-week-old mice (n = 5). (I) Enrichment graph of NOD-like receptor signaling dataset performed with ileum samples from 8-week-old PparαΔIE mice (n = 3). (J) Heatmap representation of genes involved in innate antibacterial defense in 8-week-old PparαΔIE ileum relative to Pparαfl/fl (n = 3). (K) Relative mRNA levels of Defa21, Defa22, Defa3, Defa5, and Reg3β in the ileum from 8-week-old mice (n = 5). (L) Schematic representation of high-fructose corn syrup (HFCS) experimental design. (M) Representative images stained with H&E and Oil Red O, and immunofluorescent staining for F4/80 (red) in liver tissue from 8-week-old mice exposed to HFCS for 14 days (n = 5). (N) Representative H&E image and immunohistochemical staining for AP in the ileum of 8-week-old mice exposed to HFCS for 14 days (n = 5). (O) Serum endotoxin levels in 8-week-old mice exposed to HFCS for 14 days (n = 8). AP: alkaline phosphatase staining. Data are shown as the mean ± SD. An unpaired two-tailed Student's t-test; ∗P < 0.05, ∗∗P < 0.01, ∗∗∗P < 0.001.
Figure 4
Figure 4
Pparα deficiency in intestinal epithelium increases the translocation of gut-derived antigens into the liver. (A) Intestinal permeability assessment (FITC-dextran, 4 kD) in 8-week-old mice (n = 10). (B) Relative mRNA levels of Zo-1 and Cldn8 in the ileum from 8-week-old mice (n = 5). (C) The relative proportion of bacterial species in the cecum content by 16S rRNA gene sequencing (n = 6). (D) Bugbase phenotypic prediction of gut microbiota in 8-week-old mice (n = 6). (E) The mRNA and protein levels of PV1 in the ileum of 8-week-old mice (n = 5). (F) Transmission electron microscopy images of the diaphragm (red star) in the capillaries from ileum sections in 24-week-old mice (n = 3). (G) Representative images of fluorescence microscopy and transmission electron in 8-week-old mice treated with FITC-LPS (green) or Au-LPS (n = 3–5). (H) Portal HDL-C levels in 8-week-old mice (n = 10). (I) The protein levels of APOA1 and ABCA1 in the ileum of 8-week-old mice (n = 5). (J) Relative mRNA levels of Apoa1, Pon1, and Pon3 in the ileum of 8-week-old mice (n = 5). (K) Serum APOA1 levels in 8-, 16- and 32-week-old mice (n = 8–10). (L) Serum APOA1 levels in 8-week-old mice exposed to HFCS for 14 days (n = 8). (M) Serum APOA1 levels in 16-week-old PparαΔhep mice (n = 10). (N) Schematic representation of a cocktail of broad-spectrum antibiotics (Abx) experimental design. (O) Representative images stained with H&E and Oil Red O, and immunofluorescent staining for F4/80 (red) in the liver from 8-week-old mice treated with Abx (n = 5). (P) Triglyceride in serum and liver treated with Abx (n = 10). (Q) Relative mRNA levels of genes related to triglyceride accumulation in the liver from 8-week-old mice treated with Abx (n = 5). (R) Hepatic levels of cytokines from 8-week-old mice treated with Abx (n = 5). (S) Protein levels of F4/80 in the liver of 8-week-old mice treated with Abx (n = 3). (T) Relative mRNA levels of F4/80, Clec4f, and Cd14 in the liver of 8-week-old mice treated with Abx (n = 5). LD: lipid droplet; M: mitochondria; FITC-LPS: fluorescein isothiocyanate (FITC)-LPS; Au-LPS: LPS-gold-complexes. Data are shown as the mean ± SD. An unpaired two-tailed Student's t-test; ∗∗P < 0.01, ∗∗∗P < 0.001.
Figure 5
Figure 5
Pparα deficiency in intestinal epithelium up-regulates the necroptosis signaling pathway in the ileum from 8-week-old mice. (A) Representative TUNEL staining, immunohistochemical staining for IL-1β, NLRP3, cleaved-caspase 3, TRIF, and MLKL, and immunofluorescent staining for FADD (green), cleaved-caspase 8 (green), p-RIPK3 (red), p-MLKL (red), and TRIM38 (green) in the ileum (n = 5). (B) Transmission electron microscopy images of epithelial cells in the ileum from 24-week-old mice (n = 3). (C) Enrichment graph of necroptosis signaling dataset performed with ileum samples (n = 3). (D) Relative mRNA levels of genes related to apoptosis and necroptosis in ileum samples (n = 5). (E) Schematic representation of the experimental design using ileum organoid cultures from 8-week-old mice. (F) Immunofluorescent staining of apoptotic and necroptosis signaling components in organoid cultures (n = 5). (G) Immunofluorescent assay in ileum organoids treated with TNF-α and LPS (n = 5). (H) Spearman's method was used to analyze the correlation between PPARα expression and TRIM38 level in human ileum microarray (n = 7). (I) TRIM38 promoter-driven luciferase activity in human intestinal epithelial HIEC-6 cells (n = 3). (J) Relative PPARα mRNA levels in mouse ileum (n = 5). (K) Representative immunohistochemical staining for PPARα in mouse ileum (n = 5). cleaved-CASP3: cleaved-caspase 3; cleaved-CASP8: cleaved-caspase 8. Data are shown as the mean ± SD. For the two groups, statistical significance was tested by unpaired Student's t-test; for more than two groups, statistical significance was tested by one-way ANOVA followed by the least significant difference (LSD) test; ∗P < 0.05, ∗∗P < 0.01, ∗∗∗P < 0.001.
Figure 6
Figure 6
Butyric acid attenuates PPARα-induced necroptosis in HIEC-6 cells and ameliorates hepatic steatosis in PparαΔIE mice. (A) Relative CREB3L3 mRNA level in HIEC-6 cells transfected with the PPARα expression vector (n = 3). (B) Relative mRNA level of apoptotic and necroptosis signaling components in HIEC-6 cells transfected with the CREB3L3 expression vector (n = 3). (C) Relative mRNA level of apoptotic and necroptosis signaling components in HIEC-6 cells treated with TNF-α (n = 3). (D) Effects of GW6471 on RIPK3 and MLKL promoter-driven luciferase activities in human intestinal epithelial HIEC-6 cells (n = 3). (E) Relative CREB3L3 mRNA level in HIEC-6 cells treated with butyric acid (n = 3). (F) Relative mRNA level of necroptosis signaling components in HIEC-6 cells treated with TNF-α and butyric acid (n = 3). (G) Schematic representation of the experimental design for butyric acid treatment. H, Relative CREB3L3 mRNA level in Pparαfl/fl and PparαΔIE mice treated with butyric acid (n = 5). (I) Relative mRNA level of necroptosis signaling components in PparαΔIE mice treated with butyric acid (n = 5). (J) Representative immunohistochemical staining for cleaved-caspase 3 and MLKL, and immunofluorescent staining for cleaved-caspase 8 (green), p-RIPK3 (red), and p-MLKL (red) in the ileum after butyric acid treatment (n = 5). (K) Representative images stained with H&E and Oil Red O, and immunofluorescent staining for F4/80 (red) in liver tissue after butyric acid treatment (n = 5). (L) Relative mRNA levels of genes related with lipolysis, lipogenesis, and lipid droplet proteins in the liver after butyric acid treatment (n = 5). (M) Triglyceride in serum and liver after butyric acid treatment (n = 10). (N) Hepatic levels of cytokines in mice after butyric acid treatment (n = 5). (O) Protein levels of F4/80 in the liver after butyric acid treatment (n = 3). (P) Relative mRNA levels of F4/80, Clec4f, and Cd14 in the liver after butyric acid treatment (n = 5). Buty: butyric acid. Data are shown as the mean ± SD. For the two groups, statistical significance was tested by unpaired Student's t-test; for more than two groups, statistical significance was tested by one-way ANOVA followed by the least significant difference (LSD) test; ∗P < 0.05, ∗∗P < 0.01, ∗∗∗P < 0.001.
Figure 7
Figure 7
A model for the role of intestinal PPARα in maintaining microenvironmental homeostasis. PPARα deficiency up-regulates necroptosis signals in the ileum via TRIM38/TRIF and CREB3L3/MLKL pathways and promotes the spread of inflammation through gut–liver axis. Butyric acid may play a protective role against hepatic steatosis caused by PPARα deficiency of intestinal epithelium via the up-regulation of CREB3L3.

References

    1. Zou Z.Y., Shen B., Fan J.G. Systematic review with meta-analysis: epidemiology of nonalcoholic fatty liver disease in patients with inflammatory bowel disease. Inflamm Bowel Dis. 2019;25:1764–1772. - PubMed
    1. Rigano D., Sirignano C., Taglialatela-Scafatin O. The potential of natural products for targeting PPARα. Acta Pharm Sin B. 2017;7:427–438. - PMC - PubMed
    1. Bunger M., van den Bosch H.M., van der Meijde J., Kersten S., Hooiveld G.J., Muller M. Genome-wide analysis of PPARalpha activation in murine small intestine. Physiol Genomics. 2007;30:192–204. - PubMed
    1. Stojanovic O., Altirriba J., Rigo D., Spiljar M., Evrard E., Roska B., et al. Dietary excess regulates absorption and surface of gut epithelium through intestinal PPARalpha. Nat Commun. 2021;12:7031. - PMC - PubMed
    1. Dubuquoy L., Rousseaux C., Thuru X., Peyrin-Biroulet L., Romano O., Chavatte P., et al. PPARgamma as a new therapeutic target in inflammatory bowel diseases. Gut. 2006;55:1341–1349. - PMC - PubMed

LinkOut - more resources