. 2024 Nov 22;20(15):6255-6278.
doi: 10.7150/ijbs.100113. eCollection 2024.

Extracellular Vesicles from Human Induced Pluripotent Stem Cells Exhibit a Unique MicroRNA and CircRNA Signature

Affiliations

Extracellular Vesicles from Human Induced Pluripotent Stem Cells Exhibit a Unique MicroRNA and CircRNA Signature

Mario Barilani et al. Int J Biol Sci. .

Abstract

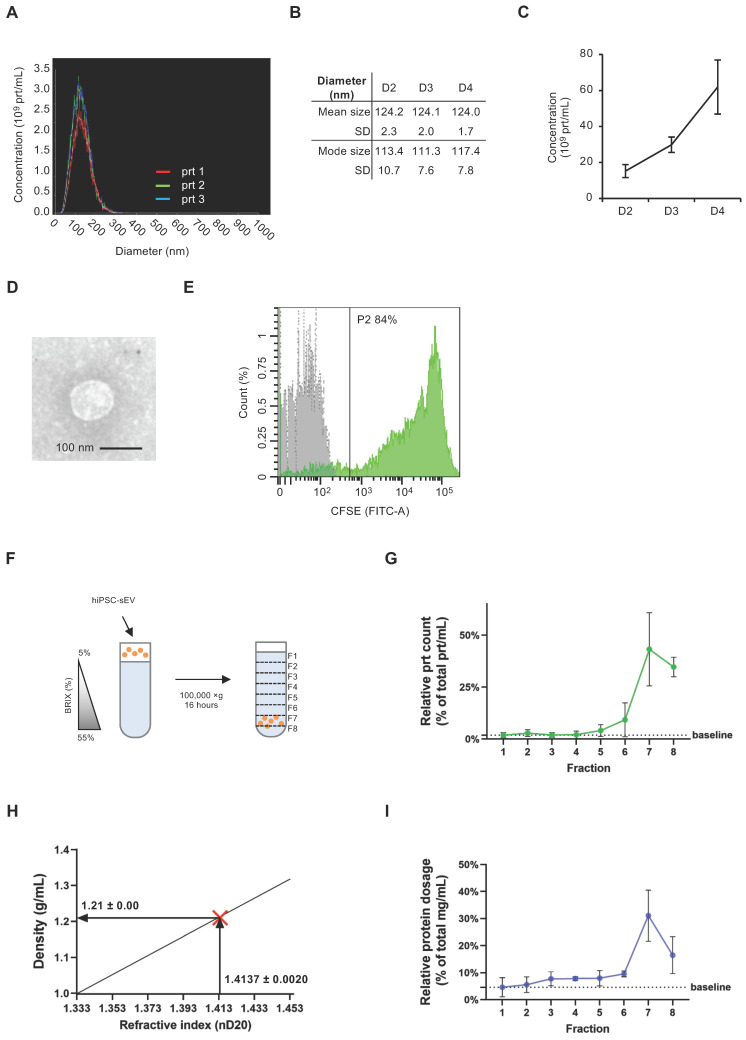
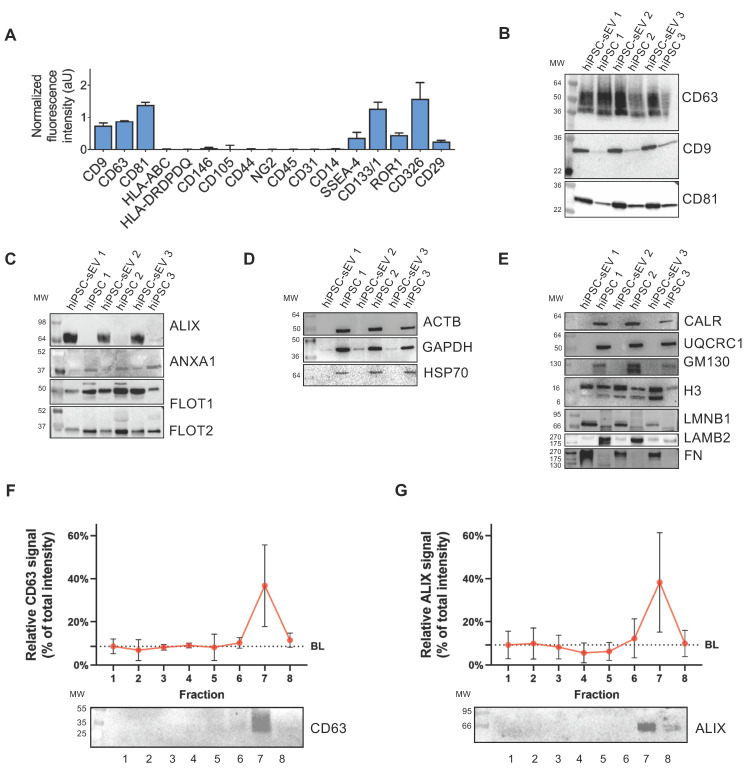
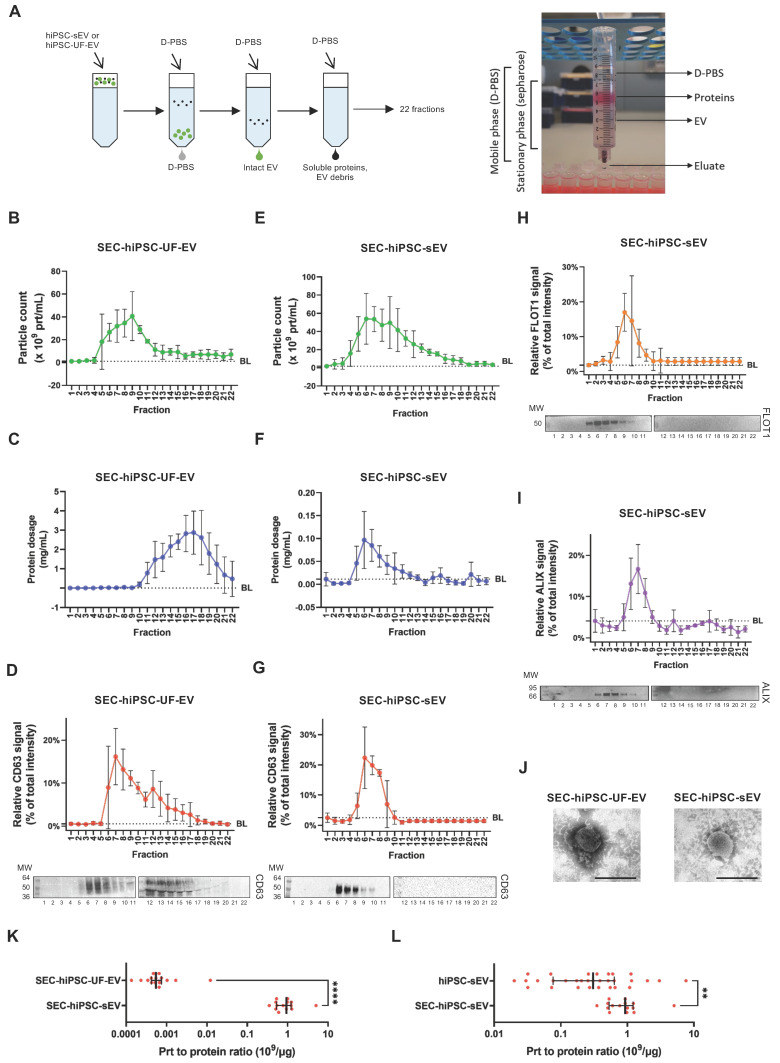
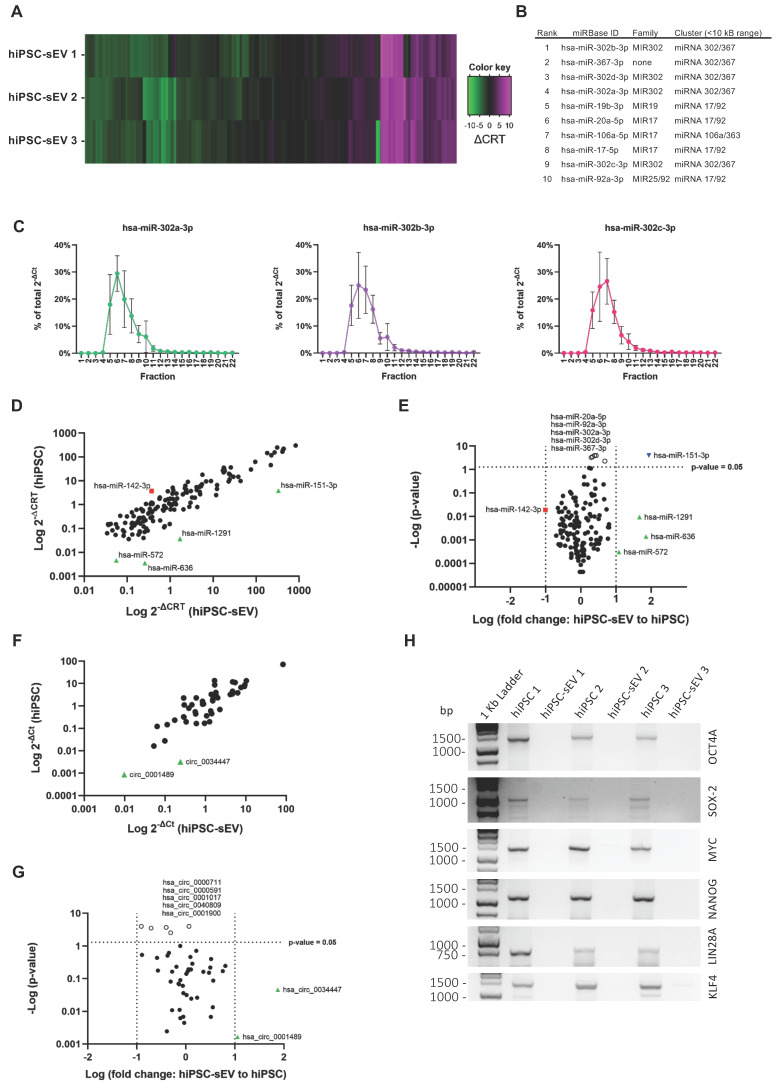
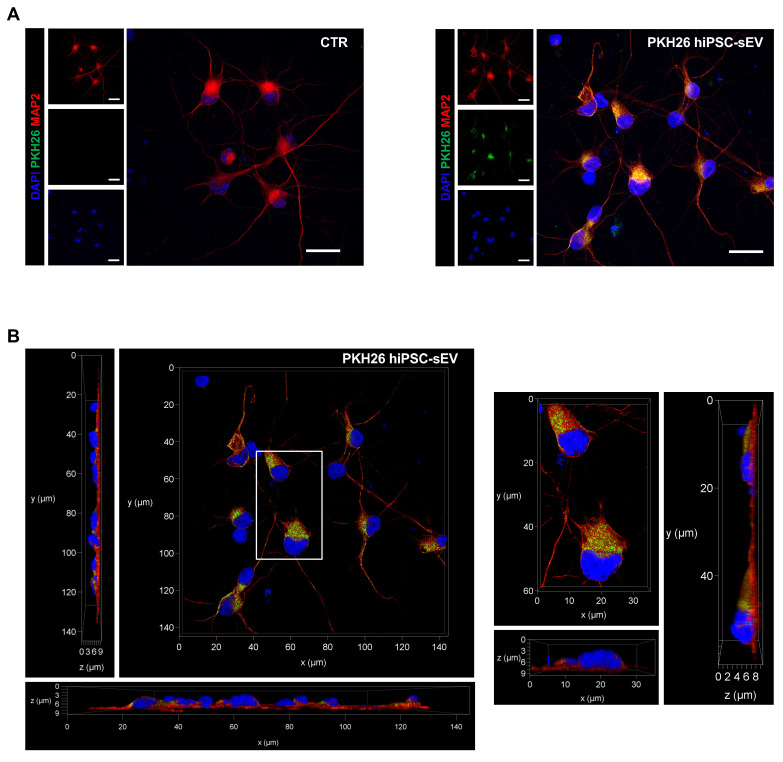
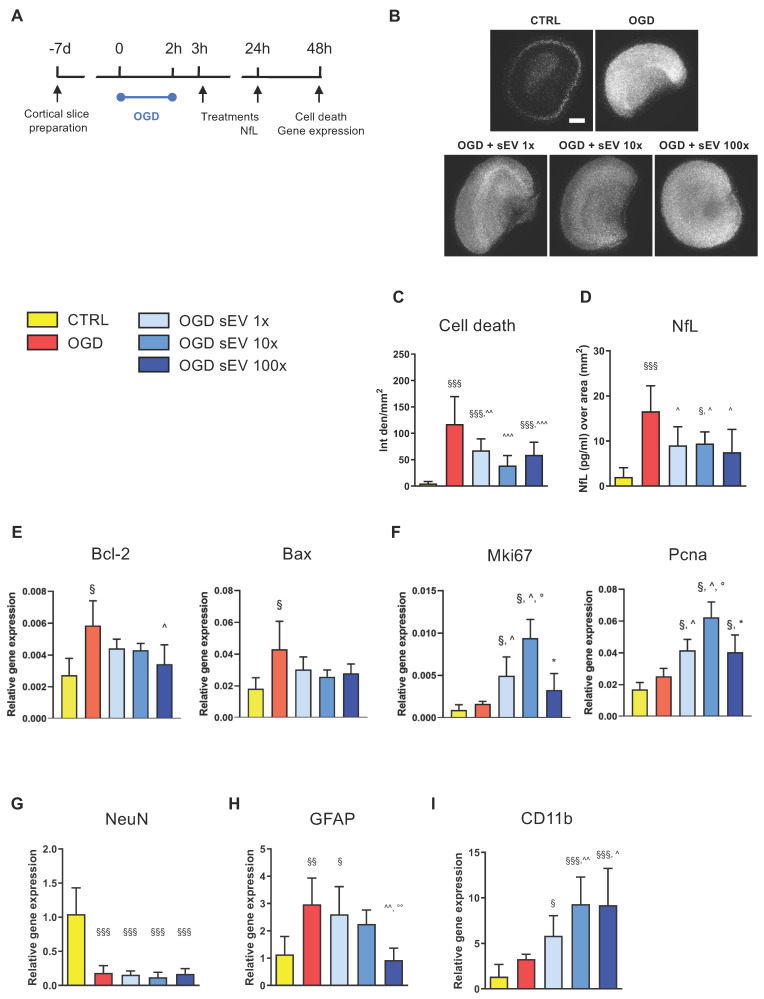
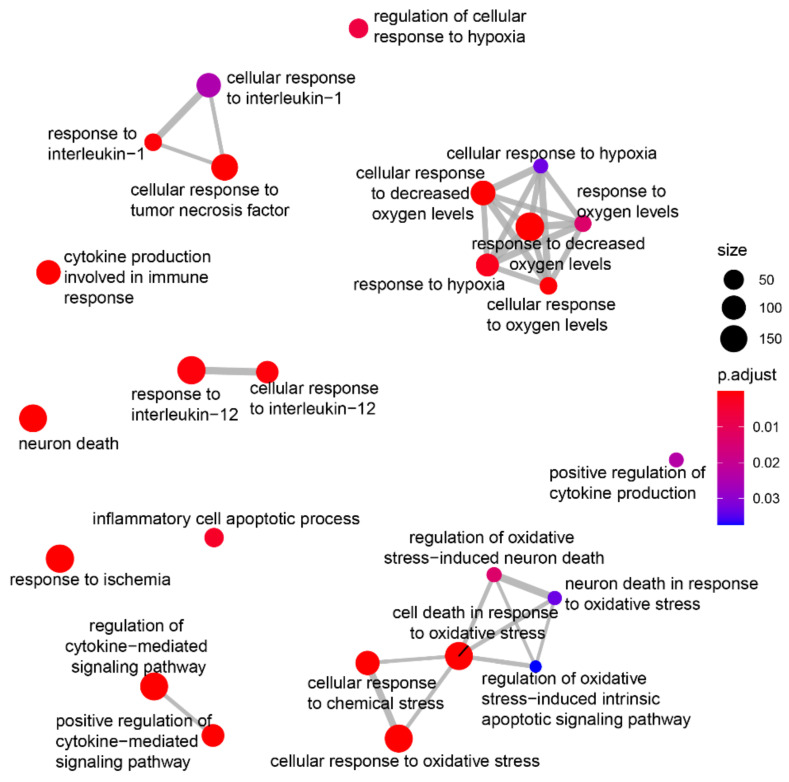
Extracellular vesicles (EV) have emerged as promising cell-free therapeutics in regenerative medicine. However, translating primary cell line-derived EV to clinical applications requires large-scale manufacturing and several challenges, such as replicative senescence, donor heterogeneity, and genetic instability. To address these limitations, we used a reprogramming approach to generate human induced pluripotent stem cells (hiPSC) from the young source of cord blood mesenchymal stem/stromal cells (CBMSC). Capitalizing on their inexhaustible supply potential, hiPSC offer an attractive EV reservoir. Our approach encompassed an exhaustive characterization of hiPSC-EV, aligning with the rigorous MISEV2023 guidelines. Analyses demonstrated physical features compatible with small EV (sEV) and established their identity and purity. Moreover, the sEV-shuttled non-coding (nc) RNA landscape, focusing on the microRNA and circular RNA cargo, completed the molecular signature. The kinetics of the hiPSC-sEV release and cell internalization assays unveiled robust EV production and consistent uptake by human neurons. Furthermore, hiPSC-sEV demonstrated ex vivo cell tissue-protective properties. Finally, via bioinformatics, the potential involvement of the ncRNA cargo in the hiPSC-sEV biological effects was explored. This study significantly advances the understanding of pluripotent stem cell-derived EV. We propose cord blood MSC-derived hiPSC as a promising source for potentially therapeutic sEV.

Keywords: circRNA; cord blood; exosomes; extracellular vesicles; human-induced pluripotent stem cells; miRNA; nanoparticles.


Conflict of interest statement

Competing Interests: The method for generating human-induced pluripotent stem cells from long-lived cord blood multipotent mesenchymal stromal cells and their use as a source of extracellular vesicles is part of a technology developed by Prof. Lorenza Lazzari and Dr. Mario Barilani. The patent has been granted in Italy (number 102017000141245 on 04/03/2020). The applications for patents in Europe (number EP3720454), US (number US20210161967), and Australia (number AU2018378427) have been filed.

Figures

Figure 1
Figure 1
Human induced pluripotent stem cells release small extracellular vesicles. Overlayed histograms (A) show size distribution profile of particles released by hiPSC (n=3). Table (B) and scatter plot (C) represent mean, mode size and concentration of hiPSC particles (n=3) released during four days of culture (D2, D3, D4) as mean and standard deviation (SD). Representative TEM image (D) shows morphology and size of sEV released by hiPSC; scale bar is 100 nm. Histogram in (E) shows overlayed fluorescent signal from unlabeled (grey) and CFSE+ (green) hiPSC-sEV. Scheme (F) summarizes the protocol implemented for SDG separation of hiPSC-sEV. Plot in (G) reports the relative particle count calculated as percentage (%) of total prt/mL values for each fraction of the SDG; mean and SD are represented (n=3). Plot in (H) visually shows the estimation of hiPSC-sEV density starting from their refractive index, using the formula y=2.6564x-2.5421 (calculated based on standard conversion tables); hiPSC-sEV are indicated by the red X mark: vertical arrow pinpoints hiPSC-sEV refractive index, horizontal arrow pinpoints hiPSC-sEV density. Plot in (I) reports the relative protein dosage calculated as % of total protein concentration values for each fraction of the SDG; mean and SD are represented (n=3). Abbreviations: BRIX, sugar content of aqueous solution in percentage (%); D, days; F, fraction; hiPSC, human induced pluripotent stem cells; nD20, refractive index temperature compensated; P2, population 2 gate; prt, particles; SD, standard deviation; SDG, sucrose density gradient; TEM, transmission electron microscope; hiPSC-sEV, hiPSC-derived sEV.
Figure 2
Figure 2
hiPSC-derived extracellular vesicles are reminiscent of cell source and biogenesis pathway. Histograms in (A) show signal intensity determined by flow cytometry, in arbitrary units of protein markers on the surface of sEV released by hiPSC; mean and standard deviation (SD) are represented (n=3). Blots in (B-E) show western analysis comparisons between parental hiPSC and released hiPSC-sEV (n=3) for surface and luminal protein markers. In particular: EV surface non-cell-specific markers (B), cytosolic EV-specific (C) and non-EV-specific markers (D), other intracellular compartments markers (E). Image (F): upper panel shows signal intensity distribution of a sEV protein surface marker as detected by western analysis after separation by SDG (n=3; mean and SD are represented); lower panel is a representative blot. Image (G): upper panel shows signal intensity distribution of a sEV protein luminal marker as detected by western analysis after separation by SDG (n=3; mean and SD are represented); lower panel is a representative blot. Abbreviations: AU: arbitrary units; BL: baseline; hiPSC: human induced pluripotent stem cells; MW: molecular weight; SDG: sucrose density gradient; hiPSC-sEV: hiPSC-derived small extracellular vesicles.
Figure 3
Figure 3
Size-exclusion chromatography pinpoints integrity of pure hiPSC-derived extracellular vesicles. Scheme in (A) summarizes the protocol implemented for SEC together with a photo of the home-made SEC system implemented. Plots show distribution of particle count (B), protein dosage (C) and protein surface marker signal (D): upper panel for signal distribution; lower panel for representative blot) for a sample of hiPSC-UF-EV as detected by NTA after separation by SEC; mean and standard deviation (SD) are represented (n=3). Plots show distribution of particle count (E), protein dosage (F), protein surface (G) and luminal (H and I) marker signal (for (G), (H) and (I): upper panel for signal distribution; lower panel for representative blot) for a sample of hiPSC-sEV as detected by NTA after separation by SEC; mean and SD are represented (n=3). Representative TEM images (J) show morphology and size of SEC-hiPSC-UF-EV and SEC-hiPSC-sEV; scale bars are 200nm. Dot plot in (K) shows purity of SEC-hiPSC-UF-EV and SEC-hiPSC-sEV, evaluated as particles to protein ratio; median and interquartile range are represented (n=15 each); statistical analysis was by non-parametric Mann-Whitney test, ****p<0.0001. Dot plot (l) shows purity of hiPSC-sEV and SEC-hiPSC-sEV, evaluated as particles to protein ratio; median and interquartile range are represented (n=25 for hiPSC-sEV; n=15 for SEC-hiPSC-sEV); statistical analysis was by non-parametric Mann-Whitney test, **p<0.01. Abbreviations: BL: baseline; MW:molecular weight; NTA: nanoparticle tracking analysis; prt, particles: sEV, small extracellular vesicles; SEC:size-exclusion chromatography; TEM: transmission electron microscope; hiPSC-sEV: hiPSC-derived sEV; hiPSC-UF-EV: hiPSC-derived ultrafiltration-processed EV.
Figure 4
Figure 4
hiPSC-derived extracellular vesicles shuttle a circRNA and stemness-associated miRNA cargo. Heatmap in (A) shows miRNome (n=3) of sEV released by hiPSC, reported as differential relative threshold values (∆CRT); differential incorporation into hiPSC-sEV is indicated by the color key. Table (B) lists hiPSC-sEV miRNome top ranked miRNA, indicating family and genomic cluster. Plots in (C) show relative abundance of selected top ranked miRNA for hiPSC-sEV samples, reported as percentage (%) of total 2-∆Ct values determined by qPCR after separation by SEC; mean and standard deviation (SD) are represented (n=3). Scatter plot in (D) shows the comparison between hiPSC (mean of n=3) and hiPSC-sEV (mean of n=3) miRNome in terms of differential expression reported as 2-∆CRT values determined by PCR-array (red square: miRNA underrepresented in hiPSC with a fold change > 1 Log; black dots: miRNA with fold changes within 1 Log; green triangles: miRNA overrepresented in hiPSC-sEV with a fold change > 1 Log). Volcano plot in (E) shows statistical significance of miRNome fold changes of hiPSC-sEV (mean of n=3) to hiPSC (mean of n=3) calculated from PCR-array 2-∆CRT values (red square: miRNA underrepresented in hiPSC with a fold change > 1 Log, but not statistically significant; black dots: miRNA with fold changes within 1 Log and not statistically significant; green triangles: miRNA overrepresented in hiPSC-sEV with a fold change > 1 Log, but not statistically significant; white dots: statistical significant miRNA, but with a fold change < 1 Log; blue inverted triangle: miRNA overrepresented in hiPSC-sEV with a fold change > 1 Log and statistically significant); statistical analysis was by Two-Way ANOVA followed by False Discovery Rate multiple comparisons post-hoc test. Scatter plot in (F) shows the comparison between hiPSC (mean of n=3) and hiPSC-sEV (mean of n=3) selected circRNA panel (n=46) in terms of differential expression reported as 2-∆Ct values determined by qPCR (black dots: circRNA with fold changes within 1 Log; green triangles: circRNA overrepresented in hiPSC-sEV with a fold change > 1 Log). Volcano plot in (G) shows statistical significance of circRNA fold changes of hiPSC-sEV (mean of n=3) to hiPSC (mean of n=3) calculated from qPCR 2-∆Ct values (black dots: circRNA with fold changes within 1 Log and not statistically significant; green triangles: circRNA overrepresented in hiPSC-sEV with a fold change > 1 Log, but not statistically significant; white dots: statistical significant circRNA, but with a fold change < 1 Log); statistical analysis was by Two-Way ANOVA followed by False Discovery Rate multiple comparisons post-hoc test. (H) Agarose gel showing comparison between parental hiPSC and hiPSC-sEV for the amplification of full-length mRNAs of OCT4, SOX2, MYC, NANOG, LIN28A and KLF4. Abbreviations: bp: base pairs; ∆CRT: differential relative threshold; hiPSC: human induced pluripotent stem cells; SEC: size-exclusion chromatography; hiPSC-sEV: hiPSC-derived small extracellular vesicles.
Figure 5
Figure 5
PKH26-labeled hiPSC-derived extracellular vesicles uptake on neuronal cells. Confocal images show representative fluorescent signals from DAPI (405, shown in blue), MAP2 (647, shown in red) and PKH26 (561, shown in green) of neuronal cells upon 24h incubation with PKH26-hiPSC-sEV. In (A) are shown two-dimensional projection of single and overlayed signals (objective 63X/1.30 GLYC); scale bars 20 µm. In (B) representative orthogonal views, xy, xz, yz (objective 63X/1.30 GLYC) displaying the intracellular presence of PKH26-hiPSC-EVs. Abbreviations: MAP2: microtubule-associated protein 2; hiPSC-sEV: hiPSC-derived small extracellular vesicles; GLYC: glycerol.
Figure 6
Figure 6
hiPSC-derived extracellular vesicles exert protective effects after acute brain injury. (A) Schematic representation of the experimental design used for the assessment of the ex vivo model of ischemic damage on organotypic brain slices. (B) Representative images of PI incorporation (bar = 500 μm) and (C) relative quantification. (D) Quantification of NfL release in the culture medium 24h after injury, as index of neuronal damage. (E-I) Real time RT-PCR analysis performed at 48h post-injury of genes involved in cell apoptosis (E, Bcl-2, Bax) and proliferation (F, Mki67, Pcna) or markers of neuronal (G, NeuN), astrocytic (H, GFAP) or microglia (I, CD11b) responses. Data are expressed as mean + SD. Statistical analysis was performed by one way ANOVA, followed by Tukey post-hoc test; §p<0.05, §§p<0.01, §§§p<0.001 vs CTR; ^p<0.05 vs OGD; °p<0.05 vs OGD + sEV 1×; * p<0.05 vs OGD + sEV 10×. Abbreviations: CTR: control; hiPSC: human induced pluripotent stem cells; hiPSC-sEV: hiPSC-derived small extracellular vesicles; NfL: neurofilament light chain; Bcl-2: B cell leukemia/lymphoma 2 protein; Bax: Bcl-2 associated protein x; Mki67: marker of proliferation ki 67; Pcna: proliferating cell nuclear antigen; NeuN: neuron specific nuclear protein; GFAP: glial fibrillary acidic protein; CD11b: cluster of differentiation molecule 11b; OGD: oxygen and glucose deprivation; SD: standard deviation.
Figure 7
Figure 7
hiPSC-derived extracellular vesicles circRNA biological role prediction. Plot showing manual selection of the GO biological processes enriched among the validated targets of the fifteen microRNAs predicted to interact with the most expressed circRNAs and expressed in the frontal lobe. Node size increases according to the number of validated targets related to each term and node color ranges from blue to red according to the adjusted pvalue. Edges thickness represents the percentage of genes in common among the different terms for overlaps greater than 20%.

References

    1. Keshtkar S, Azarpira N, Ghahremani MH. Mesenchymal stem cell-derived extracellular vesicles: novel frontiers in regenerative medicine. Stem Cell Res Ther. 2018;9:63. - PMC - PubMed
    1. Görgens A, Corso G, Hagey DW. et al. Identification of storage conditions stabilizing extracellular vesicles preparations. J Extracell Vesicles. 2022;11:e12238. - PMC - PubMed
    1. Yuan F, Li Y-M, Wang Z. Preserving extracellular vesicles for biomedical applications: consideration of storage stability before and after isolation. Drug Deliv. 2021;28:1501–9. - PMC - PubMed
    1. Mocchi M, Bari E, Marrubini G. et al. Freeze-Dried Mesenchymal Stem Cell-Secretome Pharmaceuticalization: Optimization of Formulation and Manufacturing Process Robustness. Pharmaceutics. 2021;13:1129. - PMC - PubMed
    1. KONALA VBR, MAMIDI MK, BHONDE R, DAS AK, POCHAMPALLY R, PAL R. The current landscape of the mesenchymal stromal cell secretome: A new paradigm for cell-free regeneration. Cytotherapy. 2016;18:13–24. - PMC - PubMed

MeSH terms