. 2024 Nov 11;20(15):6090-6113.
doi: 10.7150/ijbs.99859. eCollection 2024.

Repurposing of the Antipsychotic Trifluoperazine Induces SLC7A11/GPX4- Mediated Ferroptosis of Oral Cancer via the ROS/Autophagy Pathway

Affiliations

Repurposing of the Antipsychotic Trifluoperazine Induces SLC7A11/GPX4- Mediated Ferroptosis of Oral Cancer via the ROS/Autophagy Pathway

Sheng-Chieh Tsai et al. Int J Biol Sci. .

Abstract

Ferroptosis, a mode of cell death characterized by iron-dependent phospholipid peroxidation, has a substantial therapeutic potential for the treatment of various cancers. This study investigated the effects of trifluoperazine (TFP), an FDA-approved drug traditionally utilized for mental health disorder, on oral cancer cells, with a particular focus on the mechanisms involved in its potential anti-tumor properties. Our findings indicate that TFP significantly elevates the levels of lipid-derived reactive oxygen species (ROS) and induces ferroptotic cell death in oral cancer cells through pathways involving autophagy, the SLC7A11/GPX4 axis, and mitochondrial damage. Additionally, molecular docking analyses revealed that TFP acts as an inhibitor of GPX4. The elevated expression level of GPX4 in oral cancer biopsies was also found to correlate with a poor prognosis. Together, these results provide evidence that TFP selectively induces GPX4-mediated, autophagy-dependent ferroptosis, thereby exerting anti-cancer effects against oral cancer and preventable death.

Keywords: Autophagy; Ferroptosis; Oral Cancer; ROS; Trifluoperazine; mental disorder; preventable death.


Conflict of interest statement

Competing Interests: The authors have declared that no competing interest exists.

Figures

Figure 1
Figure 1
TFP induces cell death, inhibits proliferation, and causes G0/G1 phase arrest in human oral cancer cells. (A) Chemical structure of TFP. (B) Cell viability of the normal gingival fibroblast line HGF-1, and (C) OSCC cells (Ca9-22 and HSC-3) treated with various concentrations of TFP at different time points (24 h, 48 h and 72 h), was measured using the MTT assay. (D) Colony formation assays were conducted on OSCC cells (Ca9-22 and HSC-3) with or without TFP treatment. (E) The cell cycle distribution in TFP-treated OSCC cells (Ca9-22 and HSC-3) was analyzed using flow cytometry. (F) Western blot analysis was performed to examine the expression levels of cell cycle-related proteins, with β-actin serving as the internal control. Histograms present the statistical analysis of the relative expression levels of these proteins. Data are reported as means ± SD (n=3). Statistical significance is indicated as *P < 0.05, **P < 0.01 compared to the vehicle control group.
Figure 1
Figure 1
TFP induces cell death, inhibits proliferation, and causes G0/G1 phase arrest in human oral cancer cells. (A) Chemical structure of TFP. (B) Cell viability of the normal gingival fibroblast line HGF-1, and (C) OSCC cells (Ca9-22 and HSC-3) treated with various concentrations of TFP at different time points (24 h, 48 h and 72 h), was measured using the MTT assay. (D) Colony formation assays were conducted on OSCC cells (Ca9-22 and HSC-3) with or without TFP treatment. (E) The cell cycle distribution in TFP-treated OSCC cells (Ca9-22 and HSC-3) was analyzed using flow cytometry. (F) Western blot analysis was performed to examine the expression levels of cell cycle-related proteins, with β-actin serving as the internal control. Histograms present the statistical analysis of the relative expression levels of these proteins. Data are reported as means ± SD (n=3). Statistical significance is indicated as *P < 0.05, **P < 0.01 compared to the vehicle control group.
Figure 2
Figure 2
TFP induces ROS production and mitochondrial damage in human oral cancer cells. (A) OSCC cells (Ca9-22 and HSC-3) were treated with TFP (3, 10, 30 μM) or vehicle control. Cells were stained with DCFH-DA (2 μM), MitoSOX (2 μM), and DAPI (5 μM) for 24 h, and quantified using immunofluorescence assays. Scale bars = 100 μm. (B) OSCC cells (Ca9-22 and HSC-3) were pretreated with NAC (5 mM for 1 h), then treated with 30 μM TFP for 8 h after which the cells were analyzed by flow cytometry. (C) Cell viability and fluorescence microscopy images of OSCC cells (Ca9-22 and HSC-3) treated with TFP with or without NAC for 24 h and then stained with DAPI (1 μM). Scale bars = 100 μm. (D) OSCC cells (Ca9-22 and HSC-3) were treated with TFP (3, 10, 30 μM) or vehicle control. MMP was assessed using JC-1 staining and quantified via flow cytometry. (E) Oxygen consumption rate (OCR) curves were plotted for OSCC cells (Ca9-22 and HSC-3) treated with the indicated concentrations of TFP for 24 h. Cells were analyzed using a Seahorse Bioscience XF24 analyzer with or without oligomycin, FCCP, and rotenone/antimycin A to measure OCR (pMol/min/1×10⁴ cells). Quantification of parameter changes induced by TFP treatment is shown. Data are reported as means ± SD (n=3). Statistical significance is indicated as *P < 0.05, **P < 0.01 compared to the vehicle control group.
Figure 2
Figure 2
TFP induces ROS production and mitochondrial damage in human oral cancer cells. (A) OSCC cells (Ca9-22 and HSC-3) were treated with TFP (3, 10, 30 μM) or vehicle control. Cells were stained with DCFH-DA (2 μM), MitoSOX (2 μM), and DAPI (5 μM) for 24 h, and quantified using immunofluorescence assays. Scale bars = 100 μm. (B) OSCC cells (Ca9-22 and HSC-3) were pretreated with NAC (5 mM for 1 h), then treated with 30 μM TFP for 8 h after which the cells were analyzed by flow cytometry. (C) Cell viability and fluorescence microscopy images of OSCC cells (Ca9-22 and HSC-3) treated with TFP with or without NAC for 24 h and then stained with DAPI (1 μM). Scale bars = 100 μm. (D) OSCC cells (Ca9-22 and HSC-3) were treated with TFP (3, 10, 30 μM) or vehicle control. MMP was assessed using JC-1 staining and quantified via flow cytometry. (E) Oxygen consumption rate (OCR) curves were plotted for OSCC cells (Ca9-22 and HSC-3) treated with the indicated concentrations of TFP for 24 h. Cells were analyzed using a Seahorse Bioscience XF24 analyzer with or without oligomycin, FCCP, and rotenone/antimycin A to measure OCR (pMol/min/1×10⁴ cells). Quantification of parameter changes induced by TFP treatment is shown. Data are reported as means ± SD (n=3). Statistical significance is indicated as *P < 0.05, **P < 0.01 compared to the vehicle control group.
Figure 3
Figure 3
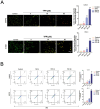
TFP induces apoptotic, autophagic and ferroptotic cell death in human oral cancer cells. (A) Analysis of apoptosis and non-apoptotic deaths in OSCC cells (Ca9-22 and HSC-3) after TFP treatment (3, 10 or 30 μM) for 24 h using Annexin V-FITC/PI staining with flow cytometry detection. Quantification analysis of the percentage of apoptotic and non-apoptotic death is shown. The upper left Annexin V-negative, PI-positive (Annexin V-, PI+) cells are defined as non-apoptotic cells. The upper right quadrant shows Annexin V-positive, PI-positive (Annexin V+, PI+) cells, which are defined as late apoptotic cells. The lower right quadrant shows Annexin V-positive, PI-negative (Annexin V+, PI-) cells, which are defined as early apoptotic cells. (B) OSCC cells (Ca9-22 and HSC-3) were treated with TFP with or without 3-MA (5 mM), Ferrostatin-1 (Fer-1, 5 µM), Deferoxamine (DFO, 10 µM), Necrostatin-1(Nec-1, 10 µM) or Z-VAD-FMK (ZVAD, 20 μM) for 24 h, after which cell viability was assessed using the MTT assay. (C) OSCC cells (Ca9-22 and HSC-3) were treated with TFP (3, 10 or 30 μM) for 24 h. The expression levels of apoptosis-associated proteins were determined by western blot. β-actin was used as an endogenous reference. Histograms represent the statistical analysis of the relative expression level of apoptosis-associated proteins. (D) Cleaved caspase 3 activity was analysed in TFP-treated OSCC cells (Ca9-22 and HSC-3) with or without ZVAD using ELISA. Data are reported as means ± SD (n=3). *P < 0.05, **P < 0.01 compared to the vehicle control group. #P < 0.05, ##P < 0.01 compared to the TFP-treated group.
Figure 3
Figure 3
TFP induces apoptotic, autophagic and ferroptotic cell death in human oral cancer cells. (A) Analysis of apoptosis and non-apoptotic deaths in OSCC cells (Ca9-22 and HSC-3) after TFP treatment (3, 10 or 30 μM) for 24 h using Annexin V-FITC/PI staining with flow cytometry detection. Quantification analysis of the percentage of apoptotic and non-apoptotic death is shown. The upper left Annexin V-negative, PI-positive (Annexin V-, PI+) cells are defined as non-apoptotic cells. The upper right quadrant shows Annexin V-positive, PI-positive (Annexin V+, PI+) cells, which are defined as late apoptotic cells. The lower right quadrant shows Annexin V-positive, PI-negative (Annexin V+, PI-) cells, which are defined as early apoptotic cells. (B) OSCC cells (Ca9-22 and HSC-3) were treated with TFP with or without 3-MA (5 mM), Ferrostatin-1 (Fer-1, 5 µM), Deferoxamine (DFO, 10 µM), Necrostatin-1(Nec-1, 10 µM) or Z-VAD-FMK (ZVAD, 20 μM) for 24 h, after which cell viability was assessed using the MTT assay. (C) OSCC cells (Ca9-22 and HSC-3) were treated with TFP (3, 10 or 30 μM) for 24 h. The expression levels of apoptosis-associated proteins were determined by western blot. β-actin was used as an endogenous reference. Histograms represent the statistical analysis of the relative expression level of apoptosis-associated proteins. (D) Cleaved caspase 3 activity was analysed in TFP-treated OSCC cells (Ca9-22 and HSC-3) with or without ZVAD using ELISA. Data are reported as means ± SD (n=3). *P < 0.05, **P < 0.01 compared to the vehicle control group. #P < 0.05, ##P < 0.01 compared to the TFP-treated group.
Figure 4
Figure 4
TFP induces ROS-mediated autophagy in human oral cancer cells. (A) Fluorescence microscopy using AO staining revealed the formation of acidic vesicular organelles (AVOs) in OSCC cells (Ca9-22 and HSC-3) following TFP treatment. The orange/red color indicates AVOs, whereas the nuclei were stained green. (B) Flow cytometry was employed to determine the mean red-to-green fluorescence ratio in AO-stained cells. (C) OSCC cells (Ca9-22 and HSC-3) were exposed to TFP (10 or 30 μM) for 24 h. The expression levels of autophagy-related proteins were assessed by western blot, with β-actin serving as the internal reference. The histograms illustrate the statistical analysis of the relative expression levels of these proteins. (D) OSCC cells (Ca9-22 and HSC-3) were treated with 30 μM TFP in the presence or absence of 3-MA (5 mM). Fluorescence microscopy of AO staining assays was performed to visualize AVOs. (E) Western blot analysis was conducted to measure the levels of autophagy-associated proteins, using β-actin as an endogenous control. (F) OSCC cells (Ca9-22 and HSC-3) were treated with 30 μM TFP with or without NAC (5 mM). The expression of autophagy-related proteins was analyzed via western blot, with β-actin as the internal reference. Data are reported as means ± SD (n=3). Statistical significance is indicated as follows: *P < 0.05, **P < 0.01, ***P < 0.001 compared to the vehicle control group; #P < 0.05, ##P < 0.01, ###P < 0.001 compared to the TFP-treated group.
Figure 4
Figure 4
TFP induces ROS-mediated autophagy in human oral cancer cells. (A) Fluorescence microscopy using AO staining revealed the formation of acidic vesicular organelles (AVOs) in OSCC cells (Ca9-22 and HSC-3) following TFP treatment. The orange/red color indicates AVOs, whereas the nuclei were stained green. (B) Flow cytometry was employed to determine the mean red-to-green fluorescence ratio in AO-stained cells. (C) OSCC cells (Ca9-22 and HSC-3) were exposed to TFP (10 or 30 μM) for 24 h. The expression levels of autophagy-related proteins were assessed by western blot, with β-actin serving as the internal reference. The histograms illustrate the statistical analysis of the relative expression levels of these proteins. (D) OSCC cells (Ca9-22 and HSC-3) were treated with 30 μM TFP in the presence or absence of 3-MA (5 mM). Fluorescence microscopy of AO staining assays was performed to visualize AVOs. (E) Western blot analysis was conducted to measure the levels of autophagy-associated proteins, using β-actin as an endogenous control. (F) OSCC cells (Ca9-22 and HSC-3) were treated with 30 μM TFP with or without NAC (5 mM). The expression of autophagy-related proteins was analyzed via western blot, with β-actin as the internal reference. Data are reported as means ± SD (n=3). Statistical significance is indicated as follows: *P < 0.05, **P < 0.01, ***P < 0.001 compared to the vehicle control group; #P < 0.05, ##P < 0.01, ###P < 0.001 compared to the TFP-treated group.
Figure 5
Figure 5
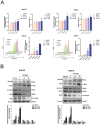
TFP triggers ferroptosis in human oral cancer cells. (A) Intracellular Fe2+ levels were measured in OSCC cells using an iron assay kit. Lipid peroxidation was detected using a MDA assay kit and C11-BODIPY581/591 fluorescent ratio-probe after 24 h treatment of TFP. (B) The expression of ferroptosis-related proteins analyzed by western blotting. β-actin was used as control. Histograms represent the statistical analysis of the relative expression level of ferroptosis-associated proteins. OSCC cells treated with 30 μM TFP in the absence or presence of ferroptosis inhibitors (Ferrostatin-1; Fer-1 at 5 µM and Deferoxamine; DFO at 10 µM). (C) Analysis of apoptosis death using Annexin V-FITC/PI staining with flow cytometry detection. Quantification analysis of the percentage of apoptotic death is shown. (D) Intracellular Fe2+ levels were measured using an iron assay kit. (E) Lipid peroxidation was detected using a C11 BODIPY 581/591 fluorescent ratio-probe. (F) The expression of ferroptosis-related proteins by western blotting. β-actin was used as a control. Histograms represent the statistical analysis of the relative expression level of ferroptosis-associated proteins. Data are reported as means ± SD (n=3). *P < 0.05; ***P < 0.01; ***P < 0.001 compared with the control, #P < 0.05; ##P < 0.01, ###P < 0.001 compared with the TFP-treated group.
Figure 5
Figure 5
TFP triggers ferroptosis in human oral cancer cells. (A) Intracellular Fe2+ levels were measured in OSCC cells using an iron assay kit. Lipid peroxidation was detected using a MDA assay kit and C11-BODIPY581/591 fluorescent ratio-probe after 24 h treatment of TFP. (B) The expression of ferroptosis-related proteins analyzed by western blotting. β-actin was used as control. Histograms represent the statistical analysis of the relative expression level of ferroptosis-associated proteins. OSCC cells treated with 30 μM TFP in the absence or presence of ferroptosis inhibitors (Ferrostatin-1; Fer-1 at 5 µM and Deferoxamine; DFO at 10 µM). (C) Analysis of apoptosis death using Annexin V-FITC/PI staining with flow cytometry detection. Quantification analysis of the percentage of apoptotic death is shown. (D) Intracellular Fe2+ levels were measured using an iron assay kit. (E) Lipid peroxidation was detected using a C11 BODIPY 581/591 fluorescent ratio-probe. (F) The expression of ferroptosis-related proteins by western blotting. β-actin was used as a control. Histograms represent the statistical analysis of the relative expression level of ferroptosis-associated proteins. Data are reported as means ± SD (n=3). *P < 0.05; ***P < 0.01; ***P < 0.001 compared with the control, #P < 0.05; ##P < 0.01, ###P < 0.001 compared with the TFP-treated group.
Figure 6
Figure 6
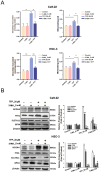
TFP induces autophagy-mediated ferroptosis via ROS in human oral cancer cells. (A) OSCC cells were treated with 30 μM TFP with or without 3-MA. Intracellular Fe²⁺ levels were quantified using an iron assay kit, and lipid peroxidation was assessed using an MDA assay kit. (B) Expression levels of ferroptosis-related proteins were analyzed by western blotting, with β-actin serving as the internal control. Histograms depict the statistical analysis of the relative expression levels of these proteins. (C) OSCC cells were treated with 30 μM TFP in the presence or absence of NAC. Intracellular Fe²⁺ levels were measured using an iron assay kit, and lipid peroxidation was detected using an MDA assay kit. (D) Western blot analysis was conducted to determine the expression levels of ferroptosis-related proteins, with β-actin used as the loading control. Histograms represent the statistical analysis of the relative expression levels of these proteins. Data are reported as means ± SD (n=3). Statistical significance is indicated as follows: *P < 0.05, **P < 0.01, ***P < 0.001 compared to the control; #P < 0.05, ##P < 0.01, ###P < 0.001 compared to the TFP-treated group.
Figure 6
Figure 6
TFP induces autophagy-mediated ferroptosis via ROS in human oral cancer cells. (A) OSCC cells were treated with 30 μM TFP with or without 3-MA. Intracellular Fe²⁺ levels were quantified using an iron assay kit, and lipid peroxidation was assessed using an MDA assay kit. (B) Expression levels of ferroptosis-related proteins were analyzed by western blotting, with β-actin serving as the internal control. Histograms depict the statistical analysis of the relative expression levels of these proteins. (C) OSCC cells were treated with 30 μM TFP in the presence or absence of NAC. Intracellular Fe²⁺ levels were measured using an iron assay kit, and lipid peroxidation was detected using an MDA assay kit. (D) Western blot analysis was conducted to determine the expression levels of ferroptosis-related proteins, with β-actin used as the loading control. Histograms represent the statistical analysis of the relative expression levels of these proteins. Data are reported as means ± SD (n=3). Statistical significance is indicated as follows: *P < 0.05, **P < 0.01, ***P < 0.001 compared to the control; #P < 0.05, ##P < 0.01, ###P < 0.001 compared to the TFP-treated group.
Figure 7
Figure 7
Interaction pattern between TFP and human GPX4. (A) The expression of GPX4 in oral cancer was analyzed using the GEPIA database. Relationship between the expression of GPX4 and the overall survival of oral cancer patients was analyzed using the Kaplan-Meier Plotter database. (B) A GPX4/TFP complex. GPX4 is shown as a red and blue ribbon, and TFP is green. (C) TFP binding area and the contact amino acids (several amino acids were hidden for display convenience). (D) The 2D binding mode of GPX4/TFP complex, with a docking score of -6.07 kcal/mol. (E) The molecular surface of the interaction region (red is the negatively charged region, blue is the positively charged region, and gray is the hydrophobic region). Amino acid K117 forms hydrogen bonds with TFP.
Figure 8
Figure 8
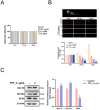
TFP inhibits tumor growth in a zebrafish xenograft model. (A) TFP at the specified concentrations and time points had no detectable toxicity. (B) HSC-3 cells, labeled with the red fluorescent dye CM-DiI, were injected into the yolk sac of zebrafish 48 h post-fertilization. Tumor size was inferred from the intensity of red fluorescence. Zebrafish xenografts were treated with the indicated concentration of TFP and observed at 24 and 48 h post-injection (hpi). The proliferation of tumor cells with or without TFP treatment was quantitatively analyzed. Data are reported as means ± SD (n≥3). Statistical significance is indicated as follows: *P < 0.05, **P < 0.01, ***P < 0.001 compared to the control. (C) Western blot analysis was performed to assess the expression of ferroptosis-related proteins, with β-actin serving as the loading control. The histogram illustrates the statistical analysis of the relative expression levels of these proteins. Data are shown as means ± SD (n=3). Statistical significance compared to the control is indicated as *P < 0.01.
Figure 9
Figure 9
A diagrammatic illustration of the proposed molecular mechanism responsible for the anti-oral cancer effects of TFP. TFP induces SLC7A11/GPX4-mediated ferroptosis through the ROS/autophagy pathways.

References

    1. Wu CH, Bai LY, Tsai MH, Chu PC, Chiu CF, Chen MY. et al. Pharmacological exploitation of the phenothiazine antipsychotics to develop novel antitumor agents-A drug repurposing strategy. Sci Rep. 2016;6:27540. - PMC - PubMed
    1. Pekarek L, Garrido-Gil MJ, Sanchez-Cendra A, Cassinello J, Pekarek T, Fraile-Martinez O. et al. Emerging histological and serological biomarkers in oral squamous cell carcinoma: Applications in diagnosis, prognosis evaluation and personalized therapeutics (Review) Oncol Rep. 2023;50:213. - PMC - PubMed
    1. Warnakulasuriya S. Global epidemiology of oral and oropharyngeal cancer. Oral Oncol. 2009;45:309–16. - PubMed
    1. Kumar M, Jha AK. Exploring the potential of dietary factors and plant extracts as chemopreventive agents in oral squamous cell carcinoma treatment. Front Oral Health. 2023;4:1246873. - PMC - PubMed
    1. Hsieh MJ, Chen JC, Yang WE, Chien SY, Chen MK, Lo YS. et al. Dehydroandrographolide inhibits oral cancer cell migration and invasion through NF-kappaB-, AP-1-, and SP-1-modulated matrix metalloproteinase-2 inhibition. Biochem Pharmacol. 2017;130:10–20. - PubMed

MeSH terms

Substances