. 2024 Nov 11;20(15):6162-6180.
doi: 10.7150/ijbs.101051. eCollection 2024.

Probiotic-facilitated cytokine-induced killer cells suppress peritoneal carcinomatosis and liver metastasis in colorectal cancer cells

Affiliations

Probiotic-facilitated cytokine-induced killer cells suppress peritoneal carcinomatosis and liver metastasis in colorectal cancer cells

Hong-Hwa Chen et al. Int J Biol Sci. .

Abstract

Background: This study tested the hypothesis that combined therapy with probiotics and cytokine-induced killer (CIK) cells was superior to merely one on suppressing the peritoneal carcinomatosis and liver metastasis of colorectal cancer (CRC) cells in nude mice. Methods and Results: The in vitro study revealed that in HCT 116/SW620 CRC cell lines, cell viability, proliferation, colony formation, migratory ability, wound healing, and protein expression of PD-L1 and FAK were significantly and comparably suppressed and that apoptosis was significantly and comparably increased by probiotics and CIK cells, and these effects were further significantly enhanced by combined probiotics + CIK cell therapy (all p<0.001). Nude mice were categorized into Groups 1 (SC), 2 (HCT 116), 3 (HCT 116 + probiotics), 4 (HCT 116 + CIK cells), and 5 (HCT 116 + probiotics + CIK cells). CRC cells were intraperitoneally implanted into Groups 2 to 5, and the animals were euthanized by Day 28. The results demonstrated that the abdominal dissemination of CRC cells, tumor numbers, tumor weights, liver weights, liver necrosis areas and the expression of γ-H2AX/PD-L1/FAK in harvested liver tumors were lowest in Group 1, highest in Group 2, and significantly and progressively decreased in Groups 3 to 5 (all p<0.0001). The protein expression levels of apoptotic and DNA damage biomarkers (Bax/c-caspase 3/c-PARP/γ-H2AX), a metastatic biomarker (FAK) and three tumor proliferation and survival signaling biomarkers (JAK-STAT1, PI3K/Akt/m-TOR and Ras/Raf/MEK/ERK) exhibited identical patterns to that of a tumor immune escape biomarker (PD-L1) among the groups (all p<0.0001). Conclusion: The combination of probiotics and CIK cells was superior to either therapy alone in suppressing CRC cell growth, proliferation, liver metastasis and survival, mainly through downregulating cell proliferation and survival signaling pathways.

Keywords: cell survival signaling; colorectal cancer; cytokine-induced killer cell; liver metastasis; probiotics; tumor mass.


Conflict of interest statement

Competing Interests: The authors have declared that no competing interest exists.

Figures
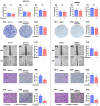
Figure 1
Figure 1
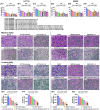
Impact of probiotics treatment on suppressing the CRC cell viability, colony formation unit, wound healing process, and migratory and invasive capacities. A) Cell viability of HCT 116 cells at 24 h, * vs. †, p <0.001 (n=6). B) Cell viability of HCT 116 cells at 48 h, * vs. †, p <0.001 (n=6). C) Cell viability of HCT 116 cells at 72 h, * vs. †, p <0.001 (n=6). D) Cell viability of SW620 cells at 24 h, * vs. †, p <0.001 (n=6). E) Cell viability of SW620 cells at 48 h, * vs. †, p <0.001 (n=6). F) Cell viability of SW620 cells at 48 h, * vs. †, p <0.001 (n=6). G1 to G2) Illustrating the colony formation unit (CFU) of HCT 116 cells (gray color). G3) Analytical result of number of CFU of HCT 116 cells, * vs. †, p <0.001 (n=6). H1 to H2) Illustrating the colony formation unit CFU of SW620 cells (gray color). H3) Analytical result of number of CFU of SW620 cells, * vs. †, p <0.001 (n=6). I1 to I2) Illustrating the baseline of wound healing process of HCT 116 cells that did not differ between two groups. J1 to J2) Illustrating the day 5 wound healing process of HCT 116 cells that was significantly suppressed by probiotics treatment. J3) Analytical result of wound healing process of HCT 116 cells at day 5, * vs. †, p <0.001 (n=6). K1 to K2) Illustrating the baseline of wound healing process of SW620 cells that did not differ between two groups. L1 to L2) Illustrating day 5 wound healing process of SW620 cells that was significantly suppressed in probiotics treatment. L3) Analytical result of wound healing process of SW620 cells at day 5, * vs. †, p <0.0001 (n=6). M1 to M2) Illustrating the microscopic finding (200x) for identification of migratory ability of HCT 116 cells (pink color). M3) Analytical result of number of migratory HCT 116 cells, * vs. †, p <0.0001 (n=6). N1 to N2) Illustrating the microscopic finding (200x) for identification of migratory ability of SW620 cells (pink color). N3) Analytical result of number of migratory SW620 cells, * vs. †, p <0.0001 (n=6). Scale bars in right lower corner represent 50µm. O1 to O2) Illustrating the microscopic finding (200x) for identification of invasive capacity of HCT 116 cells (pink color). O3) Analytical result of number of invasive HCT 116 cells, * vs. †, p <0.0001 (n=6). P1 to P2) Illustrating the microscopic finding (200x) for identification of invasive ability of SW620 cells (pink color). P3) Analytical result of number of invasive SW620 cells, * vs. †, p <0.0001 (n=6). Scale bars in right lower corner represent 50µm.
Figure 2
Figure 2
Combined probiotics and CIK therapy was superior to merely either one on suppressing cell viability, migratory and invasive abilities of CRC cells. A1) HCT 116 cell viability at 24 h, * vs. †, p<0.0001, p for trend <0.001; ‡ vs. §, p <0.0001, p for trend <0.001. A2) SW620 cell viability at 24 h, * vs. †, p<0.0001, p for trend <0.001; ‡ vs. §, p <0.0001, p for trend <0.001. B1) HCT 116 cell viability at 48 h, * vs. †, p<0.0001, p for trend <0.001; ‡ vs. §, p <0.0001, p for trend <0.001. B2) SW620 cell viability at 48 h, * vs. †, p<0.0001, p for trend <0.001; ‡ vs. §, p <0.0001, p for trend <0.001. C1) HCT 116 cell viability at 72 h, * vs. †, p<0.0001, p for trend <0.001; ‡ vs. §, p <0.0001, p for trend <0.001. C2) SW620 cell viability at 72 h, * vs. †, p<0.0001, p for trend <0.001; ‡ vs. §, p <0.0001, p for trend <0.001. D1 to D6) Illustrating the microscopic finding (200x) for identification of migration ability of HCT 116 cells (pink color). D7) Analytical result of number of migratory HCT 116 cells, * vs. †, p<0.0001; p for trend <0.001. E1 to E6) Illustrating the microscopic finding (200x) for identification of migration ability of SW620 cells (pink color). E7) Analytical result of number of migratory SW620 cells, * vs. †, p<0.0001; p for trend <0.001. F1 to F6) Illustrating the microscopic finding (200x) for identification of invasion ability of HCT 116 cells (pink color). F7) Analytical result of number of invasive HCT 116 cells, * vs. †, p<0.0001; p for trend <0.001. G1 to G6) Illustrating the microscopic finding (200x) for identification of invasion ability of SW620 cells (pink color). G7) Analytical result of number of invasive SW620 cells, * vs. †, p<0.0001; p for trend <0.001. Scale bars in right lower corner represent 50µm. CIK = cytokine-induced killer; CRC = colorectal cancer.
Figure 3
Figure 3
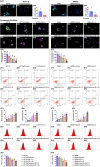
Impact of probiotics and CIK on suppressing the CRC proliferation mitochondrial integrity. A1 to A2) Illustrating the immunofluorescent (IF) microscopic finding (400x) for identification of ki67-positve stain of HCT 116 cells (green-blue color: indicated a merged picture of double stains of DAPI and ki67). A3) Analytical result of number of ki67+ cells, * vs. †, p<0.0001. B1 to B2) Illustrating the IF microscopic finding (400x) for identification of ki67-positve stain of SW620 cells (green-blue color: indicated a merged picture of double stains of DAPI and SW620). B3) Analytical result of number of ki67+ cells, * vs. †, p<0.0001. Scale bar in right lower corner represents 20µm. C1 to C6) Illustrating the immunofluorescent (IF) microscopic finding (400x) for identification of mitochondrial cytochrome C (green-red color) in HCT 116 [noted they were merged pictures of double stains by cytochrome C stain (green color) + heat-shock protein 60 (Hsp60) for identification of mitochondria (red color)]. C7) Analytical result of number of cytochrome C in mitochondria, * vs. other groups with different symbols (†, ‡, §, ¶) p<0.0001. D1 to D6) Illustrating the IF microscopic finding (400x) for identification of mitochondrial cytochrome C (green-red color) in SW620 [noted they were merged pictures of double stains by cytochrome C stain (green color) + heat-shock protein 60 (Hsp60) for identification of mitochondria (red color)]. D7) Analytical result of number of cytochrome C in mitochondria, * vs. other groups with different symbols (†, ‡, §, ¶) p<0.0001. Scale bars in right lower corner represent 20µm. E1 to E6) Illustrating the flow cytometric analysis for identification of early and late apoptoses of HCT 116 cells undergoing probiotics and CIK treatment. E7) Analytical result of number of early (AN-V+/PI-) apoptosis of HCT 116, * vs. other groups with different symbols (†, ‡, §, ¶, α) p<0.0001. E8) Analytical result of number of late (AN-V+/PI+) apoptosis of HCT 116, * vs. other groups with different symbols (†, ‡, §, ¶, α) p<0.0001. F1 to F6) Illustrating the flow cytometric analysis for identification of early and late apoptoses of SW620 cells undergoing probiotics and CIK treatment. F7) Analytical result of number of early (AN-V+/PI-) apoptosis of SW620, * vs. other groups with different symbols (†, ‡, §, ¶, α) p<0.0001. F8) Analytical result of number of late (AN-V+/PI+) apoptosis of SW620, * vs. other groups with different symbols (†, ‡, §, ¶, α) p<0.0001. G1 to G6) Illustrating the flow cytometric analysis for identification of PDL1 expression in HCT 116 cells, undergoing probiotics and CIK treatments. G7) Analytical result of number of PDL1-positive stain in HCT 116 cells, * vs. other groups with different symbols (†, ‡, §, ¶, α) p<0.0001. H1 to H6) Illustrating the flow cytometric analysis for identification of PDL1 expression in SW620 cells, undergoing probiotics and CIK treatments. H7) Analytical result of number of PDL1-positive stain in SW620 cells, * vs. other groups with different symbols (†, ‡, §, ¶, α) p<0.0001. All statistical analyses were performed by one-way ANOVA, followed by Bonferroni multiple comparison post hoc test (n=4-5 for each group). Symbols (*, †, ‡, §, ¶, α) indicate significance (at 0.05 level). CIK = cytokine-induced killer; CRC = colorectal cancer.
Figure 4
Figure 4
Impact of probiotics and CIK therapies on suppressing the protein expression of CRC immune escape and migration-required biomarker, and CRC dead-related biomarkers. A) Protein expression of programmed death protein 1 ligand (PD-L1) in HCT 116 cells, * vs. †, p< 0.0001; p for trend <0.001. B) Protein expression of PD-L1 in SW620 cells, * vs. †, p< 0.0001; p for trend <0.001. C) Protein expression of focal adhesion kinase (FAK) in HCT 116 cells, * vs. †, p< 0.0001; p for trend <0.001. D) Protein expression of FAK in SW620 cells, * vs. †, p< 0.0001; p for trend <0.001. E) Protein expression of cleaved caspase 3 (c-Casp3), in HCT 116 cells, * vs. †, p< 0.0001; p for trend <0.001. F) Protein expression of c-Casp3, in SW620 cells, * vs. †, p< 0.0001; p for trend <0.001. G) Protein expression of c-PARP in HCT116 cells, * vs. †, p< 0.0001; p for trend <0.001. H) Protein expression of c-PARP in SW620 cells, * vs. †, p< 0.0001; p for trend <0.001. I) Protein expression of γ-H2AX in HCR 116 cells, * vs. †, p< 0.0001; p for trend <0.001. J) Protein expression of γ-H2AX in SW620 cells, * vs. †, p< 0.0001; p for trend <0.001. n=6 for each group. CIK = cytokine-induced killer; CRC = colorectal cancer.
Figure 5
Figure 5
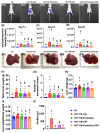
Time courses of bioluminescence single of CRC in liver and abdomen, and anatomical and pathological features of tumor. A1 to A5) Illustrating the day-28 IVIS finding for identification of bioluminescence signal intensity from implanted CRC cells (green fluorescence) in each group. B) Analytical result of bioluminescence signal intensity by day 14, * vs. other groups with different symbols (†, ‡, §, ¶) p<0.0001. C) Analytical result of bioluminescence signal intensity by day 21, * vs. other groups with different symbols (†, ‡, §, ¶) p<0.0001. D) Analytical result of bioluminescence signal intensity by day 28, * vs. other groups with different symbols (†, ‡, §, ¶) p<0.0001. For A to D, n=8 for each group. E1 to F5) Illustrating the morphological features of liver and the different tumor sizes harvested from liver of different groups. F) Total tumor weight, * vs. other groups with different symbols (†, ‡, §) p<0.0001. G) Analytical result of total number of harvested tumors in each group, * vs. other groups with different symbols (†, ‡, §, ¶) p<0.0001. H) liver weight, * vs. other groups with different symbols (†, ‡, §) p<0.0001. I) The ratio of liver weight to body weight, * vs. other groups with different symbols (†, ‡) p<0.001. For E to I, n=17-20 for each group. J) Total amount of ascites by day 28, * vs. other groups with different symbols (†, ‡, §) p<0.0001. n=8 for each group. All statistical analyses were performed by one-way ANOVA, followed by Bonferroni multiple comparison post hoc test. Symbols (*, †, ‡, §, ¶, α) indicate significance (at 0.05 level). group 1 = SC, group 2 = HCT 116 cells only, group 3 = HCT 116 cells + probiotics, group 4 = HCT 116 cells + CIK, group 5 = HCT 116 cells + probiotics + CIK. CIK = cytokine-induced killer; CRC = colorectal cancer.
Figure 6
Figure 6
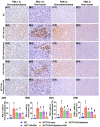
Impact of probiotics and CIK on cellular expressions of PD-L1 and FAK in tumor and liver parenchyma by day 28 after CRC induction. A1 to A5) Illustrating the microscopic finding (400x) of immunohistochemical (IHC) stain for identification of cellular expression of PD-L1 (gray) in liver parenchyma. Scale bar in right lower corner represents 20µm. A6) Analytical result of percentage (%) of PD-L1+ cells in liver parenchyma, * vs. other groups with different symbols (†, ‡, §) p<0.0001. B1 to B5) Illustrating the microscopic finding (800x) of IHC stain for identification of cellular expression of PD-L1 (gray) in liver tumor specimen. Scale bar in right lower corner represents 25µm. B6) Analytical result of percentage (%) of PD-L1+ cells in liver tumor specimen, * vs. other groups with different symbols (†, ‡, §) p<0.0001. C1 to C5) Illustrating the microscopic finding (320x) of IHC stain for identification of cellular expression of focal adhesion kinase (FAK) (gray) in liver parenchyma. Scale bar in right lower corner represents 50µm. C6) Analytical result of percentage (%) of FAK+ cells in liver tumor specimen, * vs. other groups with different symbols (†, ‡, §) p<0.0001. D1 to D5) Illustrating the microscopic finding (200x) of IHC stain for identification of cellular expression of FAK (gray) in liver tumor specimen. Scale bar in right lower corner represents 50µm. D6) Analytical result of percentage (%) of FAK+ cells in liver tumor specimen, * vs. other groups with different symbols (†, ‡, §) p<0.0001. All statistical analyses were performed by one-way ANOVA, followed by Bonferroni multiple comparison post hoc test (n=6 for each group). Symbols (*, †, ‡, §) indicate significance (at 0.05 level). CIK = cytokine-induced killer; CRC = colorectal cancer.
Figure 7
Figure 7
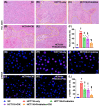
Liver necrosis area and cellular expression of DNA damaged marker by day 28 after CRC induction. A to E) Showing the H.E. stain (200x) for identification of liver necrosis (yellow-dotted line). Scale bar in right lower corner represents 50µm. F) Analytical result of necrosis area of liver, * vs. other groups with different symbols (†, ‡, §, ¶) p<0.0001. G to K) Illustrating the immunofluorescent microscopic finding (800x) for identification of cellular expression of γ-H2AX (red color), * vs. other groups with different symbols (†, ‡, §) p<0.0001. Scale bar in right lower corner represents 25µm. L) Analytical result of number of γ-H2AX+ cells, * vs. other groups with different symbols (†, ‡, §) p<0.0001. All statistical analyses were performed by one-way ANOVA, followed by Bonferroni multiple comparison post hoc test (n=6 for each group). Symbols (*, †, ‡, §) indicate significance (at 0.05 level). CRC = colorectal cancer.
Figure 8
Figure 8
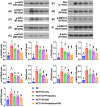
Impact of probiotics and CIK on regulating the protein expressions of apoptosis and DNA-damaged, PD-L1 and FAK biomarkers in liver organ by day 28 after CRC tumor induction. A) Protein expression of mitochondrial Bax (mit-Bax), * vs. other groups with different symbols (†, ‡, §, ¶) p<0.0001. B) Protein expression of cleaved caspase 3 (c-Casp3), * vs. other groups with different symbols (†, ‡, §, ¶) p<0.0001. C) Protein expression of cleaved PARP (c-PARP), * vs. other groups with different symbols (†, ‡, §, ¶) p<0.0001. D) Protein expression of γ-H2AX, * vs. other groups with different symbols (†, ‡, §, ¶) p<0.0001. E) Protein expression of interferon gamma (IFN-γ), * vs. other groups with different symbols (†, ‡, §) p<0.0001. F) Protein expression of programmed death-ligand 1 (PD-L1), * vs. other groups with different symbols (†, ‡, §, ¶) p<0.0001. G) Protein expression of focal adhesion kinase (FAK), * vs. other groups with different symbols (†, ‡, §) p<0.0001. n=6 for each group. All statistical analyses were performed by one-way ANOVA, followed by Bonferroni multiple comparison post hoc test (n=6 for each group). Symbols (*, †, ‡, §, ¶) indicate significance (at 0.05 level). CIK = cytokine-induced killer; CRC = colorectal cancer.
Figure 9
Figure 9
Impact of probiotics and CIK on the regulating the cell survival and proliferation signalings in liver tumor tissue by day 28 after CRC tumor induction. A) Protein expression of phosphorylated (p)-JAK2, * vs. other groups with different symbols (†, ‡, §, ¶) p<0.0001. B) Protein expression of p-STAT3, * vs. other groups with different symbols (†, ‡, §) p<0.0001. C) Protein expression of p-PI3K, * vs. other groups with different symbols (†, ‡, §, ¶) p<0.0001. D) Protein expression of p-Akt, * vs. other groups with different symbols (†, ‡, §) p<0.0001. E) Protein expression of p-mTOR, * vs. other groups with different symbols (†, ‡, §, ¶) p<0.0001. F) Protein expression of Ras, * vs. other groups with different symbols (†, ‡, §, ¶) p<0.0001. G) Protein expression of β-Raf, * vs. other groups with different symbols (†, ‡, §, ¶) p<0.0001. H) Protein expression of p-MEK1/2, * vs. other groups with different symbols (†, ‡, §) p<0.0001. I) Protein expression of p-ERK1/2, * vs. other groups with different symbols (†, ‡, §, ¶) p<0.0001. n = 6 for each group. CIK = cytokine-induced killer; CRC = colorectal cancer.
Figure 10
Figure 10
Schematically illustrated the underlying mechanism of probiotics-CIK therapy on suppressing the pathological and biologic activities of CRC. CIK = cytokine-induced killer; CRC = colorectal cancer.

References

    1. Siegel RL, Miller KD, Wagle NS, Jemal A. Cancer statistics, 2023. CA Cancer J Clin. 2023;73:17–48. - PubMed
    1. Sundling KE, Zhang R, Matkowskyj KA. Pathologic Features of Primary Colon, Rectal, and Anal Malignancies. Cancer Treat Res. 2016;168:309–30. - PubMed
    1. Siegel R, Desantis C, Jemal A. Colorectal cancer statistics, 2014. CA Cancer J Clin. 2014;64:104–17. - PubMed
    1. Hirasaki Y, Fukunaga M, Sugano M, Nagakari K, Yoshikawa S, Ouchi M. Short- and long-term results of laparoscopic surgery for transverse colon cancer. Surg Today. 2014;44:1266–72. - PubMed
    1. Siani LM, Pulica C. Stage I-IIIC right colonic cancer treated with complete mesocolic excision and central vascular ligation: quality of surgical specimen and long term oncologic outcome according to the plane of surgery. Minerva Chir. 2014;69:199–208. - PubMed