. 2024 Nov 27:16:1503336.
doi: 10.3389/fnagi.2024.1503336. eCollection 2024.

Urolithin A and nicotinamide riboside differentially regulate innate immune defenses and metabolism in human microglial cells

Affiliations

Urolithin A and nicotinamide riboside differentially regulate innate immune defenses and metabolism in human microglial cells

Helena Borland Madsen et al. Front Aging Neurosci. .

Abstract

Introduction: During aging, many cellular processes, such as autophagic clearance, DNA repair, mitochondrial health, metabolism, nicotinamide adenine dinucleotide (NAD+) levels, and immunological responses, become compromised. Urolithin A (UA) and Nicotinamide Riboside (NR) are two naturally occurring compounds known for their anti-inflammatory and mitochondrial protective properties, yet the effects of these natural substances on microglia cells have not been thoroughly investigated. As both UA and NR are considered safe dietary supplements, it is equally important to understand their function in normal cells and in disease states.

Methods: This study investigates the effects of UA and NR on immune signaling, mitochondrial function, and microglial activity in a human microglial cell line (HMC3).

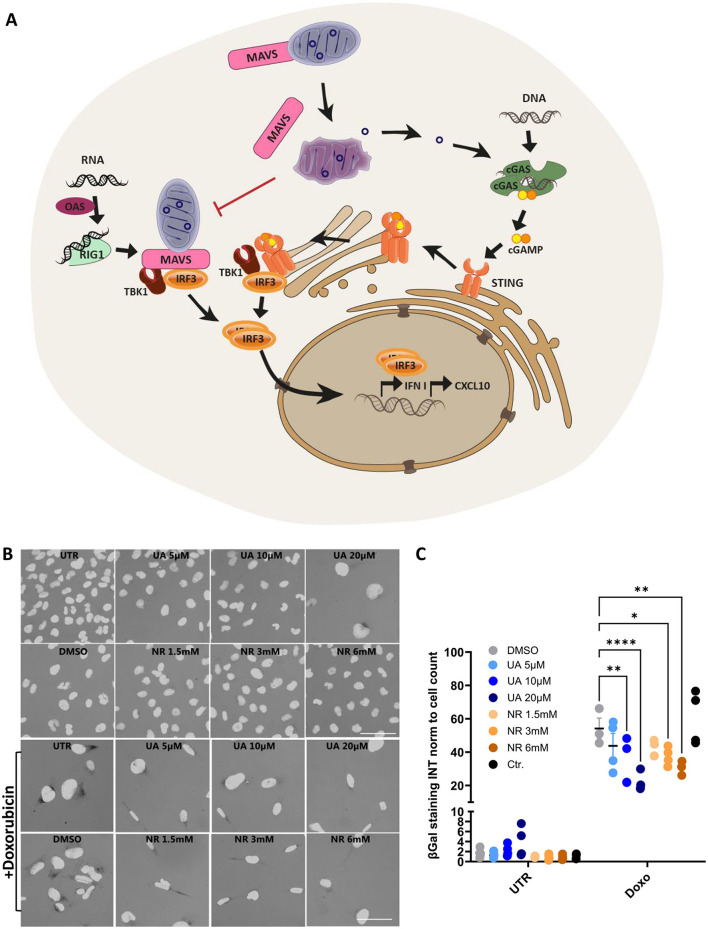
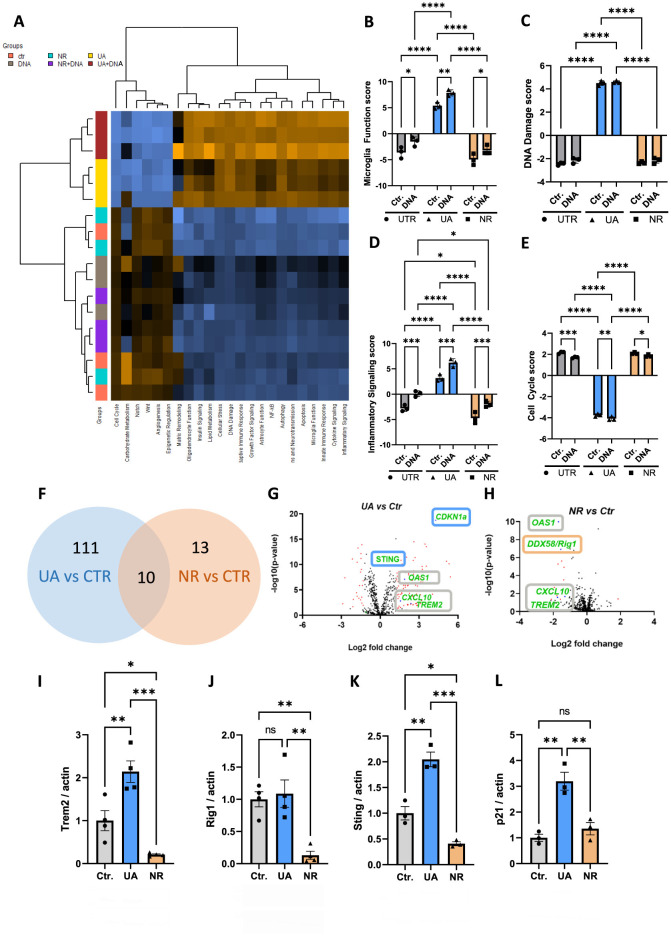
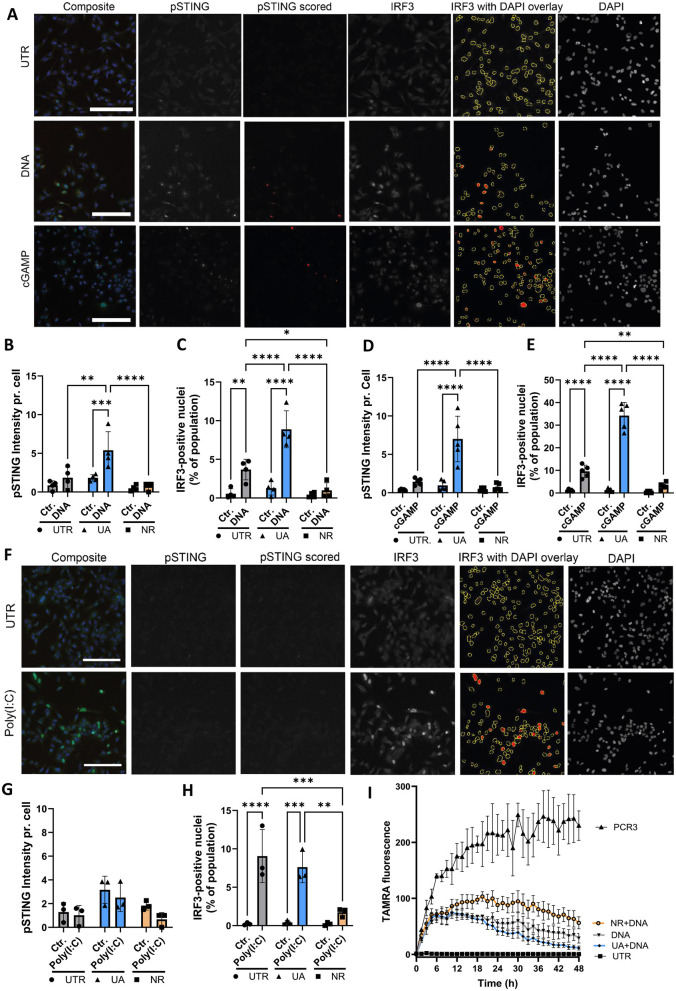
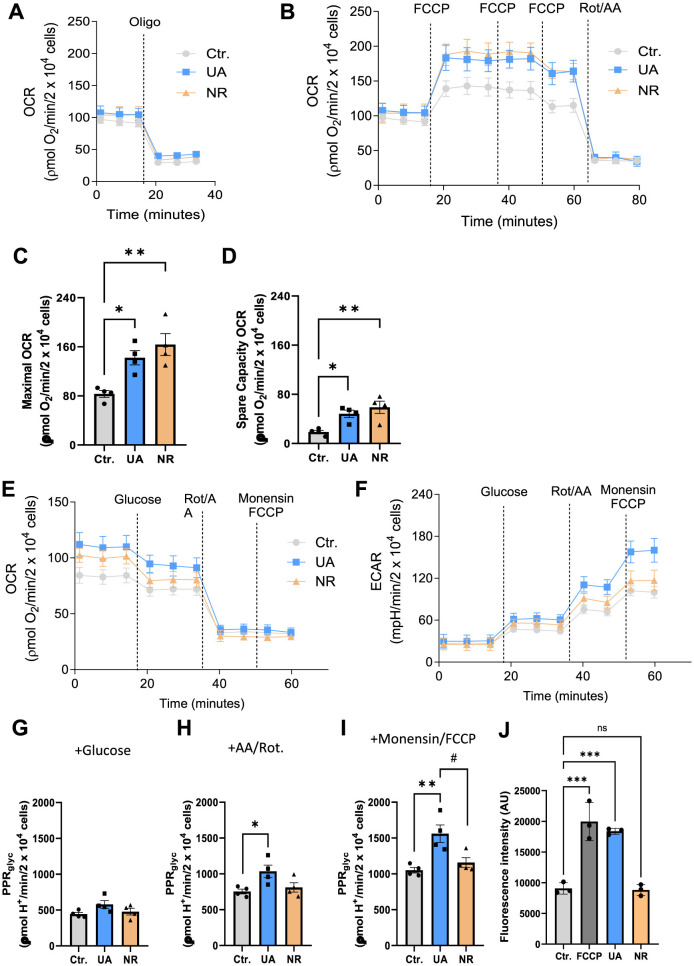
Results: Both UA and NR were shown to reduce DNA damage-induced cellular senescence. However, they differentially regulated gene expression related to neuroinflammation, with UA enhancing cGAS-STING pathway activation and NR displaying broader anti-inflammatory effects. Furthermore, UA and NR differently influenced mitochondrial dynamics, with both compounds improving mitochondrial respiration but exhibiting distinct effects on production of reactive oxygen species and glycolytic function.

Discussion: These findings underscore the potential of UA and NR as therapeutic agents in managing neuroinflammation and mitochondrial dysfunction in neurodegenerative diseases.

Keywords: aging; innate immune signaling; microglia; mitochondrial health; nicotinamide riboside; urolithin A.


Conflict of interest statement

VB had a CRADA with ChromaDex Inc and they provided NR for these studies. VB is a board member of ChromaDex Inc, a provider of nicotinamide riboside. The remaining authors declare that the research was conducted in the absence of any commercial or financial relationships that could be construed as a potential conflict of interest. The handling editor KF declared a shared affiliation with the author(s) HM, CN, EG, ZL, VB at the time of review.

Figures

Figure 1
Figure 1
Schematic overview of the selected innate immune pathways and initial treatments with UA and NR decreasing DNA-damage-induced senescence. (A) Cytoplasmic DNA, from invading pathogens or from endogenous sources such as disrupted mitochondria, binds to and activates cyclic-GMP-AMP synthase (cGAS) to produce the second messenger, 2′3′-cyclic-GMP-AMP (cGAMP). cGAMP then activates the Stimulator of Interferon Genes (STING), which dimerizes and translocate to the trans-golgi network to recruit TBK and IRF3. Upon activation by phosphorylation, IRF3 translocates to the nucleus to activate the transcription of interferon genes. Cytoplasmic RNA can be sensed by 2′-5′-oligoadenylate synthetases (OASes), which activates RNAse L to cleave it into appropriate ligands for RNA pattern recognition receptors such as retinoic acid-inducible gene 1 (RIG-I). RIG-I then activates MAVS, which, like STING, engages TBK1 and IRF3, and IRF3 then translocates to the nucleus to induce the transcription of interferon genes in a STING-independent manner (Leisching et al., 2017). (B, C) Microglia cells were treated with/without doxorubicin 100 nM for 24 h, then treated for 1 week with either UA (5-20 uM) or NR (1.5-6 mM). Cells were stained for β-galactosidase (B) and a macro was used to quantify the signal intensity pr. cell (C). *P ≤ 0.05, **P ≤ 0.01, ***P ≤ 0.001, ****P ≤ 0.0001.
Figure 2
Figure 2
UA and NR differentially regulate transcription of several genes in microglia cells. (A) NanoString analysis was done to study neuroinflammation-related genes. Heatmap showing the directed global significance scores: orange denotes gene sets whose genes exhibit increased differential expression with the covariate, blue denotes gene sets with less differential expression. (B–E) Individual NanoString pathway scores following UA, NR, and/or DNA stimulation of HMC3 cells. (F) Venn diagram comparing the differentially expressed genes of UA vs. controls and NR vs. controls. There were ten genes that were in common, 111 UA subgroup-specific genes and 13 NR subgroup-specific genes. (G, H) Volcano plot representation of differential gene expression analysis of UA vs. controls and NR vs. controls. (I–L) Representative western blot analysis showing changed level of the TREM2, RIG-I, STING, and p21 following UA and/or NR treatment of HMC3 cells compared to control (UTR), analysed by two-way ANOVA. Each dot represents an independent experiment and bars denote means (+ SEM) (N = 4). **P ≤ 0.01 vs. untreated cells, Ctr.; *P ≤ 0.05 vs. untreated cells, Ctr. ***P ≤ 0.001, ****P ≤ 0.0001.
Figure 3
Figure 3
UA treatment leads to enhanced DNA stimulation, whereas NR treatment reduced both DNA and RNA signaling. (A) Immunocytochemistry imaging of control microglia cells treated with DNA or cGAMP and stained for DNA (DAPI), activated STING (pSTING) and IRF3. Scalebar = 250um. ImageJ macro analysis was used to quantify the amount of pSTING pr. cell (B, D) and the percentage of IRF3-positive nuclei (C, E). (F) Images of microglia cells treated with the RNA mimic Poly(I:C) and stained as described above. pSTING and IRF3 translocation after Poly(I:C) were quantified in (G, H), respectively. (I) Live-cell imaging of microglia cells degrading TAMRA-tagged DNA over 48 h. PCR3 is TAMRA-tagged DNA added to an empty well as a control. *P ≤ 0.05, **P ≤ 0.01, ***P ≤ 0.001, ****P ≤ 0.0001.
Figure 4
Figure 4
Treatment with UA and NR promotes a significant increase in maximal and spare capacity OCR in HCM3 cells, with maximal glycolytic function increased only by UA treatment. HCM3 cells (2.2 × 10⁴ cells/well) untreated (Ctr.) or treated with 10 μM UA or 3 mM NR for 1 week were incubated in appropriate medium containing 2 mM glutamine and 11 mM glucose as metabolic energy substrates for OCR measurement and 2 mM glutamine for PPR measurement. (A, B) show representative traces of oxygen consumption rates (OCR). Oligomycin (Oligo, 1 μg/mL), carbonyl cyanide 4-(trifluoromethoxy)phenylhydrazone (FCCP, 200 nM each addition), and rotenone (Rot, 1 μM) plus antimycin A (AA, 1 μM) were added where indicated. Different OCR parameters were determined: (C) Maximal respiratory capacity and (D) Spare respiratory capacity. For evaluation of glycolytic function, Panels E and F represent the experimental design and raw data of OCR and extracellular acidification rate (ECAR). Glucose (10 mM), rotenone (Rot, 1 μM) plus antimycin A (AA, 1 μM), and monensin (100 μM) plus FCCP (1 μM) were added where indicated. (G) Basal glycolytic proton production (PPRglyc) and maximal glycolytic rate stimulated by rotenone plus antimycin A (H) and monensin plus FCCP (I) were calculated from OCR and ECAR. Each dot represents an independent experiment, and bars denote means (+ SEM) (N = 4). **P ≤ 0.01 vs. untreated cells, Ctr.; *P ≤ 0.05 vs. untreated cells, Ctr. #P ≤ 0.05 vs. NR-treated cells. (J) HMC3 cells were treated with DMSO, 10 μM UA, or 3 mM NR for 6 days, respectively. The FCCP group was treated with 20 μM FCCP for 10 min and controlled for by using DMSO. Data was presented as mean with standard deprivation. Data were statistically tested using ordinary one-way ANOVA by Prism 10. ***P < 0.001.

References

    1. Abdelazeem K. N. M. M., Kalo M. Z., Beer-Hammer S., Lang F. (2021). The gut microbiota metabolite urolithin A inhibits NF-κB activation in LPS stimulated BMDMs. Sci Rep. 11:7117. 10.1038/s41598-021-86514-6 - DOI - PMC - PubMed
    1. Aman Y., Frank J., Lautrup S. H., Matysek A., Niu Z., Yang G., et al. . (2020). The NAD+-mitophagy axis in healthy longevity and in artificial intelligence-based clinical applications. Mech. Ageing Dev. 185:111194. 10.1016/j.mad.2019.111194 - DOI - PMC - PubMed
    1. Andreux P. A., Blanco-Bose W., Ryu D., Burdet F., Ibberson M., Aebischer P., et al. . (2019). The mitophagy activator urolithin A is safe and induces a molecular signature of improved mitochondrial and cellular health in humans. Nat. Metab. 1, 595–603. 10.1038/s42255-019-0073-4 - DOI - PubMed
    1. Bosch-Presegué L., Vaquero A. (2014). Sirtuins in stress response: guardians of the genome. Oncogene 33, 3764–3775. 10.1038/onc.2013.344 - DOI - PubMed
    1. Cercillieux A., Ciarlo E., Canto C. (2022). Balancing NAD+ deficits with nicotinamide riboside: therapeutic possibilities and limitations. Cell. Mol. Life Sci. 79:5. 10.1007/s00018-022-04499-5 - DOI - PMC - PubMed