. 2025 Apr;97(4):779-790.
doi: 10.1002/ana.27157. Epub 2024 Dec 12.

Atlas of Cerebrospinal Fluid Immune Cells Across Neurological Diseases

Affiliations

Atlas of Cerebrospinal Fluid Immune Cells Across Neurological Diseases

Michael Heming et al. Ann Neurol. 2025 Apr.

Abstract

Objective: Cerebrospinal fluid (CSF) provides unique insights into the brain and neurological diseases. However, the potential of CSF flow cytometry applied on a large scale remains unknown.

Methods: We used data-driven approaches to analyze paired CSF and blood flow cytometry measurements from 8,790 patients (discovery cohort) and CSF only data from 3,201 patients (validation cohort) collected across neurological diseases in a real-world setting.

Results: In somatoform controls (n = 788), activation of T cells increased with age in both CSF and blood, whereas double negative blood T cells (CD3+CD4-CD8-) decreased with age. A machine learning model of CSF and blood immune cells defined immune age, which correlated strongly with true biological age (r = 0.71). Classifying all diseases solely based on the CSF/blood parameters in 8,790 patients resulted in clusters of 4 disease categories: healthy, autoimmune, meningoencephalitis, and neurodegenerative. This clustering was validated in an analytically independent test dataset (8,790 patients) and in a temporally independent cohort (3,201 patients). Patients with multiple sclerosis were more likely to have progressive disease when assigned to the neurodegeneration cluster and to have lower disability in the autoimmune cluster. Patients with dementia in the neurodegeneration cluster showed more severe disease progression. Flow cytometry helped differentiate dementia from controls, thereby enhancing the diagnostic power of routine CSF diagnostics.

Interpretation: Flow cytometry of CSF and blood thus identifies site-specific aging patterns and disease-overarching patterns of neurodegeneration. ANN NEUROL 2025;97:779-790.


Conflict of interest statement

All authors declare no competing interest.

Figures
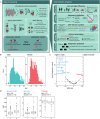
FIGURE 1
FIGURE 1
Overview of the study. (A) Schematic illustration of the study design. (B) Distribution of age and sex in the somatoform cohort (n = 788). (C) Volcano plot showing sex‐related differences in the somatoform cohort after adjusting for age. The x axis represents the effect size (Algina Keselman and Penfield method), and the y axis represents the significance (Wilcoxon rank‐sum test adjusted by the Benjamini‐Hochberg procedure). Parameters with an effect size > 0.5 and an adjusted p < 0.001 are marked in red and labeled. (D) Differences between male and female subjects with somatoform in selected parameters are visualized in boxplots. Boxes show the median, the lower and upper quartiles. The whiskers include 1.5 times the interquartile range of the box, further outliers are marked as dots. The routine CSF parameters are shown in blue, and the flow cytometry parameters are shown in red. T = T cells. [Color figure can be viewed at www.annalsofneurology.org]
FIGURE 2
FIGURE 2
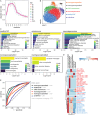
Immunosenescence primarily affects T cells in CSF and blood that become activated with age. (A) Volcano plot showing age‐related differences after adjusting for sex. The x axis represents the coefficients of the linear model and the y axis shows the significance of the coefficients adjusted by the Benjamini‐Hochberg procedure. Parameters with an absolute value of the coefficient > 0.01 and an adjusted p < 0.001 are marked in red and labeled. (B) Correlation of selected parameters with age in the somatoform cohort. The blue line represents the linear regression line. Its confidence interval is shown in light gray. (C) Performance of the XGBoost model on the test set of the somatoform cohort (train/test 588/200 patients). The red line represents the line of perfect correlation. (D) Predictor importance of the top 10 most important predictors of the XGBoost model of C. The routine CSF parameters are shown in blue, and the flow cytometry parameters are shown in red. CD8 = CD8 T cells; CD4 = CD4 T cells; dn T = double negative T cells (CD3+CD4CD8); CSF = cerebrospinal fluid; dp T = double positive T cells (CD3+CD4+CD8+); Mono = monocytes; coeff = coefficient; r = Pearson correlation coefficient; RMSE = root mean squared error. [Color figure can be viewed at www.annalsofneurology.org]
FIGURE 3
FIGURE 3
Categorizing neurological diseases from ICD‐10 codes and manual validation in 991 patients. (A) Number of patients per level 1 category. Categories were manually assigned from the ICD‐10 codes (see the Methods section). (B) Comparison of ICD‐10‐based diagnostic categories (columns) to manual expert annotations (rows) in 991 patients. (C) Clustered heatmap displaying the group mean of routine CSF and CSF flow cytometry parameters across level 1 categories. The routine CSF parameters are shown in blue, and the flow cytometry parameters are shown in red. brightNK = CD56brightNK cells; cMono = classical monocytes; CSF = cerebrospinal fluid; dimNK = CD56dim NK cells; dp T = double positive T cells (CD3+CD4+CD8+); ery = erythrocytes; granulo = granulocytes; ICD = International Classification of Disease 10th edition; iMono = intermediate monocytes (CD14+CD16dim); lympho = lymphocytes; Mono = monocytes; ncMono = non‐classical monocytes (CD14lowCD16+); OCB = oligoclonal bands; T = T cells. [Color figure can be viewed at www.annalsofneurology.org]
FIGURE 4
FIGURE 4
Unsupervised analysis of blood and CSF yields disease clusters of 4 neurological categories. (A) The ARI between the train and test set is shown for different cluster resolutions for 10 data thin splits in CSF. (B) UMAP plot of CSF parameters from 8,790 patients/measurements. Each point represents one patient/measurement. (C) Enrichment of level 2 disease categories per cluster based on the TF‐IDF and the adjusted statistical significance (qval). The “undefined” cluster did not show any significant disease enrichment. (D) Significantly expressed cluster markers are visualized. (E) ROC curves of the XGBoost model to predict the disease clusters evaluated on the test set (8,790 patients). ROC AUC were calculated in a one‐vs‐all fashion for each cluster separately and a macro‐weighted averaging ROC AUC for the overall performance. Routine CSF parameters are shown in blue, flow cytometry parameters are shown in red. ARI = adjusted Rand index; AUC = area under the curve; CSF = cerebrospinal fluid; TF‐IDF = term frequency‐inverse document frequency; ROC = receiver operating characteristic; UMAP = uniform manifold approximation and projection. [Color figure can be viewed at www.annalsofneurology.org]
FIGURE 5
FIGURE 5
CSF‐driven clusters are associated with specific clinical phenotypes in MS and dementia. (A) Enrichment of MS subtypes in the “neurodegenerative” cluster based on the TF‐IDF and the adjusted statistical significance (qval) after adjusting for age. The remaining clusters did not show significant enrichment. (B) EDSS scores in 454 patients with MS after age adjustment in the “CNS autoimmune” cluster versus all remaining clusters. Statistical significance was assessed using the Wilcoxon rank sum test. (C) Progression of 354 age‐adjusted MMSE scores from 231 patients with dementia in the “neurodegenerative” versus the remaining clusters. Time zero is defined as the date of CSF collection. Statistical significance was assessed using a linear mixed‐effects model followed by post hoc pairwise comparisons. Boxes in B and C show the median, the lower and upper quartiles. The whiskers include 1.5 times the interquartile range of the box. Further outliers are marked as dots. CNS = central nervous system; CSF = cerebrospinal; EDSS = Expanded Disability Status Scale; MS = multiple sclerosis; MMSE = Mini Mental Status Test; PPMS = primary progressive multiple sclerosis; SPMS = secondary progressive multiple sclerosis; TF‐IDF = term frequency‐inverse document frequency. * p < 0.05. [Color figure can be viewed at www.annalsofneurology.org]

References

    1. Heming M, Börsch A‐L, Wiendl H, Meyer Zu Hörste G. High‐dimensional investigation of the cerebrospinal fluid to explore and monitor CNS immune responses. Genome Med 2022;14:94. - PMC - PubMed
    1. Tumani H, Petereit HF, Gerritzen A, et al. S1 guidelines “lumbar puncture and cerebrospinal fluid analysis” (abridged and translated version). Neurol Res Pract 2020;2:8. - PMC - PubMed
    1. Deisenhammer F, Bartos A, Egg R, et al. Guidelines on routine cerebrospinal fluid analysis. Report from an EFNS task force. Eur J Neurol 2006;13:913–922. - PubMed
    1. Han S, Lin YC, Wu T, et al. Comprehensive immunophenotyping of cerebrospinal fluid cells in patients with neuroimmunological diseases. J Immunol 2014;192:2551–2563. - PMC - PubMed
    1. Kowarik MC, Grummel V, Wemlinger S, et al. Immune cell subtyping in the cerebrospinal fluid of patients with neurological diseases. J Neurol 2014;261:130–143. - PubMed