. 2025 Feb;12(5):e2410506.
doi: 10.1002/advs.202410506. Epub 2024 Dec 12.

Mass-Guided Single-Cell MALDI Imaging of Low-Mass Metabolites Reveals Cellular Activation Markers

Affiliations

Mass-Guided Single-Cell MALDI Imaging of Low-Mass Metabolites Reveals Cellular Activation Markers

James L Cairns et al. Adv Sci (Weinh). 2025 Feb.

Abstract

Single-cell MALDI mass spectrometry imaging (MSI) of lipids and metabolites >200 Da has recently come to the forefront of biomedical research and chemical biology. However, cell-targeting and metabolome-preserving methods for analysis of low mass, hydrophilic metabolites (<200 Da) in large cell populations are lacking. Here, the PRISM-MS (PRescan Imaging for Small Molecule - Mass Spectrometry) mass-guided MSI workflow is presented, which enables space-efficient single cell lipid and metabolite analysis. In conjunction with giant unilamellar vesicles (GUVs) as MSI ground truth for cell-sized objects and Monte Carlo reference-based consensus clustering for data-dependent identification of cell subpopulations, PRISM-MS enables MSI and on-cell MS2-based identification of low-mass metabolites like amino acids or Krebs cycle intermediates involved in stimulus-dependent cell activation. The utility of PRISM-MS is demonstrated through the characterization of complex metabolome changes in lipopolysaccharide (LPS)-stimulated microglial cells and human-induced pluripotent stem cell-derived microglia. Translation of single cell results to endogenous microglia in organotypic hippocampal slice cultures indicates that LPS-activation involves changes of the itaconate-to-taurine ratio and alterations in neuron-to-glia glutamine-glutamate shuttling. The data suggests that PRISM-MS can serve as a standard method in single cell metabolomics, given its capability to characterize larger cell populations and low-mass metabolites.

Keywords: MALDI mass spectrometry imaging; giant unilamellar vesicles (GUVs); human induced pluripotent stem cells (hiPSC); microglia; neurodegeneration; single cell; spatial metabolomics.


Conflict of interest statement

D.S. is an employee of GSK, the company that funded part of this study, as demanded by BMBF regulations. All other authors declare no competing interests.

Figures

Figure 1
Figure 1
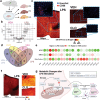
PRISM‐MS for fast low mass metabolite‐preserving single‐cell spatial metabolomics. a) Schematic overview of PRISM‐MS workflow. (I) Survey PreScan at large (e.g., >100 µm) pixel size; (II) determine cell containing pixels by feature‐selective binary image segmentation; (III) definition of cell containing pixels as new measurement regions; (IV) DeepScan at small (e.g., <20 µm) pixel size; followed by data analysis for single cell metabolomics and cluster detection (Figure S13, Supporting Information). b) PRISM‐MS example of cultured SIMA9 mouse microglia cells covered with MALDI matrix directly after lyophilization: the PreScan obtains cellular signal intensities per 200‐µm pixels (green color scale) (upper panel left), which then get thresholded (upper panel middle) and undergo a subsequent DeepScan at 20‐µm pixel size to resolve individual cells (upper panel right). Right dashed box: four distinct 200‐µm measurement regions with 20 µm DeepScan step size (ion images of m/z 281.25 (FA 18:1 [M‐H])). c) Left panel: 5‐µm MSI image of cell marker m/z 281.25 (FA 18:1 [M‐H]); right panel: overlay of ion image with haematoxylin and eosin (H&E) ‐stained slide generated after MSI. The registration offset is deliberate, in order to demonstrate cell identification versus H&E ground truth. d) Intensity profiles for (i) m/z 279.23 (linoleic acid [M‐H]), (ii) m/z 306.08 (glutathione [M‐H]) and (iii) m/z 295.23 (9‐ and 13‐hydroxy‐octadecadienoic acids (9/13‐HODE) [M‐H]) obtained by PRISM‐MS (blue) versus the optically guided workflow (red). Oxidation of linoleic acid to 9/13‐HODE is reduced in PRISM‐MS. e) PRISM‐MS preserves metabolite profiles: average (N = 3) Comparison of Cohen's D effect sizes for small molecule m/z features obtained by PRISM‐MS or by a workflow including 30 min slide exposure to ambient conditions to emulate workflows that capture, e.g., a high resolution optical image before MSI.[ 3c ] Metabolites with significantly higher (blue) or lower (red) effect sizes/ intensities in PRISM‐MS versus emulated optically guided workflow. Black bars indicate peaks with non‐significant (p >0.05; N = 3 each for PRISM and emulated optical workflow) differences between the workflows.
Figure 2
Figure 2
Giant unilamellar vesicles (GUVs) as an analytical ground truth for validation of Monte Carlo Consensus Clustering (M3C). a) GUVs are 5–50 µm single‐lipid vesicles composed of either DOPC (magenta) or DMPC (cyan). b) Chemical structures of protonated DOPC (m/z 786.6; phosphatidylcholine PC(18:1/18:1) [M+H]+) and DMPC (m/z 678.5; PC(14:0/14:0) [M+H]+). c) Binary thresholded image of the PRISM‐MS 200‐µm PreScan displayed for (i) DOPC, (ii) DMPC, and (iii) a 1:1 mixture of both GUV types. Three spots each were applied onto ITO slides. d) Overlay of fluorescence image of lissamine rhodamine B (red; 1% LissRhod‐PE included in lipid mixture) label in GUVs, and 20‐µm pixel DeepScan of m/z 786.6 (DOPC; cyan). e) Monte Carlo Consensus Clustering (M3C) for a 1:1 mixture of DOPC and DMPC GUVs on a full ITO chamber slide. Relative Cluster Stability Index (RSCI) suggests k = 2, consistent with two classes of GUVs, as the most stable cluster with an overall p < 0.01. f) Top row – the ground truth: ion image overlays of m/z 786.6 (DOPC) and m/z 678.5 (DMPC) for three conditions: pure DOPC‐, pure DMPC‐ and mixed DOPC/DMPC GUVs. Bottom row – M3C model generation: M3C clustering (k = 2) classifies GUVs as DOPC+ (yellow), DMPC+ (blue) or DOPC+/ DMPC+ (green). g) Principal component analysis (PCA) of GUVs; plot of PC1 and PC2 for the three conditions, DOPC (magenta), DMPC (cyan), and mixed DOPC/DMPC (black). h) Post‐clustering PCA of GUVs categorized by the M3C model enables class assignment for each GUV: DOPC+/DMPC‐ (yellow), DOPC‐DMPC+ (blue), and DOPC+DMPC+ (green). i) M3C model‐based population statistics for the three conditions in (g) suggests that 3.5% of GUVs in DOPC/DMPC mixture are classified as DOPC+DMPC+. j) Cohen's D effect sizes versus p‐value Volcano Plot for M3C cluster analysis: m/z features specific to DMPC‐GUV populations, such as m/z 678.5 (DMPC [M+H]+) and m/z 700.5 (DMPC [M+Na]+), or specific to DOPC‐GUV populations like m/z 786.6 (DOPC [M+H]+) and the corresponding lysophosphatidylcholine (LPC) m/z 522.3. Benjamini‐Hochberg adjusted p‐value threshold was set to 0.05 and Cohen´s D threshold to ± 0.2. k) MS2 spectrum of (i) m/z = 786.6 indicating (ii) LPC(18:1) [M+H]+ as a likely DOPC fragment in j).
Figure 3
Figure 3
Microglial responses to LPS treatment revealed sub‐populations of SIMA9 and hiPSC microglia cells. a) Modified Volcano plot for untreated (vehicle; VEH) and lipopolysaccharide (LPS) treated (500 ng mL−1, 20 h) SIMA9 cells highlights m/z 124.01 (taurine [M‐H]) and m/z 129.02 (itaconate [M‐H]) as markers for non‐activated and LPS‐activated microglial cells, respectively. Benjamini‐ Hochberg adjusted p‐value threshold was set to 0.05 and Cohen´s D threshold to ± 0.2. b) Itaconate violin plot: normalized intensity of itaconate per cell indicates microglial activation in correlation with LPS treatment. c) M3C cluster analysis of SIMA9 cells for itaconate and taurine labeling. Cells are categorized into four distinct groups by post analysis – itaconate‐positive (Ita+Taur‐, pink), taurine‐positive (Ita‐Taur+, green), and positive for both markers (Ita+Taur+, purple). Cells that don´t fall into either category (Ita‐Taur‐, grey) are omitted. d) Visualization of M3C cluster analysis for chamber slide wells untreated (VEH) or treated with a concentration range of LPS (0.1 to 500 ng mL−1). e) Besides murine SIMA9 cells, the hiPSC‐derived microglia cell lines hiPSC1 and hiPSC2 cells responded to LPS‐treatment, as indicated by itaconate increases. Murine EOC cells lack toll‐like receptor 4 and did not respond to LPS. f) t‐distributed stochastic neighbor embedding (t‐SNE) for the four microglial cells lines. g) t‐SNE analysis of microglial activation status indicates that only a subset of SIMA9, hiPSC1, and hiPSC2 cells were activated by LPS (500 ng mL−1 for 20 h): Cells were categorized as Ita‐Taur+ (green), Ita+Taur+ (purple), Ita+Taur‐ (pink), or Ita‐Taur‐ (grey). EOC cells were non‐reactive. h) Volcano plot restricted to Ita‐Taur+ and Ita+Taur‐ cells. Comparing both clusters yielded more defined m/z‐signatures for microglial activation (15 markers of non‐activation and 55 activation marker candidates) than using cell pools (2 markers of non‐activation and 26 activation markers; compare a) by reducing extraneous data. In total 8.878 cells were analysed and measured in six separate runs.
Figure 4
Figure 4
MALDI MS imaging of hippocampal slice cultures suggests metabolic neuron‐glia interplay in response to LPS‐induced neuroinflammation. a) Rat hippocampal slice cultures following 72 h incubation with different treatments: vehicle‐treated (VEH), 1 µg mL−1 lipopolysaccharide (LPS), or 100 µg mL−1 clodronate (CLO, a bisphosphonate for selective macrophage and microglia depletion).[ 29a,b ] b) Volcano plot comparing VEH‐ and LPS‐treated hippocampal slices revealed m/z features that mark non‐activated and LPS‐responding cells. Measurements were taken from n = 5 animals with 3 replicates per treatment, for a total of 30 sections. Benjamini Hochberg adjusted p‐value threshold was set to 0.01 and Cohen´s D threshold to ± 0.2. Itaconate (m/z 129.02; [M‐H]) translates as a response marker from microglial cell populations (Figure 3) to slice cultures. c) Increased itaconate MSI ion intensities in LPS‐treated hippocampal slices versus VEH and CLO controls (20 µm pixel size, negative ion mode). Anti‐CD68‐immunofluorescence overlay with Hoechst‐stained nuclei suggests high microglia density in LPS‐treated cultures. d) Metabolic profiling by MALDI MS imaging using KEGG METASPACE annotations at FDR<10%: Venn diagram comparing metabolites specific (Cohen´ s D > 0.2 AND p < 0.01) for CLO slice cultures versus VEH&LPS cultures containing microglia. Then comparing LPS‐treated slice culture against VEH. e) Comparison of slice culture with hiPSC and SIMA9 cell metabolite profiles, suggesting common markers of non‐activated microglia: GABA*(m/z 102.06), fumarate (m/z 115.00), and glutamate (m/z 146.05) and of active microglia: Itaconate (m/z 129.02), ornithine (m/z 131.08) and hypoxanthine (m/z 135.03). The hiPSC profile shared non‐activated markers N‐acetyl‐alanine (m/z = 130.05), adenine (m/z = 134.05), N‐acetyl‐aspartate (NAA) (m/z 174.04), FA 18:1 (m/z 281.25), and AMP (m/z 346.06) with slice cultures. f) Ion intensity of NAA is reduced in LPS‐treated slice culture compared to VEH and CLO tissue. g) Hypothetical model of metabolic neuron‐glia interplay in LPS‐activated hippocampal slice cultures. In total five separate measurements were performed, with all three conditions measured in triplicates each time, resulting in 45 slice culture sections.
Figure 5
Figure 5
MALDI MS imaging reveals metabolic changes in hippocampal slice cultures. MALDI MS imaging of rat hippocampal slice cultures treated with vehicle (VEH) or with 1 µg mL−1 LPS at 5 µm pixel size. Ion images of metabolites that were significantly increased (magenta) or decreased (turquoise) between VEH and LPS groups (Tables S1–S3, Supporting Information). For orientation, a bright field image of both tissue areas is included in the middle. Metabolites marked with an asterisk where inconclusive in tandem MS as well as analysis of the resulting spectra using SIRIUS.

References

    1. a) Schulz S., Becker M., Groseclose M. R., Schadt S., Hopf C., Curr. Opin. Biotechnol. 2019, 55, 51; - PubMed
    2. b) Heuckeroth S., Behrens A., Wolf C., Futterer A., Nordhorn I. D., Kronenberg K., Brungs C., Korf A., Richter H., Jeibmann A., Karst U., Schmid R., Nat. Commun. 2023, 14, 7495; - PMC - PubMed
    3. c) Xie Y. R., Castro D. C., Rubakhin S. S., Trinklein T. J., Sweedler J. V., Lam F., Nat. Methods 2024, 21, 521; - PMC - PubMed
    4. d) Gruber L., Schmidt S., Enzlein T., Vo H. G., Cairns J. L., Ucal Y., Keller F., Abu Sammour D., Rudolf R., Eckhardt M., Iakab S. A., Bindila L., Hopf C., (Preprint) bioRxiv 2023. 10.1101/2023.12.14.571637 - DOI
    1. a) Berman E. S., Fortson S. L., Checchi K. D., Wu L., Felton J. S., Wu K. J., Kulp K. S., J. Am. Soc. Mass Spectrom. 2008, 19, 1230; - PubMed
    2. b) Amantonico A., Urban P. L., Fagerer S. R., Balabin R. M., Zenobi R., Anal. Chem. 2010, 82, 7394; - PubMed
    3. c) Lanni E. J., Rubakhin S. S., Sweedler J. V., J. Proteomics 2012, 75, 5036; - PMC - PubMed
    4. d) Neumann E. K., Comi T. J., Rubakhin S. S., Sweedler J. V., Angew. Chem., Int. Ed. Engl. 2019, 58, 5910; - PMC - PubMed
    5. e) Rappez L., Stadler M., Triana S., Gathungu R. M., Ovchinnikova K., Phapale P., Heikenwalder M., Alexandrov T., Nat. Methods 2021, 18, 799; - PMC - PubMed
    6. f) Bien T., Koerfer K., Schwenzfeier J., Dreisewerd K., Soltwisch J., Proc. Natl. Acad. Sci. USA 2022, 119, e2114365119; - PMC - PubMed
    7. g) Muller M. A., Zweig N., Spengler B., Weinert M., Heiles S., Anal. Chem. 2023, 95, 11672. - PubMed
    1. a) Chan‐Andersen P. C., Romanova E. V., Rubakhin S. S., Sweedler J. V., J. Biol. Chem. 2022, 298, 102254; - PMC - PubMed
    2. b) Molenaar M. R., Shahraz M., Delafiori J., Eisenbarth A., Ekelof M., Rappez L., Alexandrov T., Front. Mol. Biosci. 2022, 9, 1021889; - PMC - PubMed
    3. c) Comi T. J., Neumann E. K., Do T. D., Sweedler J. V., J. Am. Soc. Mass Spectrom. 2017, 28, 1919. - PMC - PubMed
    1. a) Krismer J., Sobek J., Steinhoff R. F., Brönnimann R., Pabst M., Zenobi R., Single Cell Metabolism. Methods in Molecular Biology, (Ed: Shrestha B.) vol 2064, Humana, New York, NY: 2020; - PubMed
    2. b) Cuypers E., Claes B. S. R., Biemans R., Lieuwes N. G., Glunde K., Dubois L., Heeren R. M. A., Anal. Chem. 2022, 94, 6180. - PMC - PubMed
    1. Xie Y. R., Chari V. K., Castro D. C., Grant R., Rubakhin S. S., Sweedler J. V., J. Proteome Res. 2023, 22, 491. - PMC - PubMed

MeSH terms

LinkOut - more resources