. 2025 Feb;12(5):e2406282.
doi: 10.1002/advs.202406282. Epub 2024 Dec 12.

Platelet-Monocyte Aggregate Instigates Inflammation and Vasculopathy in Kawasaki Disease

Affiliations

Platelet-Monocyte Aggregate Instigates Inflammation and Vasculopathy in Kawasaki Disease

Yuan Zhang et al. Adv Sci (Weinh). 2025 Feb.

Abstract

Kawasaki disease (KD) is a severe acute febrile illness and systemic vasculitis that causes coronary artery aneurysms in young children. Platelet hyperreactivity and an aberrant immune response are key indicators of KD; however, the mechanism by which hyperactive platelets contribute to inflammation and vasculopathy in KD remains unclear. A cytokine-mediated positive feedback loop between KD platelets and monocytes is identified. KD platelet-monocyte aggregates (MPAs) are mediated by an initial interaction of P-selectin (cluster of differentiation 62P, CD62p) and its glycoprotein ligand 1 (PSGL-1). This is followed by a coordinated interaction of platelet glycoprotein (GP)Ibα with monocyte CD11b. Monocyte-activated platelets initiate transforming growth factor (TGF)β1 release, which results in nuclear localization of nuclear factor kappaB in monocytes, therefore, driving the phenotypic conversion of classical monocytes (CD14+CD16-) into proinflammatory monocytes (CD14+CD16+). The platelet-activated monocytes release interleukin-1 and tissue necrotic factor-α, which promote further platelet activation. KD-induced inflammation and vasculopathy are prevented by inhibiting the components of this positive feedback loop. Notably, mice deficient in platelet TGFβ1 show less MPA and CD14+CD16+ monocytes, along with reduced inflammation and vasculopathy. These findings reveal that platelet-monocyte interactive proteins (CD62p/PSGL-1 and (GP)Ibα/CD11b) and cytokine mediators (platelet TGFβ1) are potential biomarkers and therapeutic targets for KD vasculopathy.

Keywords: Kawasaki disease; inflammation; monocyte; platelet; vasculopathy.


Conflict of interest statement

The authors declare no conflict of interest.

Figures
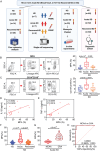
Figure 1
Figure 1
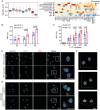
MPA is associated with coronary pathology and serves as a biomarker for coronary artery aneurysm. A) Flowchart depicting the overall experimental design of this study. B) Gating strategy for MPA (CD14+CD41+) and box plots showing the cell proportion of MPA (CD14+CD41+) in PBMC from participants. Lineage‐APC indicates anti‐human Lineage Cocktail (CD3, CD19, CD20, CD56). Kruskal–Wallis test and Dunn's multiple comparisons test. C) Gating strategy for CD14+CD16+ monocytes and box plots showing the cell proportion of CD14+CD16+ monocytes in PBMC from participants. Lineage‐APC indicates anti‐human Lineage Cocktail (CD3, CD19, CD20, CD56). One‐way ANOVA and Tukey's multiple comparisons test. D,E) Correlation of MPA ratio to (D) IL‐1β (n = 18), (E) TNF‐ɑ (n = 18) in individuals with Acute KD. F) The proportion (%) of MPA in HS (n = 60), Acute KD (n = 32), and Recovered KD (n = 60) in the diagnostic cohort was measured relative to Lin (CD3, CD19, CD20, CD56) CD11b+ cells. Kruskal–Wallis test and Dunn's multiple comparisons test. G) The proportion (%) of MPA in patients with NCAA (n = 16) and CAA (n = 16) during Acute KD was measured relative to Lin (CD3, CD19, CD20, CD56) CD11b+ cells. Unpaired t test. H) A receiver operating characteristic (ROC) analysis was performed to evaluate the ability of the MPA ratio during the acute phase to distinguish KD patients with NCAA from CAA. HS, healthy subject; KD, Kawasaki disease; MPA, platelet–monocyte aggregate; NCAA, noncoronary artery aneurysm; CAA, coronary artery aneurysm; ANOVA, analysis of variance.
Figure 2
Figure 2
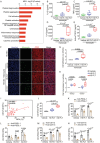
MPA contributes higher risk to cytokine storm during acute KD. A) UMAP plot visualization of peripheral blood immune cells colored by annotated cell types. Each point represents a single cell, and the cell types were annotated and colored based on 3′ gene expression. B) Dot plot showing the expression of KD‐associated risk genes in each major cell type. The color is scaled by log2FC of acute KD versus HS, log2FC > 0 label as red, log2FC < 0 label as blue. The dot size is proportional to the mean expression of genes associated with KD identified in recent GWAS studies. C) UMAP plot of total cells colored by inflammatory score. The gene set termed “HALLMARK_INFLAMMATORY_RESPONSE” from MsigDB. Box plots showing the inflammatory score of cell subtypes (left panel), and heatmap depicting the average normalized expression of genes significantly upregulated in monocytes (right panel). D) UMAP plot of total cells colored by cytokine score. The cytokine genes were collected based on the references of Kawasaki disease (Table S3, Supporting Information). Box plots showing the cytokine score of cell subtypes (left panel), and heatmap depicting the average normalized expression of cytokine genes reported elevation in KD in each cell types (right panel). E) UMAP visualization of monocytic lineage separated into 9 subtypes. F) UMAP visualization of MPA colored by platelet marker genes (PPBP, PF4, ITGA2B, TUBB1, CAVIN2), and monocyte marker genes (CD14, VCAN, CTSD, S100A8, S100A9). G) Dot plots of top50 marker gene expression involved in pathways including transcriptional regulation, TNF signaling, innate immune response, cell adhesion, scavenger function, complemental receptor, chemotaxis, and platelet degranulation in each monocytic subtype. HS, healthy subject; KD, Kawasaki disease; PLT, platelet; MPA, platelet–monocyte aggregate; GWAS, genome‐wide association study; FC, flod change.
Figure 3
Figure 3
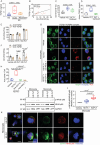
Hyperactive KD platelets are prone to crosstalk with monocytes. A) Box plot of the cytokine score in monocytes from each subtype. Significance was evaluated with the Wilcoxon rank‐sum test. B) Isolated monocytes from HS were cocultured with HS or KD platelets (1 × 10⁷) for 2, 4, and 8 h (n = 5). The ratio of MPA was shown. Two‐way ANOVA and Sidak's multiple comparisons test. C) Isolated monocytes from HS were cocultured with HS or KD platelets for 8 h (n = 5). The ratio of MPA was shown. Two‐way ANOVA and Sidak's multiple comparisons test. D,E) Representative immunofluorescence of monocytes isolated from HS and KD subjects (D), or incubated with HS and KD platelets (E), CD14 stained as green, CD41 as red, and nuclei visualized with Hoechst (blue), n = 6. Scale bar: 20 µm. F) 3D reconstruction of confocal Z‐stack images of monocytes cocultured with KD platelets (n = 6). CD14 stained as green, CD41 as red, and nuclei visualized with Hoechst (blue). Scale bar: 10 µm.
Figure 4
Figure 4
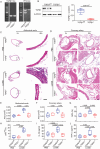
KD platelets crosstalk with monocytes via forming “adhesion junctions”. A) Flow cytometry analysis showing CD62p expression in platelets from HS (n = 24) and KD patients (n = 24). Unpaired t test. B) Correlation between MPA and CD62p positive platelets in patients with acute KD (n = 24). p value was calculated using correlation analysis. C) Heatmap showing selected ligand–receptor interactions between MPA and subtypes of monocytes. D) Immunostaining of PSGL‐1 (blue), CD14 (green), CD41 (red), and CD62p (gray) in monocytes after coculture with KD platelets for 8 h. Activated CD41+ platelets (red) forming CD62p (gray) and PSGL‐1‐mediated junctions (blue) with CD14+ monocytes (green) are shown (n = 6). Scale bar: 5 µm. E) Immunostaining of CD11b (blue), CD14 (green), CD41 (red), GPIbα (gray) in monocytes after coculture with KD platelets for 8 h. Activated CD41+ platelets (red) forming GPIbα (gray) and CD11b‐mediated junctions (blue) with CD14+ monocytes (green) are shown (n = 6). Scale bar: 5 µm. F,G) Proximity ligation assay (PLA) showing adhesion junctions of CD62p–PSGL‐1 (F), GPIbα–CD11b (G) on monocytes. PLA staining: red; nuclei: blue; wheat germ agglutinin (WGA): green (n = 5). Scale bar: 10 µm. PLT, platelet; HS, healthy subject; KD, Kawasaki disease; MPA, platelet–monocyte aggregate; ITGAM, integrin subunit alpha M (CD11b).
Figure 5
Figure 5
Disruption of MPA formation protects from the development of KD vasculopathy. A,B) Representative H&E staining of the abdominal aorta (A) and coronary artery (B) from PBS (n = 8) and LCWE‐injected mice (n = 8), LCWE‐injected mice followed by administration with aspirin (ASP) (n = 8), anti‐GPIbα (n = 8), anti‐PSGL‐1 (n = 8) were shown. Scale bar: 50 µm. C,D) Quantification of the areas of thickened media layer in the abdominal aorta (C) and coronary artery (D) from each group. Kruskal–Wallis test and Dunn's multiple comparisons test in (C), one‐way ANOVA and Tukey's multiple comparisons test in (D). E,F) Bar plots showing MPA (E) and Ly6Cint monocytes (F) in peripheral blood from PBS‐injected (n = 8) and LCWE‐injected mice (n = 8), LCWE‐injected mice followed by administration with ASP (n = 8), anti‐GPIbα (n = 8), anti‐PSGL‐1 (n = 8). Kruskal–Wallis test and Dunn's multiple comparisons test in (E), one‐way ANOVA and Tukey's multiple comparisons test in (F). G,H) Levels of IL‐1β (G), TNF‐α (H) in plasma from PBS‐injected mice (n = 6), LCWE‐injected mice (n = 8), LCWE‐injected mice followed by administration with ASP (n = 6), anti‐GPIbα (n = 6), anti‐PSGL‐1 (n = 6). One‐way ANOVA and Tukey's multiple comparisons test. I) Flow cytometry analysis showing the surface expression of CD62p on platelets from patients with NCAA (n = 12) and CAA (n = 12). Unpaired t test. J,K) Levels of TNF‐α (J), and IL‐1β (K) in plasma from patients with NCAA and CAA (n = 15). Unpaired t test. LCWE, L. casei cell wall extract; PLT, platelet; ASP, aspirin; MPA, platelet–monocyte aggregate; NCAA, noncoronary artery aneurysm; CAA, coronary artery aneurysm.
Figure 6
Figure 6
KD platelets skew circulating monocytes toward a proinflammatory phenotype via the formation of “adhesion junctions”. A) Enriched gene ontology (GO) terms in genes highly expressed in MPA. B–E) Levels of IL‐1β (B), TNF‐α (C), IL‐6 (D) (n = 7), and active TGFβ1 (E) (n = 5) in cell‐free supernatants from coculture of monocytes and HS or KD platelets were evaluated by LEGENDplex assay. One‐way ANOVA and Tukey's multiple comparisons test. F) Monocytes were incubated with HS or KD platelets for 16 h and then cocultured with TNF‐α‐treated HUVECs for 2 h, immunostaining of CMFDA‐labeled monocytes (green), CD31 (red), nuclei (blue) in HUVECs were shown (n = 6). Scale bar: 20 µm. G) Quantification of CMFDA‐labeled monocytes adhesion to HUVECs versus vehicle (n = 6). One‐way ANOVA and Tukey's multiple comparisons test. H) Monocytes were cultured with HS or KD platelets for 16 h, and the comparative value of monocytes migrated in response to CCL2 and CCL5 versus vehicle (n = 6). p values were calculated by two‐way ANOVA and Tukey's multiple comparisons test. I) Correlation between the ratio of MPA and CD14+CD16+ monocytes in PBMCs from KD patients (n = 67). p value was calculated using correlation analysis. J) Monocytes were cultured alone or with HS platelets and KD platelets for 16 h, and the CD14+CD16+ monocyte was evaluated by flow cytometry analysis (n = 5). K,L) Flow cytometry analysis of CD14+CD41+ (K), CD14+CD16+ monocytes (L) after coculture with HS or KD platelets in the presence of antibody against PSGL‐1 (n = 6). Two‐way ANOVA and Sidak's multiple comparisons test. (M,N) Flow cytometry analysis of CD14+CD41+ (M), CD14+CD16+ monocytes (N) after coculture with HS or KD platelets in the presence of antibody against CD11b (n = 6). Two‐way ANOVA and Sidak's multiple comparisons test. PLT, platelet; HS, healthy subject; KD, Kawasaki disease; MPA, platelet–monocyte aggregate; CCL2, C─C motif chemokine ligand 2; CCL5, C─C motif chemokine ligand 5.
Figure 7
Figure 7
“Adhesion junctions” between KD platelets and monocytes induced TGFβ release and NFκB nuclear translocation in monocytes. A) Box plot showing levels of TGFβ1 in plasma from participants. HS: n = 10, Acute KD: n = 8, Recovered KD: n = 10. B) Correlation between CD14+CD16+ monocytes and plasma TGFβ1 in KD patients (n = 18). p value was calculated using correlation analysis. C) Flow cytometry analysis of the CD14+CD16+ monocytes after direct coculture with KD platelets, or in a transwell system for 16 h (n = 6). One‐way ANOVA and Tukey's multiple comparisons test. D) The level of active TGFβ1 in the supernatant of monocytes after direct coculture with KD platelets, or in a transwell system for 16 h (n = 6). One‐way ANOVA and Tukey's multiple comparisons test. E,F) Flow cytometry analysis of CD14+CD41+ (E), CD14+CD16+ monocytes (F) after coculture with HS or KD platelets in the presence of antibody against TGFβ1 (n = 6). Two‐way ANOVA and Sidak's multiple comparisons test. G) PLA showing adhesion junctions of TGFβ1–TGFβRII on monocytes. PLA staining: red; nuclei: blue; WGA: green. Scale bar: 10 µm. H) Quantification of average points per cell in each group determined by ImageJ, and subjected to statistical analysis for significance. One‐way ANOVA and Tukey's multiple comparisons test. I,J) The expression (I) and quantification (J) of phosphorylated NFκB and total NFκB in monocytes cocultured with HS or KD platelets were determined by Western blot (n = 6). p values were calculated by one‐way ANOVA and Tukey's multiple comparisons test. K) Representative immunofluorescence images of nuclear translocation of NFκB in monocytes isolated from HS and KD patients (n = 5). CD14 was stained as green, NFκB as red, and nuclei were visualized with Hoechst (blue). Scale bar: 10 µm. HS, healthy subject; KD, patients with Kawasaki disease; PLT, platelets.
Figure 8
Figure 8
Silencing of platelet TGFβ1 protects from MPA‐mediated KD vasculopathy. A) Verification of TGFβ1 excision in hematopoietic cells using genomic PCR. B) The expression and quantification of TGFβ1 in platelets isolated from Plt–TGFβ1 KO (PF4‐Cre: TGFβ1fl/fl) mice and TGFβ1 flox (TGFβ1fl/fl) mice were determined by Western blot (n = 5). Unpaired t test. C,D) Representative hematoxylin and eosin (H&E) staining of the abdominal aorta (C) and coronary artery (D) from TGFβ1 flox and Plt–TGFβ1 KO mice injected with PBS (n = 5) or LCWE (n = 6) were shown. Scale bar: 50 µm. E,F) Quantification of the areas of thickened media layer in the abdominal aorta (E) and coronary artery (F) from each group. Kruskal–Wallis test and Dunn's multiple comparisons test. G,H) Bar plots showing MPA (G) and Ly6Cint monocytes (H) in peripheral blood from PBS‐injected TGFβ1 flox (n = 5), PBS‐injected Plt–TGFβ1 KO mice (n = 5), LCWE‐injected TGFβ1 flox (n = 6), and LCWE‐injected Plt–TGFβ1 KO mice (n = 6). One‐way ANOVA and Tukey's multiple comparisons test in (G), Kruskal–Wallis test and Dunn's multiple comparisons test in (H). I,J) Levels of IL‐1β (I), TNF‐α (J) in plasma from PBS‐injected TGFβ1fl/fl (n = 5), PBS‐injected Plt–TGFβ1 KO mice (n = 5), LCWE‐injected TGFβ1 flox (n = 6), and LCWE‐injected Plt–TGFβ1 KO mice (n = 6). One‐way ANOVA and Tukey's multiple comparisons test. LCWE, L. casei cell wall extract; PLT, platelet; ASP, aspirin; MPA, platelet–monocyte aggregate; Plt–TGFβ1 KO, PF4‐Cre: TGFβ1fl/fl; TGFβ1 flox, TGFβ1fl/fl.

References

    1. Noval Rivas M., Arditi M., Nat. Rev. Rheumatol. 2020, 16, 391. - PMC - PubMed
    1. Newburger J. W., Takahashi M., Burns J. C., J. Am. Coll. Cardiol. 2016, 67, 1738. - PubMed
    1. Zhang Y., Wang Y., Zhang L., Xia L., Zheng M., Zeng Z., Liu Y., Yarovinsky T., Ostriker A. C., Fan X., Weng K., Su M., Huang P., Martin K. A., Hwa J., Tang W. H., Circ. Res. 2020, 127, 855. - PMC - PubMed
    1. Shulman S. T., Rowley A. H., Nat. Rev. Rheumatol. 2015, 11, 475. - PubMed
    1. Denby K. J., Clark D. E., Markham L. W., Heart 2017, 103, 1760. - PubMed

Substances

LinkOut - more resources