. 2025 Feb;12(5):e2407408.
doi: 10.1002/advs.202407408. Epub 2024 Dec 12.

TEAD1-Mediated Trans-Differentiation of Vascular Smooth Muscle Cells into Fibroblast-Like Cells Contributes to the Stabilization and Repair of Disrupted Atherosclerotic Plaques

Affiliations

TEAD1-Mediated Trans-Differentiation of Vascular Smooth Muscle Cells into Fibroblast-Like Cells Contributes to the Stabilization and Repair of Disrupted Atherosclerotic Plaques

Ming Zhai et al. Adv Sci (Weinh). 2025 Feb.

Abstract

Atherosclerotic plaque rupture mainly contributes to acute coronary syndrome (ACS). Insufficient repair of these plaques leads to thrombosis and subsequent ACS. Central to this process is the modulation of vascular smooth muscle cells (VSMCs) phenotypes, emphasizing their pivotal role in atherosclerotic plaque stability and healing post-disruption. Here, an expansion of FSP1+ cells in a tandem stenosis (TS) model of atherosclerotic mice is unveiled, predominantly originating from VSMCs through single-cell RNA sequencing (scRNA-seq) analyses and VSMC lineage tracing studies. Further investigation identified TEA domain transcription factor 1 (TEAD1) as the key transcription factor driving the trans-differentiation of VSMCs into fibroblast-like cells. In vivo experiments using a TS model of plaque rupture demonstrated that TEAD1 played a crucial role in promoting plaque stability and healing post-rupture through pharmacological or TEAD1-AAV treatments. Mechanistically, it is found that TEAD1 promoted the expression of fibroblast markers through the Wnt4/β-Catenin pathway, facilitating the trans-differentiation. Thus, this study illustrated that TEAD1 played a critical role in promoting the trans-differentiation of VSMCs into fibroblast-like cells and subsequent extracellular matrix production through the Wnt4/β-Catenin pathway. Consequently, this process enhanced the healing mechanisms following plaque rupture, elucidating potential therapeutic avenues for managing atherosclerotic instability.

Keywords: ACS; TEAD1; atherosclerotic plaque; plaque rupture; thrombosis.


Conflict of interest statement

The authors declare no conflict of interest.

Figures

Figure 1
Figure 1
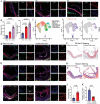
FSP1+ cells were expanded along with atherosclerosis progression. A,B) Uniform manifold approximation and projection (UMAP) visualization and violinplot of single cell RNA sequencing (scRNA‐seq) data from atherosclerotic plaques (GSE197073) and ligated carotid arteries (GSE174098). C) Immunofluorescence staining (IF) of FSP1 was performed on plaques from brachiocephalic artery of mice fed an HFD for 10, 15, and 20 weeks. The white dot line showed the plaque area, the white star represented lumen area. Scale bar = 100 µm. D) Quantification the percentage of FSP1+ cells/total cells in C (n = 5 per group). For all panels, error bars represented standard error of the mean (SE). P‐value was determined by one‐way ANOVA with Bonferroni post‐test (D). ns no significance, *P < 0.05, **P < 0.01, ***P < 0.001, and ****P < 0.0001.
Figure 2
Figure 2
VSMCs were the primary source of FSP1+ cells in atherosclerotic plaques. A) IF staining of FSP1 on plaques from brachiocephalic artery of Myh11Cre B6G/R Ldlr−/− mice fed an HFD for 10, 15, and 20 weeks. Scale bar = 100 µm. B) (Left) Quantification of the percentage of plaque area % (n = 5 per group). (Right) Quantification of the number of tdTomato+FSP1+ cells within the plaques harvested from three‐time points HFD‐fed Myh11Cre B6G/R Ldlr−/− mice (n = 5 per group). C) UMAP visualization of our previous scRNA‐seq data. D) Featureplot of FSP1 (S100A4) on zsGreen+ fibroblasts and tdTomato+ fibroblasts from C. E) Representative images of CD68 on stable and unstable aortic root plaques. Scale bar = 100 µm. F) Representative images of Oil Red O staining on stable and unstable aortic root plaques. Scale bar = 100 µm. G) Representative images of TER119 on stable and unstable aortic root plaques. Scale bar = 100 µm. H) Representative images of Masson staining on stable and unstable aortic root plaques. Scale bar = 100 µm. I) Representative images of tdTomato+FSP1+ area on stable and unstable aortic root plaques. Scale bar = 100 µm. J) the quantification of vulnerability index between unstable (high index) and stable (low index) groups (n = 8 per group). K) the quantification of the percentage of tdTomato+ FSP1+ cells within plaque area between unstable (high index) and stable (low index) group (n = 8 per group). For all panels, error bars represented SE. P‐value was determined by unpaired two‐tailed Student's t‐test (J and K) or one‐way ANOVA with Bonferroni post‐test (B). ns no significance, *P < 0.05, **P < 0.01, ***P < 0.001, and ****P < 0.0001.
Figure 3
Figure 3
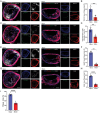
VSMCs‐derived FSP1+ fibroblast‐like cells contributed to healing after plaque rupture. A) Representative images of TER119 IF staining on brachiocephalic artery plaques harvested from Myh11Cre B6G/R Ldlr−/− mice treated with either injury or sham surgery. Scale bar = 50 µm. B) Quantification of the percentage of TER119+ area/plaque area in A (n = 5 per group). C) Representative images of FSP1 IF staining on brachiocephalic artery plaques harvested from Myh11Cre B6G/R Ldlr−/− mice treated with either injury or sham surgery. Scale bar = 50 µm. D) Quantification of the percentage of tdTomato+FSP1+ cells/tdTomato+ cells in C (n = 5 per group). E) Representative images of MMP9 IF staining on brachiocephalic artery plaques harvested from Myh11Cre B6G/R Ldlr−/− mice treated with either injury or sham surgery. Scale bar = 50 µm. F) Quantification of the percentage of MMP9+ area/plaque area in E (n = 5 per group). G) Representative images of CD68 IF staining on brachiocephalic artery plaques harvested from Myh11Cre B6G/R Ldlr−/− mice treated with either injury or sham surgery. Scale bar = 50 µm. H) Quantification of the percentage of CD68+ area/plaque area in G (n = 5 per group). I) Quantification of the percentage of plaque area % between injury and sham group. For all panels, error bars represented SE. P‐value was determined by unpaired two‐tailed Student's t‐test (B, D, F, H, and I). ns no significance, *P < 0.05, **P < 0.01, ***P < 0.001, and ****P < 0.0001.
Figure 4
Figure 4
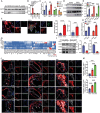
TEAD1 promoted the trans‐differentiation of VSMCs into fibroblast‐like cells and production of extracellular matrix. A) Representative WB images demonstrated that FGF21 exhibited the highest efficiency in inducing the trans‐differentiation of RASMCs into fibroblast‐like cells. B) Quantification of the WB results of A (n = 3 per group). C) The relative mRNA expression levels of FSP1, FN1, COL3A1, and MYH11 were compared between RASMCs and FGF21‐stimulated RASMCs (n = 3 per group). D) FGF21 promoted the expression of FSP1, FN1, and COL3A1 in RASMCs. E. Quantification of the WB results of D (n = 3 per group). F. The morphology changes in RASMCs following FGF21 stimulation by IF staining of FSP1 and α‐SMA (n = 5 per group). Scale bar = 20 µm. G) SCENIC analysis displayed the key transcriptional factors of different cell subtypes. H) The relative mRNA expression levels of TEAD1 and FSP1 were compared between RASMCs and FGF21‐stimulated RASMCs (n = 3 per group). I) After transfection with TEAD1 siRNA, the trans‐differentiation of RASMCs into fibroblast‐like cells was inhibited (n = 3 per group). J) IF staining of FSP1 and TEAD1 on the series plaques from brachiocephalic artery of Myh11Cre B6G/R Ldlr−/− mice fed an HFD for 10, 15, and 20 weeks. The white arrows indicated tdTomato+FSP1+ cells or tdTomato+TEAD1+ cells. Scale bar = 100 and 20 µm. K) Quantification of the percentages of tdTomato+FSP1+ cells/ tdTomato+ cells and tdTomato+TEAD1+ cells/tdTomato+ cells in J (n = 5 per group). For all panels, error bars represented SE. P‐value was determined by unpaired two‐tailed Student's t‐test (C, E, F, H, and I) or one‐way ANOVA with Bonferroni post‐test (B and K). ns no significance, *P < 0.05, **P < 0.01, ***P < 0.001, and ****P < 0.0001.
Figure 5
Figure 5
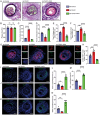
TEAD1 inhibitor VT‐103 attenuated plaque stability and hindered plaque healing after rupture. A,B) IF staining of TER119 on plaques from Myh11Cre B6G/R Ldlr−/− mice that underwent TS surgery treated with either control or VT‐103 (n = 5 per group). Scale bar = 100 µm. C,D) IF staining of CD41 on plaques from Myh11Cre B6G/R Ldlr−/− mice that underwent TS surgery treated with either control or VT‐103 (n = 5 per group). Scale bar = 100 µm. E,F) IF staining of FSP1 on plaques from Myh11Cre B6G/R Ldlr−/− mice that underwent TS surgery treated with either control or VT‐103 (n = 5 per group). Scale bar = 100 µm. G,H) IF staining of MMP9 on plaques from Myh11Cre B6G/R Ldlr−/− mice that underwent TS surgery treated with either control or VT‐103 (n = 5 per group). Scale bar = 100 µm. I) MOVAT pentachrome staining on plaques from Myh11Cre B6G/R Ldlr−/− mice that underwent TS surgery treated with either control or VT‐103 (n = 5 per group). Scale bar = 100 µm. J–L) Quantification of the percentages of necrotic area/plaque area, type I collagen area/plaque area and type III collagen area/plaque area in I. For all panels, error bars represented SE. P‐value was determined by unpaired two‐tailed Student's t‐test (B, D, F, H, J, K, and L). ns no significance, *P < 0.05, **P < 0.01, ***P < 0.001, and ****P < 0.0001.
Figure 6
Figure 6
TEAD1 promoted the trans‐differentiation of VSMCs into fibroblast‐like cells via the Wnt4/β‐Catenin signaling pathway. A) Volcano plots of DEGs screened by comparing aortic media from TEAD1 KO and control group. B) GSEA was performed using the DEGs of A. C) The Venn diagram showed the DEGs from RNA‐seq and TEAD1‐targeted genes. D) The heatmap displayed the expression of the Wnt signaling pathway related genes. E,F) The predicted binding sites of TEAD1 on the Wnt4 promoter. G) WB results showed that RASMCs highly expressed TEAD1 and Flag protein after transfection with plasmid overexpression of TEAD1. H) Quantification of WB results of G (n = 4 per group). I) Gel electrophoresis analysis showed TEAD1 bound to the promoter region of Wnt4 after the TEAD1‐DNA complex was pulled using anti‐Flag antibodies. J) Quantification of results of I (n = 3 per group). K) The relative mRNA expression levels of Wnt4, β‐Catenin, COL3A1, and FSP1 were compared between RASMCs and RASMCs stimulated with FGF21 at concentrations of 1.5 and 3 µg ml−1 (n = 3 per group). L) WB results showed increased protein expression of Wnt4, β‐Catenin and FSP1 in RASMCs after FGF21 stimulation. M) Quantification of WB results of L (n = 4 per group). N) WB results indicated that the protein expression levels of TEAD1, Wnt4, β‐Catenin, FSP1, and COL3A1 were inhibited following transfection with TEAD1 siRNA in FGF21 stimulated RASMCs. O) Quantification of WB results of N (n = 3 per group). For all panels, error bars represented SE. P‐value was determined by unpaired two‐tailed Student's t‐test (H,M) or one‐way ANOVA with Bonferroni post‐test (J, K, and O). ns no significance, *P < 0.05, **P < 0.01, ***P < 0.001, and ****P < 0.0001.
Figure 7
Figure 7
Wnt4/β‐Catenin inhibitor IWP4 could reverse the positive effect of SMC‐specific TEAD1‐AAV. A) Representative images of MOVAT pentachrome staining on plaques harvested from Ad‐control, Ad‐TEAD1 and Ad‐TEAD1+IWP4 groups. Scale Bar = 100 µm. B–F) Quantification the percentages of plaque area%, fibrous area%, necrotic area%, type I collagen area%, and type III collagen area% in A (n = 5 per group). G) IF staining of α‐SMA and FSP1 on plaques harvested from Ad‐control, Ad‐TEAD1 and Ad‐TEAD1+IWP4 groups. Scale bar = 100 µm. H) Quantification the percentage of α‐SMA+FSP1+ cells/α‐SMA+ cells in G (n = 5 per group). I–K) Representative IF staining of TER119, CD41 and MMP9 on plaques harvested from Ad‐control, Ad‐TEAD1 and Ad‐TEAD1+IWP4 groups. Scale bar = 100 µm. L–N) Quantification the percentages of TER119+ area/plaque area, CD41+ area/plaque area and MMP9+ area/plaque area in I–K, respectively (n = 5 per group). For all panels, error bars represented SE. P‐value was determined by one‐way ANOVA with Bonferroni post‐test. ns no significance, *P < 0.05, **P < 0.01, ***P < 0.001, and ****P < 0.0001.

References

    1. Ahmadi A., Argulian E., Leipsic J., Newby D. E., Narula J., J. Am. Coll. Cardiol. 2019, 74, 1608. - PubMed
    1. Stone P. H., Libby P., Boden W. E., JAMA Cardiol. 2023, 8, 192. - PMC - PubMed
    1. Gaba P., Gersh B. J., Muller J., Narula J., Stone G. W., Nat. Rev. Cardiol. 2023, 20, 181. - PubMed
    1. Montone R. A., Camilli M., Russo M., Termite C., La Vecchia G., Iannaccone G., Rinaldi R., Gurgoglione F., Del Buono M. G., Sanna T., Trani C., Liuzzo G., Crea F., Niccoli G., JACC Cardiovasc. Imaging 2022, 15, 325. - PubMed
    1. Rashid I., Maghzal G. J., Chen Y.‐C., Cheng D., Talib J., Newington D., Ren M., Vajandar S. K., Searle A., Maluenda A., Lindstedt E.‐L., Jabbour A., Kettle A. J., Bongers A., Power C., Michaëlsson E., Peter K., Stocker R., Eur. Heart J. 2018, 39, 3301. - PubMed

MeSH terms

LinkOut - more resources