. 2024 Dec 23;37(1):koae317.
doi: 10.1093/plcell/koae317.

Arabidopsis WALL-ASSOCIATED KINASES are not required for oligogalacturonide-induced signaling and immunity

Affiliations

Arabidopsis WALL-ASSOCIATED KINASES are not required for oligogalacturonide-induced signaling and immunity

Laura Herold et al. Plant Cell. .

Abstract

Carbohydrate-based cell wall signaling impacts plant growth, development, and stress responses; however, how cell wall signals are perceived and transduced remains poorly understood. Several cell wall breakdown products have been described as typical damage-associated molecular patterns that activate plant immunity, including pectin-derived oligogalacturonides (OGs). Receptor kinases of the WALL-ASSOCIATED KINASE (WAK) family bind pectin and OGs and were previously proposed as OG receptors. However, unambiguous genetic evidence for the role of WAKs in OG responses is lacking. Here, we investigated the role of Arabidopsis (Arabidopsis thaliana) WAKs in OG perception using a clustered regularly interspaced short palindromic repeats mutant in which all 5 WAK genes were deleted. Using a combination of immune assays for early and late pattern-triggered immunity, we show that WAKs are dispensable for OG-induced signaling and immunity, indicating that they are not bona fide OG receptors.


Conflict of interest statement

Conflict of interest statement. None declared.

Figures
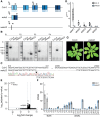
Figure 1.
Figure 1.
WakΔ2 is a full WAK deletion mutant. A) Schematic representation of the genomic arrangement of WAK1–5 in Arabidopsis. The middle cartoon shows the genomic deletion in wakΔ and the consequent fusion of WAK4 and WAK2. The lower cartoon shows the genomic region of the WAK cluster in wakΔ2. Black arrows indicate primer pairs (P) used in B. B) Genotyping gel of Col-0, wakΔ, and wakΔ2. Ethidium bromide-stained PCR products for parts indicated in A on agarose gel. P1–P4 refer to the primer pairs shown in A. bp, base pair. C) Sequencing results from the wakΔ2 mutant aligned against the 5′UTR of WAK4 and part of the third exon of WAK2 of Col-0. D) Transcript levels of WAK1–5 in Col-0 and wakΔ2 determined by RT-qPCR. RNA was extracted from 14-d-old Arabidopsis seedlings grown in liquid culture. Transcripts were normalized to the house-keeping gene UBOX. Shapes indicate different biological replicates harvested at different times. This experiment was performed 2 times. CT, cycle threshold. E) Overall changes in Col-0 vs. wakΔ2 transcriptomes in liquid-grown seedlings. F)WAK and WAK-like transcript levels in Col-0 vs. wakΔ2. FPKM, fragments per kilobase of transcripts per million mapped reads. G) Photos of 4-wk-old Arabidopsis plants grown on soil. Images were digitally extracted for comparison. Scale bar = 1 cm.
Figure 2.
Figure 2.
WAKs are not required for OG-induced early immune responses. A and B) ROS production in response to OG10–15 in leaf discs of 3- to 4-wk-old Arabidopsis plants. 100 µg/mL to 1 mg/mL of OG10–15 were used as concentration dependent of the experiment. RLU, relative luminescent units. A) Representative graph of the kinetics of 1 replicate (n = 12 leaf discs of 6 plants). 1 mg/mL OG10–15 was used as concentration. Mean ± SE are plotted. B) Values are means of total photon counts over 30 min. Data from 3 independent experiments are shown (n = 6 to 8 plants dependent on the experiment). Shapes indicate different replicates. Statistical test: Kruskal–Wallis test (P = 0.3302). Groups with like letter designations are not statistically different. C and D) MAPK activation assay with 2-wk-old seedlings in response to 100 µg/mL OG10–15 (C), 100 µg/mL OG3 (D) or mock (C, D). Samples were collected 0, 5, and 15 min after elicitation as indicated. Blots were probed with α-p44/42. Coomassie brilliant blue (CBB) was used as loading control. E) Ethylene accumulation after treatment with 100 µg/mL OG10–15 or water as control in 4- to 6-wk-old Arabidopsis leaves. Individual data points represent measured plants from 3 replicates indicated by different shapes performed at different days. Equal letters at the top of the panel indicate P > 0.05, Kruskal–Wallis test (P-value = 0.0001058) with Dunn’s post hoc multiple comparison test. These experiments were performed 3 times at different times. B) and C) Boxplots show median with 0.25 and 0.75 quartiles. Whiskers represent 1.5 and -1.5 times the interquartile range.
Figure 3.
Figure 3.
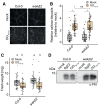
WAKs are not required for OG-induced late immune responses. A and B) Callose deposition in response to 100 µg/mL OG10–15 or water 24 h after infiltration into leaves of 3- to 4-wk-old Arabidopsis plants. n = 16 to 32 leaf discs from 4 different plants were taken per independent experiment. The experiment was performed 2 times with similar results. A) Representative images of OG-induced callose deposition in the presented genotypes stained with aniline blue. B) Relative callose deposits induced by OGs and water infiltration. Individual data points for each leaf disc are shown, and different shapes indicate individual experiments. Asterisks indicate statistical difference from mock treatment within 1 genotype (P < 0.05). Statistical test: Kruskal–Wallis test (P-value <2.2 × 10⁻¹⁶) with Dunn’s host hoc multiple comparison test. C) Fresh weight of 2-wk-old seedlings grown in liquid media for 10 d in the presence of 200 µg/mL OG10–15 or in the absence of neither (mock). Individual values for each plant and experiment (n = 12 to 14 seedlings per experiment) are shown, and different shapes indicate the different 3 replicates. Equal letters at the top of the panel indicate P > 0.05, Kruskal–Wallis test (P-value = 1.565 × 10⁻⁵) with Dunn’s post hoc multiple comparison test. Groups with like letter designations are not statistically different. The experiment was repeated 3 times with similar results. D) PR1 accumulation assessed by immunoblotting with PR1 antibodies. Leaves from 3-wk-old Arabidopsis plants were infiltrated with water (mock), 1 µM flg22, or 100 µg/mL OG10–15 and harvested after 24 h. The experiment was repeated 3 times with similar results. B) and C) Boxplots show median with 0.25 and 0.75 quartiles. Whiskers represent 1.5 and -1.5 times the interquartile range.
Figure 4.
Figure 4.
OG-induced immunity is not affected in wakΔ2. A and B) OG-induced resistance against B. cinerea. Four- to five-wk-old Col-0 or wakΔ2 plants were infiltrated with water or 100 µg/mL OG10–15 24 h prior drop inoculation with B. cinerea strain BMM spores (5 µL; 5 × 10⁵ spores/mL). Lesion areas were measured 48 h post-inoculation. The experiment was performed 4 times. A) Quantification of lesion sizes. Individual values for each leaf and experiment (n = 18 to 24 per experiment) are shown. Different shapes indicate different experiments. Equal letters at the top of the panel indicate P > 0.05, Kruskal–Wallis test (P-value = 8.572 × 10⁻¹⁴) with Dunn’s multiple comparison post hoc test. Groups with like letter designations are not statistically different. B) Representative images of OG-induced immunity in the different genotypes. Images were taken 48 h post-inoculation. Images were digitally extracted for comparison. Scale bar = 1 cm. C) OG-induced resistance against P. syringae pv tomato DC3000. Four- to five-wk-old plants were pretreated with water or 100 µg/mL OG10–15 for 24 h before infiltration with P. syringae. 48 h after P. syringae infiltration, bacteria were extracted and plated. Individual data points from the 3 pooled experiments (n = 6 per experiment, total = 18) are shown with different shapes per experiment. Equal letters at the top of the panel indicate P > 0.05, 2-way ANOVA with Tukey’s post hoc test. Groups with like letter designations are not statistically different. The experiment was performed 3 times. CFU, colony forming units. A) and C) Boxplots show median with 0.25 and 0.75 quartiles. Whiskers represent 1.5 and -1.5 times the interquartile range.
Figure 5.
Figure 5.
flg22-induced immunity is not affected by the loss of WAK1–5. A and B) ROS production in leaf discs of 3- to 4-wk-old plants using 100 nm flg22 in Col-0, bak1-5/bkk1-1, fls2/efr/cerk1, and wakΔ2. The experiment was repeated at least 3 times (A and B). Mean ± SEs are plotted. RLU, relative luminescent units. A) Kinetics of 3 representative independent replicates over 40 to 60 min. B) Values are means of total photon counts over 60 min as stated in the graph. Individual data points show ROS production in individual plants (n = 6 to 8 plants with each 2 leaf discs). Kruskal–Wallis test (P-value = 1.233 × 10⁻¹⁰) with Dunn’s post hoc test. Groups with like letter designations are not statistically different. C) MAPK activation assay with 2-wk-old seedlings in response to 1 µM flg22. Samples were collected 0, 5, and 15 min after elicitation as indicated. Blot was probed with α-p44/42. CBB was used as loading control. D) Ethylene accumulation after treatment with 1 µM flg22 or water as control in 4- to 6-wk-old Arabidopsis. Three pooled replicates with individual data points for each leaf are shown. Equal letters at the top of the panel indicate P > 0.05, Kruskal–Wallis test (P-value = 3.907 × 10⁻⁹) with Dunn’s post hoc multiple comparison test. E) OG-induced resistance against P. syringae pv tomato DC3000. Four- to five-wk-old plants were pretreated with water or 1 µM flg22 for 24 h before infiltration with P. syringae. 48 h after P. syringae infiltration, bacteria were extracted and plated. Individual data points from the 3 pooled experiments (n = 6 per experiment) are shown. Equal letters at the top of the panel indicate P > 0.05, Kruskal–Wallis test (P-value <2.2 × 10⁻¹⁶) with Dunn’s post hoc multiple comparison test. Groups with like letter designations are not statistically different. CFU, colony forming units. F) Primary root length of 9-d-old Col-0 and wakΔ2. Plants were grown on ½ MS plates for 5 d and then transferred to liquid MS +1% sucrose containing mock, 10 nm pep1, or 100 nm flg22. Root growth was determined after 4 d in liquid culture. Six plants were measured per experiment. Values correspond to length of each root in cm. Equal letters at the top of the panel indicate P > 0.05, 2-way ANOVA with Tukey’s post hoc test. All experiments were performed 3 times with similar results; only primary root length was only measured twice. B), D), E), and F) Boxplots show median with 0.25 and 0.75 quartiles. Whiskers represent 1.5 and -1.5 times the interquartile range.

References

    1. Abarca A, Franck CM, Zipfel C. Family-wide evaluation of RAPID ALKALINIZATION FACTOR peptides. Plant Physiol. 2021:187(2):996–1010. 10.1093/plphys/kiab308 - DOI - PMC - PubMed
    1. Anderson CM, Wagner TA, Perret M, He Z-H, He D, Kohorn BD. WAKs: cell wall-associated kinases linking the cytoplasm to the extracellular matrix. Plant Mol Biol. 2001:47(1/2):197–206. 10.1023/A:1010691701578 - DOI - PubMed
    1. Bacete L, Mélida H, Miedes E, Molina A. Plant cell wall-mediated immunity: cell wall changes trigger disease resistance responses. Plant J. 2018:93(4):614–636. 10.1111/tpj.13807 - DOI - PubMed
    1. Beffa RS, Hofer R-M, Thomas M, Meins F. Decreased susceptibility to viral disease of [beta]-1,3-glucanase-deficient plants generated by antisense transformation. Plant Cell. 1996:8(6):1001–1011. 10.2307/3870211 - DOI - PMC - PubMed
    1. Bender KW, Couto D, Kadota Y, Macho AP, Sklenar J, Derbyshire P, Bjornson M, DeFalco TA, Petriello A, Font Farre M, et al. . Activation loop phosphorylation of a non-RD receptor kinase initiates plant innate immune signaling. Proc Natl Acad Sci U S A. 2021:118(38):e2108242118. 10.1073/pnas.2108242118 - DOI - PMC - PubMed

LinkOut - more resources