. 2025 Jan 6;222(1):e20232079.
doi: 10.1084/jem.20232079. Epub 2024 Dec 12.

Baseline colitogenicity and acute perturbations of gut microbiota in immunotherapy-related colitis

Affiliations

Baseline colitogenicity and acute perturbations of gut microbiota in immunotherapy-related colitis

Joan Shang et al. J Exp Med. .

Abstract

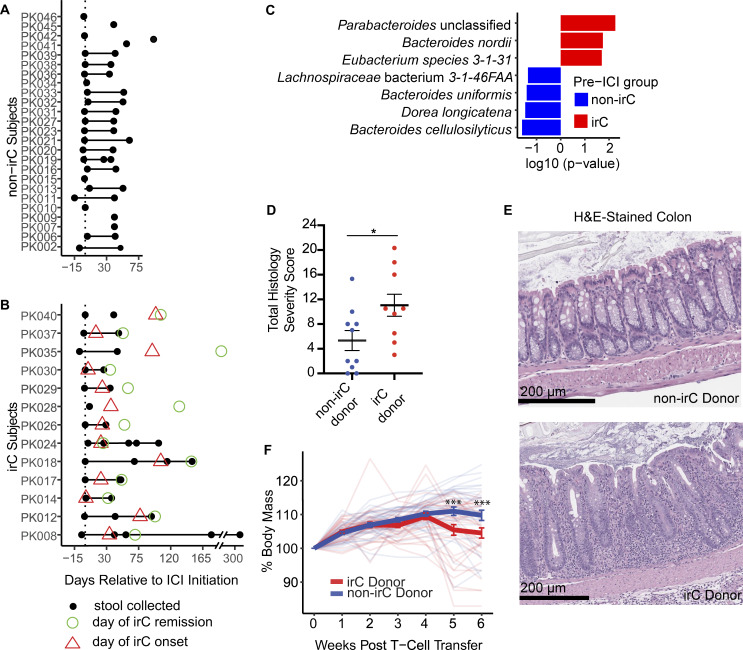
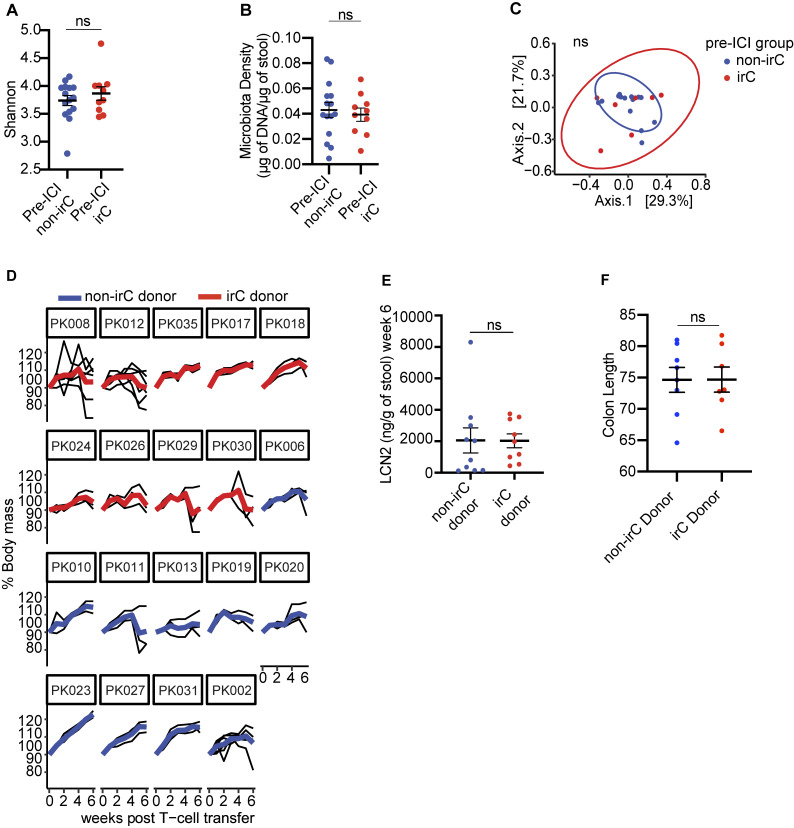
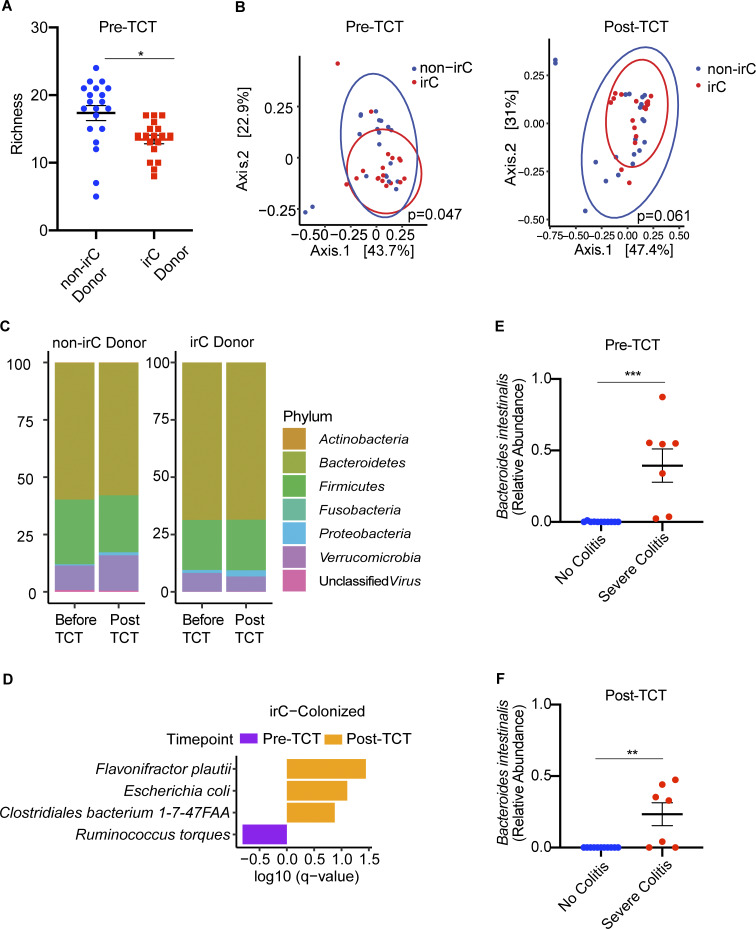
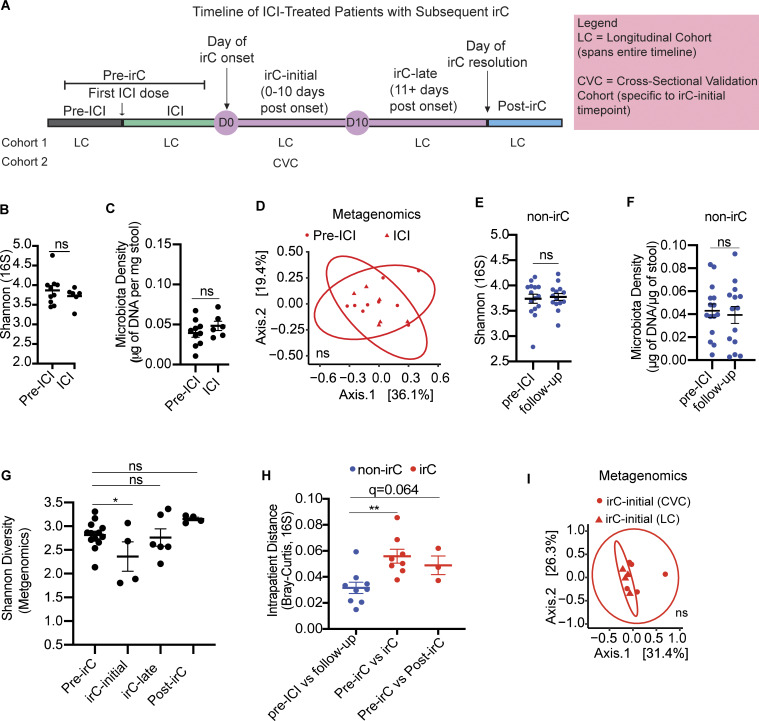
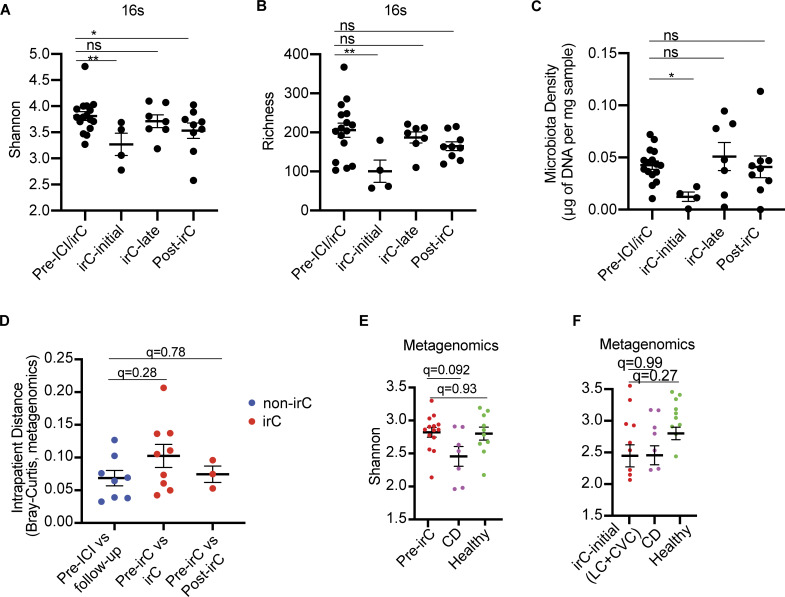
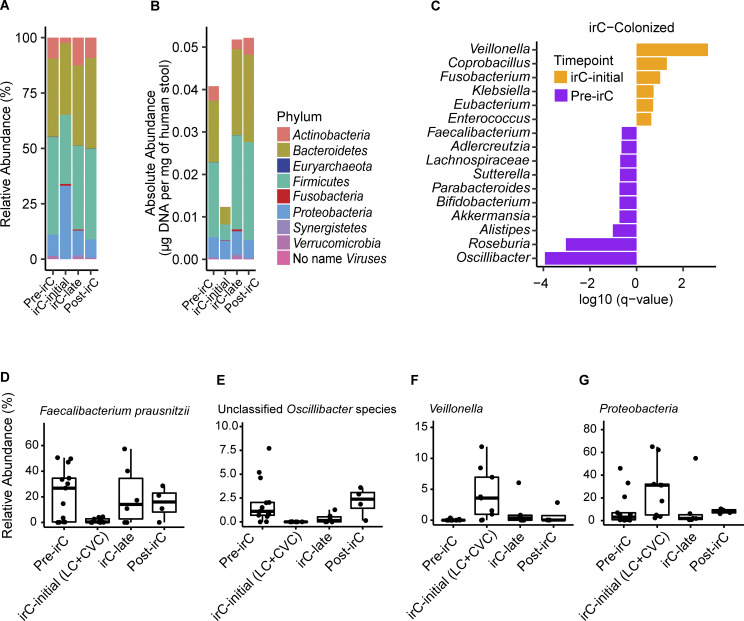
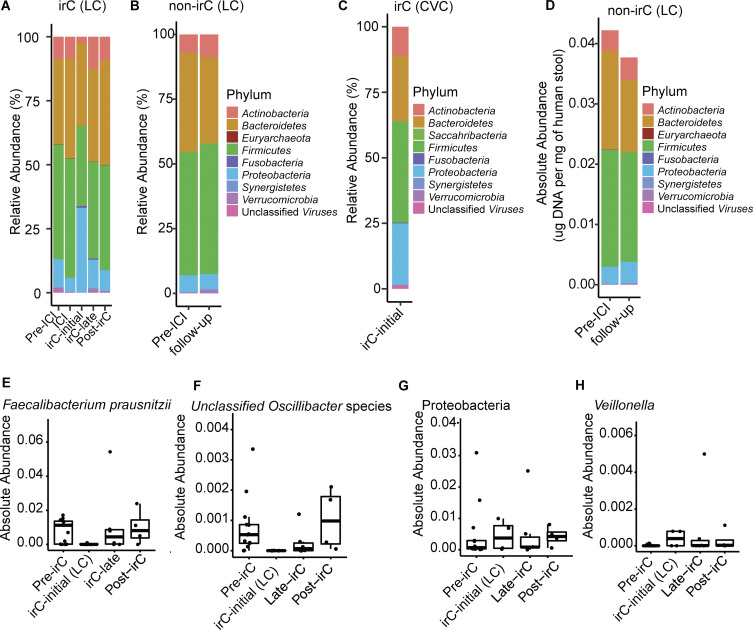
Immunotherapy-related colitis (irC) frequently emerges as an immune-related adverse event during immune checkpoint inhibitor therapy and is presumably influenced by the gut microbiota. We longitudinally studied microbiomes from 38 ICI-treated cancer patients. We compared 13 ICI-treated subjects who developed irC against 25 ICI-treated subjects who remained irC-free, along with a validation cohort. Leveraging a preclinical mouse model, predisease stools from irC subjects induced greater colitigenicity upon transfer to mice. The microbiota during the first 10 days of irC closely resembled inflammatory bowel disease microbiomes, with reduced diversity, increased Proteobacteria and Veillonella, and decreased Faecalibacterium, which normalized before irC remission. These findings highlight the irC gut microbiota as functionally distinct but phylogenetically similar to non-irC and healthy microbiomes, with the exception of an acute, transient disruption early in irC. We underscore the significance of longitudinal microbiome profiling in developing clinical avenues to detect, monitor, and mitigate irC in ICI therapy cancer patients.


Conflict of interest statement

Disclosures: R. Menon reported personal fees from Vedanta Biosciences Inc. outside the submitted work. A. Elkrief reported grants from Kanvas Bio and “other” from AstraZeneca, BMS, and Merck during the conduct of the study. J.U. Peled reported “other” from Seres Therapeutics and grants from NHLBI K08HL 143189, P30 CA008748, Society of Memorial Sloan Kettering Cancer Center, and V Foundation during the conduct of the study; personal fees from DaVolterra, CSL Behring, Crestone Inc, MaaT Pharma, Canaccord Genuity, and RA Capital and “other” from Postbiotics Plus Research and Prodigy Biosciences outside the submitted work; in addition, J.U. Peled had a patent number #15/756,845; filed 3/1/18 -METHODS AND COMPOSITIONS FOR DETECTING RISK OF CANCER RELAPSE licensed “Seres Therapeutics,” a patent number #62/977,908; filed 5/6/19 issued, and a patent number #62/843,849, filed 2/18/20 pending; and Memorial Sloan Kettering Cancer Center (MSK) has financial interests relative to Seres Therapeutics. N.J. Shah reported personal fees from Merk and grants from Exelixis and HiberCell outside the submitted work. M. Postow reported personal fees from BMS, Merck, Novartis, Eisai, Pfizer, Chugai, Erasca, Nektar, and Lyvgen, and grants from Rgenix, Infinity, BMS, Merck, Genentech, Novartis, and Bioatla outside the submitted work. J.-F. Colombel reported grants from AbbVie, Bristol Myers Squibb, and Janssen Pharmaceuticals and personal fees from Amgen, AnaptysBio, Allergan, Arena Pharmaceuticals, Astellas, Boehringer Ingelheim, Celgene Corporation, Celltrion, Eli Lilly, Ensho, Envision Pharma, Ferring Pharmaceuticals, Galmed Research, Glaxo Smith Kline, Genentech (Roche), Kaleido Biosciences, Immunic, Iterative Scopes, Merck, Landos, Microba Life Science, Novartis, Otsuka Pharmaceutical, Pfizer, Protagonist Therapeutics, Sanofi, Sun, Takeda, TiGenix, Vedanta Biosciences, Vifor, and Intestinal Biotech Development outside the submitted work. S. Gnjatic reported personal fees from Taiho Pharmaceuticals and grants from Regeneron, Bristol Myers Squibb, Takeda, Boehringer Ingelheim, Celgene, and Genentech outside the submitted work. D.M. Faleck reported personal fees from Teva, Janssen, Gilead, and Ferring outside the submitted work. J.J. Faith reported grants from Janssen Research & Development and personal fees from Vedanta Biosciences, Genfit, and Seed Health outside the submitted work. No other disclosures were reported.

Figures

Figure 1.
Figure 1.
irC patients exhibit colitogenicity in microbiome prior to irC development in a TCT colitis model. (A and B) Stool collection (black circle) for 25 non-irC (A) and 13 irC patients (B). Day of irC onset (red triangle) and day of irC remission (green circle) are shown as days relative to the first ICI dose (vertical dotted line). (C) MaAsLin2 analysis (species level) examined metagenomic pre-ICI microbiome profiles of irC (red, n = 9) and non-irC patients (blue, n = 15). Features displayed are P < 0.05. The horizontal bar length indicates log10(P value) associated with each species. (D and E) Total colonic histology severity score (D) and representative H&E-stained colon sections (E) 7–8 wk after TCT in Rag1−/− mice colonized with microbiotas from patients who would remain irC-free (blue) or eventually developed irC (red). Each dot in D represents the averaged colonic histology severity score by each microbiota donor (9 irC, 10 non-irC) (Mann-Whitney P = 0.033). (E) Upper: Non-inflamed colon section from the murine recipient of non-irC patient’s microbiota. Lower: Inflamed colon section from murine recipient of pre-colitis microbiota from irC patient. Moderate mucosal and submucosal inflammation with crypt and goblet cell loss, crypt hyperplasia, and muscle thickening. The horizontal bars in E represent the scale bar 200 µm. (F) Weekly body mass percentage change (relative to week 0) following TCT in Rag1−/− mice colonized with microbiota from 9 irC patients (red) or from 10 non-irC patients (blue) with three to seven mice receiving a single fecal microbiota. Bolded blue and red lines represent the mean ± SEM of all irC or non-irC-colonized group of mice, respectively, at each week after TCT. Individual opaque thin lines represent the body mass change of individual mice. The linear mixed-effect model showed no significant difference in weight between the irC- and non-irC-colonized mice (P = 0.63) at week 0 but a significant effect of patient colitis status on raw weight change at weeks five and six after TCT (week 5, P = 1.7 × 10⁻⁴; week 6, P = 3.2 × 10⁻⁴). Plots D–F are combined from three independent experiments. Analysis included a total of 67 mice (experiment 1: n = 19, 2: n = 24, 3: n = 24) colonized with 19 human microbiotas (n = 10 irC patients, n = 9 non-irC patients). Three to seven mice colonized per microbiota donor. Error bars represent mean ± SEM. *P < 0.05 and ***P < 0.001. Linear mixed model fit by restricted maximum likelihood with P value estimations using Satterthwaite’s method “lmerModLmerTest” was performed to evaluate differences in body mass change between irC and non-irC microbiota-colonized mice groups. Mann-Whitney was performed to assess differences in colonic histological severity scores between irC and non-irC microbiota-colonized mice groups.
Figure S1.
Figure S1.
Colitogencity in microbiomes of irC patients prior to irC development and FMT to gnotobiotic mice exacerbates murine colitis in the TCT model. (A and B) Comparison of 16S rRNA Shannon diversity (A) and microbiota density (B) between gut microbiomes sampled prior to ICI initiation between irC (n = 10) and non-irC patients (n = 15) by Mann-Whitney (A, P = NS, B, P = NS). (C) PCoA plot of Bray-Curtis dissimilarity of fecal microbiota sampled prior to ICI initiation and assessed by metagenomic sequencing in patients who eventually develop irC (n = 10, red) or remain irC-free (n = 15, blue) (PERMANOVA P = 0.71). (D) Weekly body mass percentage (relative to week 0 weight) after TCT in Rag1−/− mice, grouped by microbiota donor (red = irC patient, blue = non-irC patient). Presented as averaged weekly relative body mass (bolded red or blue line) of each microbiota donor and individual murine body mass (thin black line). (E and F) (E) Comparison of LCN2 (right, P = NS) of irC-colonized (red) versus non-irC-colonized (blue) mice 6 wk after TCT or (F) colon length (mm) at sacrifice endpoint. Individual dots represent the average by microbiota donor. Plots D–F used three to seven mice colonized per human microbiota donor, and plots D–F involved analysis of 67 mice (experiment 1: n = 19, 2: n = 24, 3: n = 24) colonized with 19 human microbiotas (n = 10 irC patients, n = 9 non-irC patients). Plot F used 15 microbiota donors, combined using two independent TCT experiments two and three. Error bars represent mean ± SEM. NS P >0.05 by Mann-Whitney.
Figure 2.
Figure 2.
Metagenomics of murine stool microbiome colonized with either irC or non-irC associated microbiotas. Murine stool microbiomes were longitudinally sampled before and after TCT. (A) Comparison of microbiome richness before colitis induction by TCT, between mice colonized by irC (red) or non-irC (blue) microbiota (the former donor group, patient stool collected before irC development). Individual dots represent individual mice. A linear mixed model via lme4 was applied (P = 0.013) to account for the non-independence of murine samples colonized by the same patient donor. (B) PCoA based on Bray-Curtis distances of species-level microbial communities from murine stool samples before TCT (left) and after TCT (right). Samples are colored based on their designation as receiving microbiome from either non-irC donor (blue) or irC donor (red). The multivariate homogeneity of group dispersions was tested using PERMANOVA (P = 0.047 for pre-TCT and P = 0.061 for post-TCT). (C) Taxonomic composition plot of operational taxonomic units at the phylum-level pre- and post-TCT in non-irC and irC-colonized mice. Each vertical bar represents the average fecal microbiota composition of non-irC or irC donor group at the indicated timepoint (before or after TCT). (D) Top differentially abundant bacterial species in murine microbiomes of irC-colonized mice, either before colitis induction (pre-TCT, purple) or after (post-TCT, orange), identified by MaAsLin2. Horizontal bar length indicates log10(q-value) associated with each species. MaAsLin2 parameters included centered log ratio normalization and linear model analysis. Analysis included n = 18 mice with paired pre- and post-TCT samples. Random effects accounted for microbiota donor (to control for non-independence among mice colonized with the same microbiota donor) and mouse ID (to control for non-independence of paired samples from the same mouse). (E and F) Top differentially abundant bacterial species in murine microbiomes agonistic to donor source and based solely on murine colon histology severity score quartile show relative abundance of Bacteroides intestinalis between no colitis (blue) versus severe colitis (red) mice (E) at pre-TCT (MaAsLin2 P = 0.00048, q = 0.025) and (F) at post-TCT (MaAsLin2 P = 0.0029, q = 0.13). First quartile (orange; no colitis, score = 0); fourth quartile (green; severe colitis, score ≥14); n = 18 mice. Bar length indicates log10(q-value) associated with each taxon. MaAsLin2 parameters included centered log ratio normalization and linear model analysis. Random effects accounted for microbiota donor (to control for non-independence among mice colonized with the same microbiota donor). The study included n = 18 mice with paired pre- and post-TCT samples (n = 7 mice with severe colitis, n = 11 mice with no colitis). Data in A–F plots are combined from three independent TCT experiments, which used 19 human microbiotas (experiment 1: n = 3 human microbiotas, experiment 2: n = 8 human microbiotas, and experiment 3: n = 8 human microbiotas). From each microbiota donor, fecal samples from two mice were represented at each timepoint (pre- and post-TCT) where pre-TCT represents week 0 and post-TCT represents weeks 7–8 post-TCT to be metagenomically sequenced and analyzed. Data in plots A–D used n = 38 mice with paired pre- and post-TCT samples. Taxa presented in D–F had q < 0.25. Error bars represent mean ± SEM. From each microbiota donor, fecal samples from two mice were represented at each timepoint (pre- and post-TCT) where pre-TCT represents week 0 and post-TCT represents weeks 7–8 post-TCT. *P < 0.05, **P < 0.01, and ***P < 0.001. Linear mixed model fit by restricted maximum likelihood with P value estimations using Satterthwaite’s method “lmerModLmerTest.”
Figure S2.
Figure S2.
Microbiome markers of non-irC patients and irC-patients and comparison of microbial composition with validation cohort. (A) Schematic representation of the temporal progression of ICI-treated patients who develop irC, marked by significant clinical events: first ICI dose, irC onset, irC resolution. Timepoints are categorized into distinct segments: pre-ICI, ICI, irC-initial (0–10 days post-onset), irC-late (11+ days post-onset), and post-irC (resolution of irC symptoms). Of note, pre-ICI and ICI pooled together are referred to as “pre-irC” to represent the time segment preceding irC onset. The continuous observation of the prospective LC spans the entire timeline, from pre-ICI to post-irC. CVC is a cross-sectional validation cohort and focuses specifically on the irC-initial segment. D0 and D10 indicate the start and end of the irC-initial phase, respectively. (B–D) Shannon diversity using 16S rRNA sequencing data (P = NS) (B) or microbiota density (P = NS) using linear mixed model (C) or PCoA on Bray-Curtis distances of metagenomic profiles (D) to compare microbiota composition of Pre-ICI (circle) and Pre-irC microbiomes (triangle) from LC using PERMANOVA (P = NS) of irC patients microbiomes collected before ICI initiation and at ICI. (E and F) Shannon diversity using 16S rRNA sequencing data (E) and microbiota density (F) of non-irC microbiomes (blue) collected before ICI initiation and 5–7 wk after ICI initiation (follow-up) (E, P = NS; F, P = NS). Linear mixed model fit by restricted maximum likelihood. (G) Temporal Shannon diversity using metagenomic profiles at distinct irC disease stages using linear mixed model to compare Shannon values at pre-irC versus irC-initial (P = 0.015, irC-late (P = NS), post-irC (P = NS). (H) Microbiota profiles change (Bray-Curtis distances) over time within individuals (red = irC patients, blue = non-irC patients) using 16S rRNA sequencing data. Intrapatient comparison of microbiome in nine non-irC patients with paired stool samples collected at pre-ICI and follow-up (5–7 wk post-ICI initiation). For irC, intrapatient comparison of paired stool samples was collected at (1) pre-irC and active irC (irC-initial/irC-late) (in eight patients) (P = 0.0037, q = 0.0074) or (2) pre-irC and post-irC (in three patients, P = 0.064, q = 0.064). Mann-Whitney with BH for adjustment. (I) PCoA plot on Bray-Curtis distances to compare metagenomic profiles of microbiota composition by PERMANOVA (P = NS) of irC-initial microbiomes between patients from CVC and LC (red). Mann-Whitney *P < 0.05, **P < 0.01, NS P > 0.05. Linear mixed model fit by restricted maximum likelihood with P value estimations using Satterthwaite’s method “lmerModLmerTest.”
Figure 3.
Figure 3.
Longitudinal sampling of patient gut microbiomes at indicated timepoints in LC cohort, along with samples from patients with CD, healthy participants, or irC patients from CVC cohort (validation). (A–C) Longitudinal alpha diversity (A) and observed richness (B) using 16S rRNA sequencing data and microbiota density (C) at distinct irC disease stages (pre-irC, irC-initial, irC-late, and post-irC) (n = 13 irC patients). Linear mixed model fit by restricted maximum likelihood with P value estimations using Satterthwaite’s method “lmerModLmerTest.” Comparison of values at pre-irC versus irC-initial (A, P = 0.0042; B P = 0.0019; C, P = 0.036), irC-late (A, P = 0.039; B, P = NS; C, P = NS), post-irC (A, P = NS; B, P = NS; C, P = NS). (D) Intrapatient metagenomic microbiota profiles change (Bray-Curtis distance) over time within either irC patients (red) or non-irC patients (blue). Intrapatient comparison of microbiotas in eight non-irC patients (blue) with paired stool samples collected at pre-ICI and follow-up (4–7 wk post-ICI initiation). For irC microbiomes (red), intrapatient comparison of paired stool samples collected at (1) pre-irC and active irC (in nine irC patients) or (2) pre-irC and post-irC (in three irC patients). Mann-Whitney compared the dissimilarity of non-irC paired samples against that of irC paired samples (pre-irC versus irC, P = 0.14, q = 0.28; pre-irC versus post-irC, P = 0.78, q = 0.78). (E) Comparison of alpha diversity between pre-irC metagenomic microbiomes profiles of irC patients (red), patients with CD (purple), and healthy individuals (green). Mann-Whitney (P value) and BH adjustment (q-value) to compare alpha diversity between groups (pre-irC versus CD: P = 0.046, q = 0.092; pre-irC versus healthy P = 0.93, q = 0.93). (F) Comparison of alpha diversity between irC-initial metagenomic microbiome profiles of irC patients (from LC and CVC) (red), patients with CD (purple), and healthy individuals (green). Mann-Whitney (P value) and BH adjustment (q-value) to compare alpha diversity between groups (irC-initial versus CD: P = 0.99, q = 0.99; irC-initial versus healthy P = 0.13, q = 0.27). Mann-Whitney P values in E and F were adjusted for multiple comparisons (q-value) by the BH method. *P < 0.05, **P < 0.01; P value estimations using Satterthwaite’s method “lmerModLmerTest.”
Figure 4.
Figure 4.
Fecal microbial taxonomic signatures are differentially associated with distinct stages of irC. (A and B) Longitudinal taxonomic profiling of irC patients’ microbiomes at pre-irC, irC-initial, irC-late, and post-irC in terms of (A) relative abundance of operational taxonomic units at the phylum-level by metagenomic profiling and (B) absolute abundance. (C) Top bacterial genus associated with pre-irC versus irC-initial identified by MaAsLin2 using metagenomically sequenced microbiomes of irC patients at pre-irC (orange, n = 13) and irC-initial (purple, n = 9 where n = 4 from LC and n = 5 from CVC). Random effect adjusted for non-independence of repeated measures. The horizontal bar length indicates log10(q-value), in which q-value was calculated by BH adjustment of P value. Genus presented q < 0.25. MaAsLin2 parameters included centered log ratio normalization and linear model analysis. (D–G) Temporal dynamic changes in the relative abundance of (D) Faecalibacterium prausnitzii, (E) unclassified Oscillibacter species, (F) Veillonella genus, (G) Proteobacteria phylum in irC patients at pre-irC, irC-initial, irC-late, and post-irC. irC-initial samples were pooled from both irC cohorts (LC and CVC). Based on metagenomic profiles. Each symbol represents data from an individual patient; the boxplot displays a central line presenting the median, accompanied by a box that encloses the interquartile range (IQR) and extends whiskers up to the farthest data point within 1.5 times the IQR.
Figure S3.
Figure S3.
Taxonomic composition at phylum-level and absolute abundance of select taxa in irC and non-irC patients. (A–C) Relative abundance of operational taxonomic units at the phylum level (A) of irC patients from LC at five timepoints (pre-ICI, ICI, irC-initial, irC-late, and post-irC) or (B) of non-irC from LC at pre-ICI and follow-up (5–7 wk after the first dose of ICI) or (C) irC-initial gut microbiomes from irC patients of validation cohort, CVC. Each bar represents the average fecal microbiota composition at the indicated timepoint within a patient group. (D) Absolute abundance at phylum level of non-irC patients at pre-ICI and follow-up (5–7 wk after the first dose of ICI). (E–H) Temporal dynamic changes in the absolute abundances of (E) Faecalibacterium prausnitzii, (F) unclassified Oscillibacter species, (G) Proteobacteria phylum, and (H) Veillonella genus in irC patients of LC at pre-irC, irC-initial, irC-late, and post-irC relative abundance from metagenomic profiles and microbiota density were used to calculate each taxa’s absolute abundance. Each symbol represents data from an individual patient; boxplot displays a central line presenting the median, accompanied by a box that encloses the interquartile range (IQR) and extends whiskers up to the farthest data point within 1.5 times the IQR.

References

    1. Abu-Sbeih, H., and Wang Y.. 2020. Gut microbiome and immune checkpoint inhibitor-induced enterocolitis. Dig. Dis. Sci. 65:797–799. 10.1007/s10620-020-06103-x - DOI - PubMed
    1. Aggarwala, V., Mogno I., Li Z., Yang C., Britton G.J., Chen-Liaw A., Mitcham J., Bongers G., Gevers D., Clemente J.C., et al. 2021. Precise quantification of bacterial strains after fecal microbiota transplantation delineates long-term engraftment and explains outcomes. Nat. Microbiol. 6:1309–1318. 10.1038/s41564-021-00966-0 - DOI - PMC - PubMed
    1. Ananthakrishnan, A.N., Luo C., Yajnik V., Khalili H., Garber J.J., Stevens B.W., Cleland T., and Xavier R.J.. 2017. Gut microbiome function predicts response to anti-integrin biologic therapy in Inflammatory Bowel diseases. Cell Host Microbe. 21:603–610.e3. 10.1016/j.chom.2017.04.010 - DOI - PMC - PubMed
    1. Andrews, M.C., Duong C.P.M., Gopalakrishnan V., Iebba V., Chen W.S., Derosa L., Khan M.A.W., Cogdill A.P., White M.G., Wong M.C., et al. 2021. Gut microbiota signatures are associated with toxicity to combined CTLA-4 and PD-1 blockade. Nat. Med. 27:1432–1441. 10.1038/s41591-021-01406-6 - DOI - PMC - PubMed
    1. Arthur, J.C., Perez-Chanona E., Mühlbauer M., Tomkovich S., Uronis J.M., Fan T.-J., Campbell B.J., Abujamel T., Dogan B., Rogers A.B., et al. 2012. Intestinal inflammation targets cancer-inducing activity of the microbiota. Science. 338:120–123. 10.1126/science.1224820 - DOI - PMC - PubMed

MeSH terms

Substances

LinkOut - more resources