

Regional distribution of polymorphisms associated to the disease-causing gene of spinocerebellar ataxia type 3
- PMID: 39666145
- PMCID: PMC11638412
- DOI: 10.1007/s00415-024-12829-9
Regional distribution of polymorphisms associated to the disease-causing gene of spinocerebellar ataxia type 3
Abstract
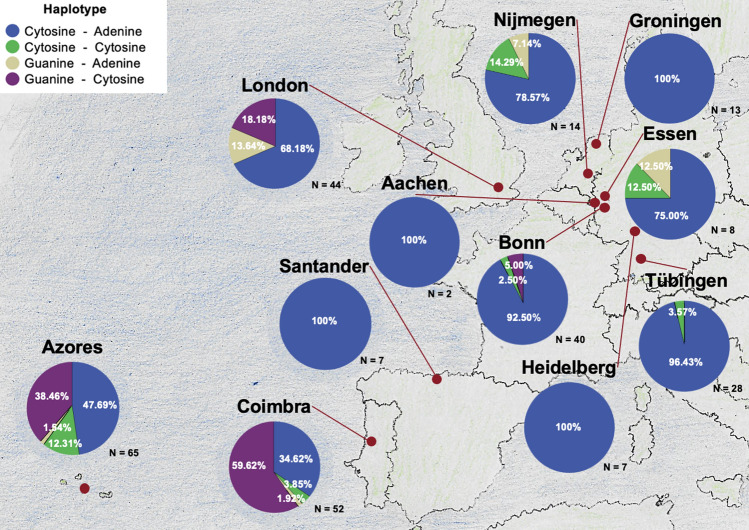
Introduction: Knowledge about the distribution and frequency of the respective haplotypes on the wildtype and mutant allele is highly relevant in the context of future gene therapy clinical studies in Spinocerebellar Ataxia Type 3, the most common autosomal dominantly inherited ataxia. Single nucleotide polymorphisms associated to the disease-causing gene, ATXN3, have been determined. We wanted to investigate the frequency and regional distribution of two intragenic single nucleotide polymorphisms (SNPs) in a large European SCA3 cohort and their relation to the clinical phenotype.
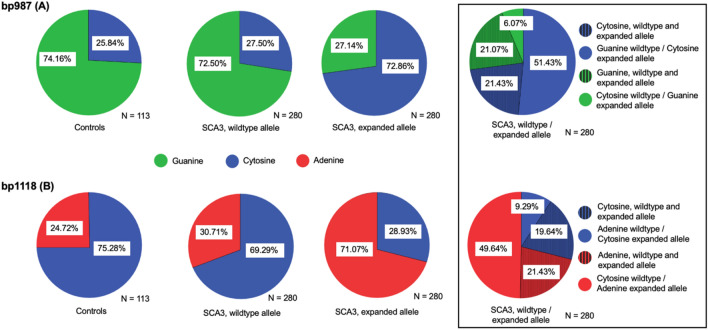
Methods: The genotypes of the two polymorphisms at base pair positions 987 and 1118 of the ATXN3 were determined for their co-localization on the normal and expanded allele, respectively, in 286 SCA3 mutation carriers and 117 healthy controls from 11 European sites.
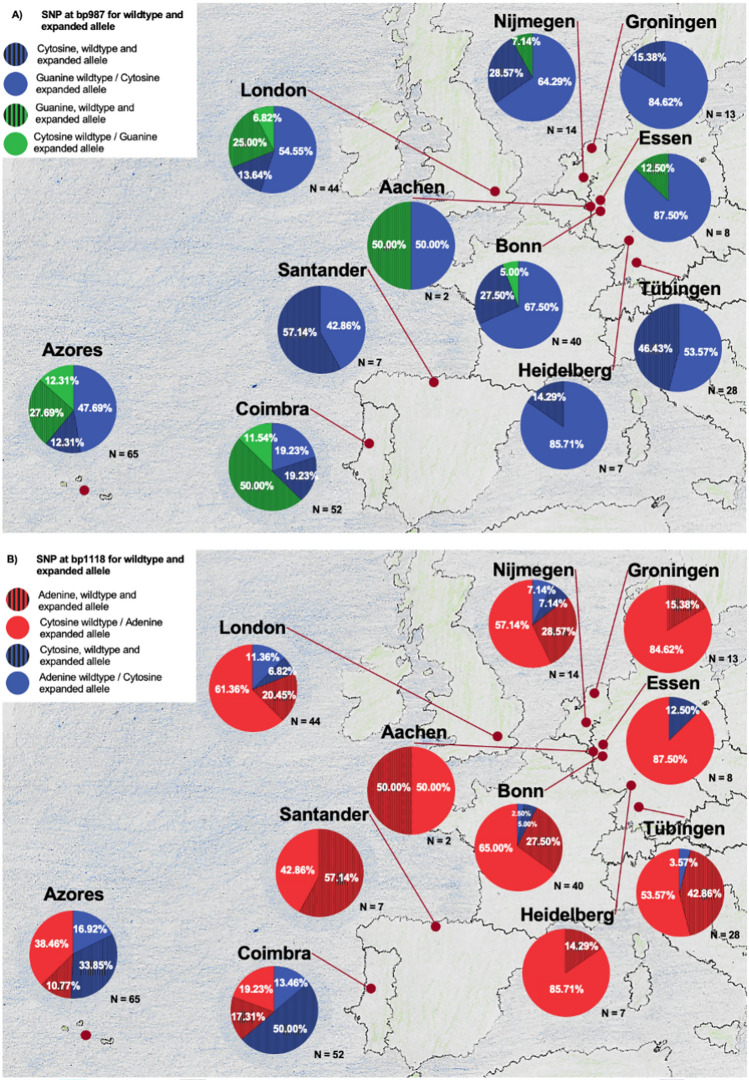
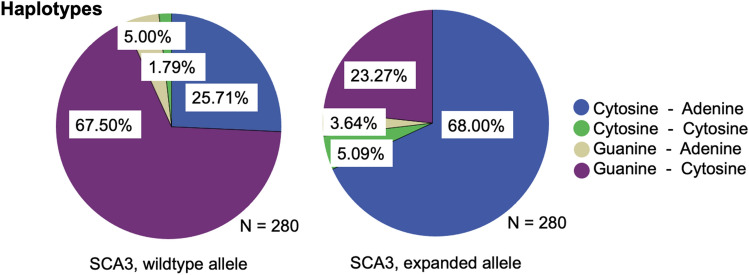
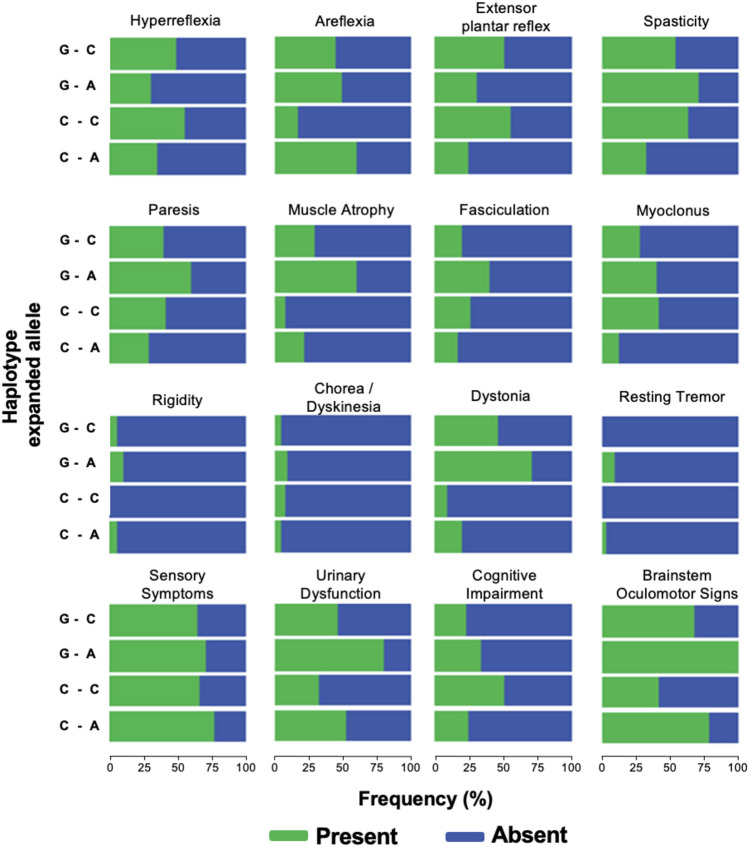
Results: The distribution of genotypes on the expanded allele differed from those of the wildtype allele of SCA3 mutation carriers and of healthy controls, and was mainly influenced by the regional origin. In our cohort, no particular clinical phenotype was associated with any specific haplotype.
Conclusions: Our results confirm distinct allocations of SNPs associated to the expanded ATXN3, and accordingly the consideration of allele-specific therapies.
Keywords: ATXN3; ASO; Polymorphism; SCA3; SNP; Spinocerebellar ataxia.
© 2024. The Author(s).
Conflict of interest statement
Declarations. Conflicts of interest: The authors declare that they have no competing interests. Ethical approval and consent to participate: The study was approved by the local ethics committees of all participating centers. Informed and written consent was obtained from all study participants at enrollment. Consent for publication: Not applicable.
Figures
References
-
- Klockgether T, Mariotti C, Paulson HL (2019) Spinocerebellar ataxia. Nat Rev Dis Primers 5(1):24 - PubMed
-
- Araujo M, Raposo M, Kazachkova N, Vasconcelos J, Kay T, Lima M (2016) Trends in the epidemiology of spinocerebellar ataxia type 3/machado-joseph disease in the azores islands. Portugal JSM Brain Science 1:1–5
-
- Maciel P, Gaspar C, Guimarães L, Goto J, Lopes-Cendes I, Hayes S et al (1999) Study of three intragenic polymorphisms in the Machado-Joseph disease gene (MJD1) in relation to genetic instability of the (CAG)n tract. Eur J Hum Genet 7(2):147–156 - PubMed
-
- Ichikawa Y, Goto J, Hattori M, Toyoda A, Ishii K, Jeong SY et al (2001) The genomic structure and expression of MJD, the Machado-Joseph disease gene. J Hum Genet 46(7):413–422 - PubMed
MeSH terms
Substances
LinkOut - more resources
Full Text Sources
