. 2024 Dec 12;135(4):e182127.
doi: 10.1172/JCI182127.

Red blood cells capture and deliver bacterial DNA to drive host responses during polymicrobial sepsis

Affiliations

Red blood cells capture and deliver bacterial DNA to drive host responses during polymicrobial sepsis

L K Metthew Lam et al. J Clin Invest. .

Abstract

Red blood cells (RBCs), traditionally recognized for their role in transporting oxygen, play a pivotal role in the body's immune response by expressing TLR9 and scavenging excess host cell-free DNA. DNA capture by RBCs leads to accelerated RBC clearance and triggers inflammation. Whether RBCs can also acquire microbial DNA during infections is unknown. Murine RBCs acquire microbial DNA in vitro, and bacterial DNA-induced (bDNA-induced) macrophage activation was augmented by WT, but not Tlr9-deleted, RBCs. In a mouse model of polymicrobial sepsis, RBC-bound bDNA was elevated in WT mice but not in erythroid Tlr9-deleted mice. Plasma cytokine analysis in these mice revealed distinct sepsis clusters characterized by persistent hypothermia and hyperinflammation in the most severely affected mice. RBC Tlr9 deletion attenuated plasma and tissue IL-6 production in the most severely affected group. Parallel findings in humans confirmed that RBCs from patients with sepsis harbored more bDNA than did RBCs from healthy individuals. Further analysis through 16S sequencing of RBC-bound DNA illustrated distinct microbial communities, with RBC-bound DNA composition correlating with plasma IL-6 in patients with sepsis. Collectively, these findings unveil RBCs as overlooked reservoirs and couriers of microbial DNA, capable of influencing host inflammatory responses in sepsis.

Keywords: Cytokines; Inflammation; Innate immunity; Pulmonology.


Conflict of interest statement

Conflict of interest: NSM is the founder of SENTICELL and the inventor on “Methods for detection of pathogenic infections using red blood cell–containing patient samples” (US provisional patent application no. 63/022,181; PCT application no. PCT/US2021/031323; no 3178218, Canada, no. 218007516 Europe).

Figures

Figure 1
Figure 1. RBCs from WT but not Erytlr9–/– mice acquire microbial DNA and demonstrate morphologic changes during sepsis.
Erytlr9–/– mice and their WT littermates were injected with CS or D5W and monitored for 24 hours. (A) Weight change and differences between groups were analyzed by 1-way ANOVA with Šidák’s multiple-comparison test. ****P < 0.0001 for WT D5W versus WT CS and Erytlr9–/– D5W versus Erytlr9–/– CS, WT CS versus Erytlr9–/– CS = NS. n = 20–30 mice per group. (B) For temperature profiles of injected mice, 88°F was the lower limit of detection. ANOVA with Šidák’s multiple-comparison analysis, ***P = 0.002 between CS-injected groups at 2 hours, **P = 0.005 between Erytlr9–/– D5W and Erytlr9–/– CS. n = 9–20 mice per group. (C) Hypothermic state of the mice by strain at 24 hours. P = 0.035, by χ2 test. (D) Kaplan-Meier survival with log-rank comparison. P = 0.031 between all groups; P = 0.08 for WT CS-injected versus Erytlr9–/– CS-injected mice. (E) RBC-associated 16S rRNA gene expression on murine RBCs was quantified 6 hours following CS-induced sepsis. One-way Kruskal-Wallis test with Dunn’s multiple-comparison test. n = 3–11. *P = 0.042 WT D5W versus WT CS; *P = 0.044 WT CS versus Erytlr9–/– CS. (F) RBCs from WT or Erytlr9–/– mice 24 hours after D5W or CS injection. Inset shows echinocytic RBCs observed in the WT CS-injected mice. Original magnification, ×40. (G) RBC score (number of echinocytes and altered RBCs/high-power field [hpf]). *P = 0.013, WT D5W versus WT CS. n = 8–14 from 3 independent studies. (H) Cell-free hemoglobin 24 hours after CS injection. Differences between groups were measured using 1-way ANOVA with Šidák’s multiple-comparison test. *P = 0.044 for WT CS versus Erytlr9–/– CS; P = NS for all other comparisons.
Figure 2
Figure 2. Plasma cytokine levels and gene expression in WT and Erytlr9–/– mice following CS injection.
(A) Plasma cytokine levels 24 hours after CS or D5W injection. n = 8–17 per group from 4 independent studies. (B) UMAP derived from the 9 measured plasma cytokine concentrations colored according to whether the mice developed persistent or transient hypothermia or were controls (D5W). (C) Weighted kernel density estimation illustrating relative concentrations (red higher, blue lower) of the cytokines in each cluster. (D) Heatmap of cytokines structured with agglomerative clustering similarly illustrating the correlation between cytokine concentration and hypothermia. (E) Plasma cytokine levels 24 hours after CS or D5W injection; plasma cytokines were stratified on the basis of hypothermic state. Trans, transient hypothermia; Pers, persistent hypothermia 24 hours after injection. (F) Splenic expression of immune genes stratified according to the hypothermic state. (G) Association between bacterial load and tissue cytokine levels in the spleen. Spearman’s correlation coefficient was determined, with an asterisk denoting a significant correlation between tissue cytokine levels and bacterial load. (H) Hepatic expression of immune genes stratified on the basis of hypothermic state. (I) Association between bacterial load and tissue cytokine levels in the liver. Spearman’s correlation coefficient was determined, with an asterisk denoting a significant correlation between tissue cytokine levels and bacterial load. n = 4–8 per temperature-stratified group from 4 independent studies (FI). *P < 0.05, **P < 0.01, ***P < 0.001, and ****P < 0.0001, by 1-way Kruskal-Wallis test with Dunn’s post hoc test (A) and 1-way ANOVA with Holm-Šidák test (E, F, and H).
Figure 3
Figure 3. Murine RBCs acquire and deliver DNA to remote organs and immune cells.
(A) TNF-α production by peritoneal macrophages 4 hours following treatment with media, RBCs (WT or Erytlr9–/–), or RBCs preincubated with S. aureus genomic DNA (Sa DNA), P. aeruginosa DNA (PsA), or CpG–ODN 1826 (CoG DBA). Results from 2–4 independent studies are shown. *P < 0.05, **P < 0.01, and ****P < 0.0001, by 1-way ANOVA followed by Holm-Šidák post hoc comparison. (B) Ly6G staining of liver sections 6 hours following transfusion of CpG or CpG-treated RBCs. Original magnification, ×10. (C) Quantification of Ly6G+ cells. (D) Plasma IL-6 levels 6 hours after transfusion of mice with CpG-treated WT or TLR9-KO RBCs. *P < 0.05 and **P < 0.01, by Kruskal-Wallis test and Dunn’s post hoc analysis (B) and unpaired, 2-tailed t test (D). n = 6–10 from 2 independent experiments.
Figure 4
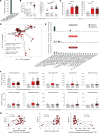
Figure 4. Analysis of bDNA associated with RBCs.
(A) RBCs were incubated with Legionella sp. followed by 16S rRNA gene amplicon sequencing on the RBCs. RBC-associated DNA was dominated by Legionella-classified amplicons (97.5%). (B) RBC-associated bDNA was quantified by qPCR of the 16S rRNA gene. Human RBCs had a greater quantity of bDNA than did negative control specimens, and RBCs from patients with sepsis had more bDNA than did RBCs from healthy volunteers. n = 27 healthy donors and n = 64 patients with sepsis. (C) RBC-associated bDNA contained a greater diversity of bacterial taxa than did negative control specimens. Negative control specimens included ddH2O, AE buffer, AE buffer run through DNA isolation columns, and DNA-free water. (D) Bacterial taxa detected in RBCs (both in health and sepsis) were distinct from those of negative control specimens and distinct from each other. (E) Abundance rank analysis demonstrated the influence of some contaminant taxa on RBC taxa (e.g., Comamonadaceae) as well as distinct taxa within RBC specimens not detected in negative control specimens. (F) Direct comparison of prominent bacterial families across negative controls and RBC from healthy individuals and patients with sepsis. (G) Among patients with sepsis, the acute inflammatory cytokine IL-6 was positively correlated with RBC-bound bDNA diversity. Unadjusted association of plasma IL-6 with community richness, the Shannon index, and community dominance are shown. When adjusted for the Acute Physiology and Chronic Health Evaluation (APACHE) score and vasopressor use, the association remained significant. Adjusted for the APACHE score: P = 0.039, P = 0.012, and P = 0.024 for richness, the Shannon index, and community dominance, respectively. Adjusted for vasopressor use: P = 0.04, P = 0.006, and P = 0.013 for richness, the Shannon index, and community dominance, respectively. n = 20 healthy controls; n = 51 patients with sepsis (CG).

Update of

References

    1. Lam LKM, et al. DNA binding to TLR9 expressed by red blood cells promotes innate immune activation and anemia. Sci Transl Med. 2021;13(616):eabj1008. doi: 10.1126/scitranslmed.abj1008. - DOI - PMC - PubMed
    1. Langelier C, et al. Detection of pneumonia pathogens from plasma cell-free DNA. Am J Respir Crit Care Med. 2020;201(4):491–495. doi: 10.1164/rccm.201904-0905LE. - DOI - PMC - PubMed
    1. Yang H, et al. Circulating microbial cell-free DNA is associated with inflammatory host-responses in severe pneumonia. Thorax. 2021;76(12):1231–1235. doi: 10.1136/thoraxjnl-2020-216013. - DOI - PMC - PubMed
    1. Bongers KS, et al. The gut microbiome modulates body temperature both in sepsis and health. Am J Respir Crit Care Med. 2022;207(8):1030–1041. doi: 10.1164/rccm.202201-0161OC. - DOI - PMC - PubMed
    1. Tsuchida T, et al. Protocol for a sepsis model utilizing fecal suspension in mice: fecal suspension intraperitoneal injection model. Front Med. 2022;9:765805. doi: 10.3389/fmed.2022.765805. - DOI - PMC - PubMed

MeSH terms