. 2024 Dec 12;20(12):e1012727.
doi: 10.1371/journal.ppat.1012727. eCollection 2024 Dec.

Seasonal influenza a virus lineages exhibit divergent abilities to antagonize interferon induction and signaling

Affiliations

Seasonal influenza a virus lineages exhibit divergent abilities to antagonize interferon induction and signaling

Joel Rivera-Cardona et al. PLoS Pathog. .

Abstract

The circulation of seasonal influenza A viruses (IAVs) in humans relies on effective evasion and subversion of the host immune response. While the evolution of seasonal H1N1 and H3N2 viruses to avoid humoral immunity is well characterized, relatively little is known about the evolution of innate immune antagonism phenotypes in these viruses. Numerous studies have established that only a small subset of infected cells is responsible for initiating the type I and type III interferon (IFN) response during IAV infection, emphasizing the importance of single cell studies to accurately characterize the IFN response during infection. We developed a flow cytometry-based method to examine transcriptional changes in IFN and interferon stimulated gene (ISG) expression at the single cell level. We observed that NS segments derived from seasonal H3N2 viruses are more efficient at antagonizing IFN signaling but less effective at suppressing IFN induction, compared to the pdm2009 H1N1 lineage. We compared a collection of NS segments spanning the natural history of the current seasonal IAV lineages and demonstrate long periods of stability in IFN antagonism potential, punctuated by occasional phenotypic shifts. Altogether, our data reveal significant differences in how seasonal and pandemic H1N1 and H3N2 viruses antagonize the human IFN response at the single cell level.


Conflict of interest statement

The authors have declared that no competing interests exist.

Figures

Fig 1
Fig 1. Adapting hybridization chain reaction (HCR) for quantifying gene expression by flow cytometry (HCR-flow).
(A) Expression of IFNL1 and IFIT3 in A549 cells transfected with pIC 10 ng/mL at different timepoints measured by HCR-flow. (B) Quantification of IFNL1 and IFIT3 expression in A549 treated with pIC (10 ng/mL) and collected at different timepoints. (C) Comparison of infectivity in mock or Cal07 infected (MOI 0.1 NPEU/mL) A549 measured by HCR-flow detecting NP mRNA or traditional antibody staining using HB65 (anti-NP). Data are shown as mean with SD; N = 3 cell culture wells.
Fig 2
Fig 2. Differential IFN and ISG antagonism during infection with H1N1 or H3N2 IAV.
(A) Infected A549 cells were separated into bystander or infected based on expression of NP mRNA for detection of IFNL1 and/or IFIT3. (B) Quantification of infectivity by HCR-flow in A549 infected with Cal07 (H1N1) or Perth09 (H3N2) at 16 hpi. (C) Percentage of IFNL1 or (D) IFIT3 positive cells in Cal07 and Perth09 infected and bystander A549 measured by HCR-flow. (E) Percentage of infected cells at 16 hpi with detectable levels of IFNL1 or IFIT3 from scRNA-seq data. (F) UMAP plot from scRNA-seq of A549 infected with either Cal07 or Perth09 highlighting cells with detectable IFNL1 transcript in red. Data are shown as mean with SD; N = 3 cell culture wells with exception of panel (E) which represents a single scRNA-seq library per virus. Multiple unpaired t test (Holm-Šídák method for multiple comparisons) was used for statistical analysis.
Fig 3
Fig 3. IFN and ISG induction during infection with H1N1 or H3N2 IAV.
(A) Expression of IFNL1 at different times post infection in A549 infected with Cal07 or Perth09, measured by bulk qPCR. (B) Detection of secreted IFNL in supernatant from A549 infected with Cal07 or Perth09 at different times post infection, measured by an IFNL signaling reporter cell line. (C) Percentage of IFNL1 or (D) IFIT3 positive cells in Cal07 and Perth09 infected A549 at different times post infection, measured by HCR-flow. Expression of NP (E) or NS1 (F) in Cal07 or Perth09 infected cells measured by qPCR. Data are shown as mean with SD with p values indicated on top of each comparison; N = 3 cell culture wells. Multiple unpaired t test (Holm-Šídák method for multiple comparisons) were used for statistical analysis.
Fig 4
Fig 4. Differential ISG antagonism observed between H1N1 and H3N2 is dependent on the NS segment.
(A) Infected A549 cells were separated based on the presence or absence of the NP mRNA using HCR-flow. (B) Percentage of infectivity in cells collected at 16 hpi and measured from three replicates for each virus. (C) Quantification of IFNL1 or IFIT3 expression in A549 infected with NS reassortments. Data are shown as mean with SD; N = 3 cell culture wells. Unpaired t test and multiple unpaired t test (Holm-Šídák method for multiple comparisons) were used for statistical analysis.
Fig 5
Fig 5. H3N2 is better at inhibiting ISGs after pIC stimulus compared to H1N1.
(A) Quantification of A549 cells expressing IFNL1 or IFIT3 at 16 hrs post treatment with pIC (10 ng/mL). (B) Percentage of IFNL1 and IFIT3 in mock or pIC (10 ng/mL) treated A549 after 16 hrs. (C) Percentage of IFNL1 and IFIT3 expression in cells infected with Cal07 or Perth09 and subsequently treated with pIC at 4 hpi. (D) Expression of IFNL1 and IFIT3 in A549 cells infected with NS reassortments and treated with pIC measured by HCR-flow. Data are shown as mean with SD; N = 3 cell culture wells. Multiple unpaired t test (Holm-Šídák method for multiple comparisons) was used for statistical analysis.
Fig 6
Fig 6. Perth09 is more effective that Cal07 at antagonizing JAK/STAT signaling.
(A) Percentage of A549 cells expressing IFNL1 or IFIT3 at 16 hrs post treatment with recombinant hIFNL1 or hIFNB1 (100 ng/mL). (B) Comparison of IFIT3 expression in cells infected with Cal07 or Perth09 and subsequently treated with hIFNB1 (100 ng/mL) or (C) hIFNL1 (100 ng/mL). (D) Quantification of IFIT3 frequencies in hIFNB1 or hIFNL1 treated A549 cells with ruxolitinib (10 μM). (E) Percentage of ruxolitinib treated A549 cells expressing IFIT3 at 16 hrs post transfection with pIC (10 ng/mL). (F) Quantification of IFIT3 positive cells in A549s treated with ruxolitinib and subsequently infected with Cal07 or Perth09 for 16 hrs. Data are shown as mean with SD; N = 3 cell culture wells. Unpaired t test and multiple unpaired t test (Holm-Šídák method for multiple comparisons) were used for statistical analysis.
Fig 7
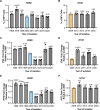
Fig 7. H3N2 and H1N1 immune antagonism is highly variable during circulation.
Percentage of NP positive cells for (A) H3N2 with NS from 1968–2020 or (B) Cal07 expressing NS from 2009–2020. (C) Quantification of IFNL1 expression in A549s infected with H3N2 encoding NS from 1968–2020 at 16 hpi normalized to 2009. (D) Percentages of IFNL1 positive populations in cells infected with H1N1 expressing NS from 2009–2020 at 16 hpi normalized to 2009 (E) Quantification of IFIT3 in A549s cells infected with H3N2 encoding NS from 1968–2020 at 16 hpi normalized to 2009. (F) IFIT3 expression in A549s infected with H1N1 NS from 2009 to 2020 at 16 hpi normalized to 2009. Data are shown as mean with SD with p values indicated on top for comparison to 2009; N = 3 cell culture wells. One-way ANOVA (Dunnett’s Multiple Comparisons test) was used for statistical analysis to compare conditions to 2009.

Update of

References

    1. Macias AE, McElhaney JE, Chaves SS, Nealon J, Nunes MC, Samson SI, et al.. The disease burden of influenza beyond respiratory illness. Vaccine. 2021. Mar 15;39:A6–14. doi: 10.1016/j.vaccine.2020.09.048 - DOI - PMC - PubMed
    1. Mifsud EJ, Kuba M, Barr IG. Innate Immune Responses to Influenza Virus Infections in the Upper Respiratory Tract. Viruses. 2021. Oct 17;13(10):2090. doi: 10.3390/v13102090 - DOI - PMC - PubMed
    1. Plowright RK, Parrish CR, McCallum H, Hudson PJ, Ko AI, Graham AL, et al.. Pathways to zoonotic spillover. Nat Rev Microbiol. 2017. Aug;15(8):502–10. doi: 10.1038/nrmicro.2017.45 - DOI - PMC - PubMed
    1. García-Sastre A. Ten Strategies of Interferon Evasion by Viruses. Cell Host & Microbe. 2017. Aug;22(2):176–84. doi: 10.1016/j.chom.2017.07.012 - DOI - PMC - PubMed
    1. Stifter SA, Bhattacharyya N, Pillay R, Flórido M, Triccas JA, Britton WJ, et al.. Functional Interplay between Type I and II Interferons Is Essential to Limit Influenza A Virus-Induced Tissue Inflammation. PLOS Pathogens. 2016. Jan 5;12(1):e1005378. doi: 10.1371/journal.ppat.1005378 - DOI - PMC - PubMed