. 2024 Dec 12;22(12):e3002930.
doi: 10.1371/journal.pbio.3002930. eCollection 2024 Dec.

Novel kinase regulators of extracellular matrix internalisation identified by high-content screening modulate invasive carcinoma cell migration

Affiliations

Novel kinase regulators of extracellular matrix internalisation identified by high-content screening modulate invasive carcinoma cell migration

Montserrat Llanses Martinez et al. PLoS Biol. .

Abstract

The interaction between cancer cells and the extracellular matrix (ECM) plays a pivotal role in tumour progression. While the extracellular degradation of ECM proteins has been well characterised, ECM endocytosis and its impact on cancer cell progression, migration, and metastasis is poorly understood. ECM internalisation is increased in invasive breast cancer cells, suggesting it may support invasiveness. However, current high-throughput approaches mainly focus on cells grown on plastic in 2D, making it difficult to apply these to the study of ECM dynamics. Here, we developed a high-content screening assay to study ECM uptake, based on the of use automated ECM coating for the generation of highly homogeneous ECM a pH-sensitive dye to image ECM trafficking in live cells. We identified that mitogen-activated protein kinase (MAPK) family members, MAP3K1 and MAPK11 (p38β), and the protein phosphatase 2 (PP2) subunit PPP2R1A were required for the internalisation of ECM-bound α2β1 integrin. Mechanistically, we show that down-regulation of the sodium/proton exchanger 1 (NHE1), an established macropinocytosis regulator and a target of p38, mediated ECM macropinocytosis. Moreover, disruption of α2 integrin, MAP3K1, MAPK11, PPP2R1A, and NHE1-mediated ECM internalisation significantly impaired cancer cell migration and invasion in 2D and 3D culture systems. Of note, integrin-bound ECM was targeted for lysosomal degradation, which was required for cell migration on cell-derived matrices. Finally, α2β1 integrin and MAP3K1 expression were significantly up-regulated in pancreatic tumours and correlated with poor prognosis in pancreatic cancer patients. Strikingly, MAP3K1, MAPK11, PPP2R1A, and α2 integrin expression were higher in chemotherapy-resistant tumours in breast cancer patients. Our results identified the α2β1 integrin/p38 signalling axis as a novel regulator of ECM endocytosis, which drives invasive migration and tumour progression, demonstrating that our high-content screening approach has the capability of identifying novel regulators of cancer cell invasion.


Conflict of interest statement

The authors have declared that no competing interests exist.

Figures
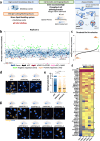
Fig 1
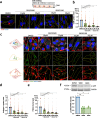
Fig 1. A kinome and phosphatome screen identified MAP3K1 and PPP2R1A as positive regulators of matrigel internalisation in MDA-MB-231 cells.
(a) Screen schematic representation, 3,000 MDA-MB-231 cells were transfected, transferred into pH-rodo labelled 0.5 mg/ml matrigel, incubated for 6 h and labelled with 1 μg/ml Hoechst for nuclear staining. Cell imaging was carried out with an Opera phenix microscope (40× objective). Columbus software was used for image analysis. (b) Normalised cloud plot analysis from replicate 1, positive regulator hits are in orange, negative hits in green. (c) First derivative of the curve for hit threshold for replicate 1. (d) Representative images from positive regulators in the screen, MAP3K1 and PPP2R1A. Scale bar, 20 μm. (e) Normalised cell data quantification for MAP3K1 and PPP2R1A. Data are presented as the normalised mean ± SD; N = 3 independent replicates. ****p < 0.0001; Kruskal–Wallis test. (f) Heatmap of kinome and phosphatome siRNA deconvolution. N = 2 technical replicates, N = 2 biological replicates per individual siRNA. Orange stars identified validated positive regulators, green stars validated negative regulators. (g) Representative images of the deconvoluted siRNA for MAP3K1 and PPP2R1A. All the raw data associated with this figure are available in S1 Data.
Fig 2
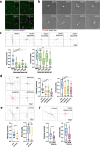
Fig 2. a2 integrin promoted ECM internalisation in MDA-MB-231 breast cancer cells.
(a) MDA-MB-231 cells were allowed to adhere on biotinylated CDM for 2 h before incubating the cells with 10 μM BTT-3033, an α2 integrin inhibitor, or DMSO for 6 h. Cells were fixed and stained with phalloidin Alexa-Fluor 555, Alexa Fluor 488-streptavidin, and DAPI. Data are presented as the normalised mean ± SD; N = 3 independent replicates. ****p < 0.0001; Mann–Whitney test. (b) MDA-MB-231 cells were cultured on NHS Alexa Fluor 555-labelled 1 mg/ml collagen I for 2 h before treatment with 10 μM BTT-3033, or DMSO for an additional period of 6 h. Cells were fixed and stained for actin and nuclei. Data are presented as the normalised mean ± SD; N = 3 independent replicates. ****p < 0.0001; Mann–Whitney test. (c) MDA-MB-231 cells were transfected with an siRNA targeting α2 integrin (siITGA2) or a non-targeting siRNA control (siNT), seeded on pHrodo-labelled CDM for 6 h, stained with 1 μg/ml Hoechst and imaged live. Data are presented as the normalised mean ± SD; N = 3 independent replicates. ****p < 0.0001; Mann–Whitney test. (d) MDA-MB-231 cells transfected as in (c), seeded on Alexa Fluor 555-labelled 1 mg/ml collagen I for 6 h, fixed and stained for nuclei. Data are presented as the normalised mean ± SD; N = 3 independent replicates. ****p < 0.0001; Mann–Whitney test. All the raw data associated with this figure are available in S2 Data. CDM, cell-derived matrix; ECM, extracellular matrix.
Fig 3
Fig 3. p38 MAPK regulated the internalisation of collagen I-occupied α2β1 integrin in MDA-MB-231 cells.
(a) MDA-MB-231 cells were serum starved for 16 to 18 h, and 3 × 10⁵ cells were seeded on pHrodo-labelled CDM for 6 h in the presence of DMSO, 10 μM or 50 μM of SB203580 and SB202190 in 5% FBS and imaged live. Scale bar, 22 μm. (b) CDM uptake index was calculated with ImageJ. Values represented are normalised mean + SD from N = 3 independent experiments; ****p < 0.0001; Kruskal–Wallis test. (c) MDA-MB-231 cells were serum starved for 16 to 18 h, and 3 × 10⁵ cells were seeded on 1 mg/ml collagen I, labelled with NHS-Alexa Fluor 555, treated as in (a), fixed and stained for α2 integrin (ITGA2) and nuclei. Scale bar, 20 μm. (d, e) Collagen I uptake index and α2 integrin internal pool were calculated with ImageJ. Values represented are normalised mean + SD from N = 3 independent experiments; ****p < 0.0001; Kruskal–Wallis test. (f) Cells were serum starved for 24 h, preincubated for 1 h with 50 μM SB253080 (SB80), 50 μM SB202190 (SB90), or DMSO, stimulated with 250 mM sorbitol for 15 min and lysed. Phospho-p38 (p-p38) and GAPDH protein levels were measured by western blotting. Data are presented as the normalised mean ± SD; N = 5 independent experiments. *p = 0.0286; Mann–Whitney test. All the raw data associated with this figure are available in S3 Data. CDM, cell-derived matrix; MAPK, mitogen-activated protein kinase.
Fig 4
Fig 4. MAP3K1, MAPK11, and PPP2R1A modulated collagen I-occupied α2β1 integrin uptake.
(a) MDA-MB-231 cells were transfected with an siRNA targeting MAPK3K1 (siMAP3K1), an siRNA targeting MAPK11 (siMAPK11), an siRNA targeting PPP2R1A (siPPP2R1A) or a non-targeting siRNA control (siNT), seeded on pHrodo-labelled CDM for 6 h, stained with 1 μg/ml Hoechst and imaged live. Scale bar, 20 μm. (b) CDM uptake index was calculated with ImageJ. Values represented are normalised mean + SD from N = 3 independent experiments; ****p < 0.0001; Kruskal–Wallis test. (c) MDA-MB-231 cells were transfected as in (a), seeded on 1 mg/ml collagen I, labelled with NHS-Alexa Fluor 555, for 6 h, fixed and stained for α2 integrin (ITGA2) and nuclei. Scale bar, 20 μm. (d, e) Collagen I uptake index and α2 integrin internal pool were calculated with ImageJ. Values represented are normalised mean + SD from N = 3 independent experiments; ****p < 0.0001; Kruskal–Wallis test. All the raw data associated with this figure are available in S4 Data. CDM, cell-derived matrix; MAPK, mitogen-activated protein kinase.
Fig 5
Fig 5. Regulators of ECM internalisation were required for invasive breast cancer cell migration.
(a) MDA-MB-231 cells were seeded on 1 mg/ml collagen I labelled with pHrodo and NHS-fluorescein for 30 min before live imaging for 5 h. Representative images extracted from S2 Video are shown. Scale bar, 20 μm. (b) MDA-MB-231 cells were seeded in pHrodo-labelled CDM for 6 h and imaged live by time-lapse microscopy. Representative images extracted from S3 Video are shown. Scale bar, 20 μm. (c) MDA-MB-231 cells were seeded on CDM for 6 h in the presence of DMSO, 10 μM and 50 μM SB203580 or SB202190 and imaged live with a 10× Nikon Inverted Ti eclipse with Oko-lab environmental control chamber for at least 7 h. Spider plots show the migration paths of manually tracked cells (directionality >0.5 in black, <0.5 in red). Box and whisker plots represent 5–95 percentile, + represents the mean, dots are <5% and >95%; N = 3 independent experiments. ****p < 0.0001; Kruskal–Wallis test. (d) MDA-MB-231 cells were transfected with an siRNA targeting MAP3K1 (siMAP3K1), an siRNA targeting MAPK11 (siMAPK11), an siRNA targeting PPP2R1A (siPPP2R1A) or a non-targeting siRNA control (siNT), seeded on CDM for 6 h and imaged live with a 10× Nikon Inverted Ti eclipse with Oko-lab environmental control chamber for 17 h. Spider plots show the migration paths of manually tracked cells (directionality >0.5 in black, <0.5 in red). Box and whisker plots represent 5–95 percentile, + represents the mean; dots are <5% and >95%; N = 3 independent experiments. ****p < 0.0001; Kruskal–Wallis test. (e) MDA-MB-231 cells were transfected with an siRNA targeting α2 integrin (siITGA2) or a non-targeting siRNA control (siNT), seeded on CDM for 4 h and imaged live for 17 h. Spider plots show the migration paths of manually tracked cells (directionality >0.5 in black, <0.5 in red). Box and whisker plots represent 5–95 percentile, + represents the mean, dots are <5% and >95%; N = 3 independent experiments. **p = 0.0032; ****p < 0.0001; Mann–Whitney test. (f) MDA-MB-231 cells seeded on CDM for 6 h in the presence of 50 nM Okadaic acid (Okad Ac.) or vehicle control (water) and imaged live for 17 h. Spider plots show the migration paths of manually tracked cells (directionality >0.5 in black, <0.5 in red). Box and whisker plots represent 5–95 percentile, + represents the mean, dots are <5% and >95%; N = 3 independent experiments. ****p < 0.0001; Mann–Whitney test. All the raw data associated with this figure are available in S5 Data. CDM, cell-derived matrix; ECM, extracellular matrix; MAPK, mitogen-activated protein kinase.
Fig 6
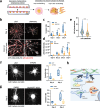
Fig 6. MAP3K1 and α2 integrin were necessary for MDA-MB-231 cell invasion.
(a) Schematic representation of ECM internalisation in 3D. (b) MDA-MB-231 cells were transfected with an siRNA targeting MAP3K1 (siMAP3K1) or a non-targeting siRNA control (siNT) and spheroids embedded in 3D 3 mg/ml pHrodo-labelled collagen I and matrigel (1:1 ratio) mixture for 4 days. Scale bar, 200 μm. For the invasive front: scale bar, 100 μm. (c) Invasion rate (spheroid invasion area/spheroid core area). Box and whisker plots represent 5–95 percentile, + represents the mean, N = 4 independent experiments. **p = 0.0060, ***p = 0.0003, ****p < 0.0001; 2-way ANOVA, mixed-effects analysis test. (d) pHrodo intensity in spheroids. Box and whisker plots represent Min to Max, + represents the mean; N = 4 independent experiments. ***p = 0.0004, ****p < 0.0001; mixed-effects analysis test. (e) AR of invasive protrusions. Cell data are presented in violin plots as the median and quartiles; N = 4 independent experiments. ****p < 0.0001; Mann–Whitney test. (f) MDA-MB-231 cells were transfected with an siRNA targeting α2 integrin (siITGA2) or non-targeting siRNA control (siNT) and spheroids were embedded in 2 mg/ml collagen I and matrigel (1:1 ratio) matrix for 3 days. Scale bar, 200 μm. Box and whisker plots represent Min to Max, + represents the mean; N = 2 independent experiments. ****p < 0.0001; 2-way ANOVA test. (g) MDA-MB-231 cells spheroids were embedded in 2 mg/ml collagen I and matrigel (1:1 ratio) matrix and treated with DMSO or 10 μM BTT-3033. Scale bar, 200 μm. Box and whisker plots represent Min to Max, + represents the mean; N = 2 independent experiments. ***p = 0.0005; 2-way ANOVA test. (h) Working model. All the raw data associated with this figure are available in S6 Data. AR, aspect ratio; ECM, extracellular matrix.
Fig 7
Fig 7. α2, β1 integrin, and MAP3K1 expression correlated with poor prognosis of pancreatic ductal adenocarcinoma.
(a, d, g) RNA sequencing data from PDAC tumours (N = 177) and normal pancreatic tissue (N = 252) for α2 integrin (ITGA2, a), β1 integrin (ITGB1, d), and MAP3K1 (g). ****p < 0.0001; Mann–Whitney test. (b, e, h) Overall survival of patients with PDAC with high (red) or low (black) α2 integrin (ITGA2, b), β1 integrin (ITGB1, e) and MAP3K1 (h) expression. (c, f, i) Relapse-free survival of patients with PDAC with high (red) or low (black) α2 integrin (ITGA2, c), β1 integrin (ITGB1, f), and MAP3K1 (i) expression. The data underlying the graphs shown in Fig 7B, 7C, 7E, 7F, and 7H were directly generated using KMplot.com (https://kmplot.com/analysis/index.php?p=service&cancer=pancancer_rnaseq). The rest of the raw data associated with this figure are available in S7 Data. MAPK, mitogen-activated protein kinase; PDAC, pancreatic ductal adenocarcinoma.

References

    1. Caswell PT, Chan M, Lindsay AJ, McCaffrey MW, Boettiger D, Norman JC. Rab-coupling protein coordinates recycling of alpha5beta1 integrin and EGFR1 to promote cell migration in 3D microenvironments. J Cell Biol. 2008;183:143–155. doi: 10.1083/jcb.200804140 - DOI - PMC - PubMed
    1. Lee JW, Juliano RL. alpha5beta1 integrin protects intestinal epithelial cells from apoptosis through a phosphatidylinositol 3-kinase and protein kinase B-dependent pathway. Mol Biol Cell. 2000;11:1973–1987. doi: 10.1091/mbc.11.6.1973 - DOI - PMC - PubMed
    1. Bansaccal N, Vieugue P, Sarate R, Song Y, Minguijon E, Miroshnikova YA, et al.. The extracellular matrix dictates regional competence for tumour initiation. Nature. 2023. doi: 10.1038/s41586-023-06740-y - DOI - PMC - PubMed
    1. Winkler J, Abisoye-Ogunniyan A, Metcalf KJ, Werb Z. Concepts of extracellular matrix remodelling in tumour progression and metastasis. Nat Commun. 2020;11:5120. doi: 10.1038/s41467-020-18794-x - DOI - PMC - PubMed
    1. Nazemi M, Yanes B, Martinez ML, Walker HJ, Pham K, Collins MO, et al.. The extracellular matrix supports breast cancer cell growth under amino acid starvation by promoting tyrosine catabolism. PLoS Biol. 2024;22:e3002406. doi: 10.1371/journal.pbio.3002406 - DOI - PMC - PubMed

LinkOut - more resources