. 2024 Dec 12;19(12):e0315228.
doi: 10.1371/journal.pone.0315228. eCollection 2024.

Phosphorus-independent role of FGF23 in erythropoiesis and iron homeostasis

Affiliations

Phosphorus-independent role of FGF23 in erythropoiesis and iron homeostasis

Min Young Park et al. PLoS One. .

Abstract

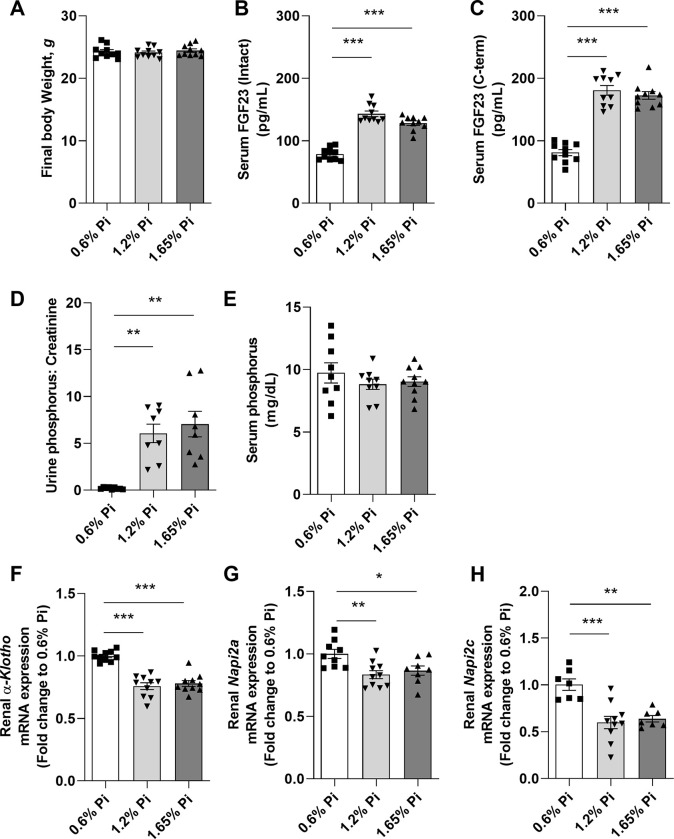
A number of studies have reported an association between phosphorus, red blood cell (RBC) production, and iron metabolism. However, it is difficult to distinguish whether the effect of phosphorus is direct or through the actions of FGF23, and it is not clear whether phosphorus is positively or negatively associated with RBC production. In the present study, we investigated the effects of a) increased phosphorus load and b) phosphorus deficiency on erythropoiesis and iron metabolism in association with FGF23. Mice were fed either a 1.2% or 1.65% phosphorus diet and compared to mice fed a control diet containing 0.6% of phosphorus. Moreover, we used two mouse models of hypophosphatemia-induced either by dietary intervention in the form of a low phosphorus (LP) diet (0.02% of Pi) or genetically in a mouse model of X-linked hypophosphatemia (XLH)-that had opposite FGF23 levels. Phosphorus supplementation appropriately increased FGF23 levels leading to excretion of excess phosphorus and normalization of serum phosphorus levels. We also found that a phosphorus-rich diet results in inflammation-induced hypoferremia associated with reduced iron export leading to tissue iron overload. Moreover, high phosphorus intake results in ineffective erythropoiesis caused by decreased production (decreased RBCs, hemoglobin, hematocrit, and erythroid progenitors in the bone marrow) and increased destruction of RBCs, leading to anemia despite increased EPO secretion. These complications occur through the actions of elevated FGF23 in the presence of normophosphatemia. Our data also show that LP diet induces a decrease in the serum concentrations of phosphorus and FGF23, resulting in increased RBC counts, hemoglobin concentration, and hematocrit compared to mice fed normal diet. Moreover, serum iron and transferrin saturation were increased and positively correlated with serum ferritin, liver ferritin protein and mRNA expression in mice fed LP diet. However, hyp mice, the murine model of XLH, exhibit hypophosphatemia and high serum FGF23 levels, along with low number of circulating RBCs, hemoglobin, and hematocrit compared to wild-type mice. In the bone marrow, hyp mice showed reduced number of erythroid progenitors and formed significantly less BFU-E colonies compared to control mice. Serum iron levels and transferrin saturation were also decreased in hyp mice in comparison to control mice. Taken together, our data show that FGF23 acts independent of phosphorus levels to regulate erythropoiesis and iron homeostasis.


Conflict of interest statement

The authors have declared that no competing interests exist.

Figures

Fig 1
Fig 1. Phosphate regulation in response to high phosphorus diet intake.
C57BL/6J male mice were fed a diet containing 0.6% inorganic phosphorus (Pi), 1.2% Pi, or 1.65% Pi for 2 weeks. (A) Body weight after 2 weeks of phosphorus supplementation. (B-C) Serum concentration of (B) intact and (C) C-terminal FGF23 measured by ELISA. (D-E) Phosphorus levels measured in (D) urine as ratio of phosphorus to creatinine and (E) serum. (F-H) Quantitative real-time RT-PCR for renal (F) α-Klotho, (G) Napi2a, and (H) Napi2c expression. Data are expressed as fold change (2-ΔΔCt) relative to housekeeping gene Hprt. Samples were measured in duplicates. Data are represented as mean ± SD. All data were analyzed for normality with Shapiro-Wilk test and homogeneity of variance by Brown-Forsythe test. For samples with normal distribution, one-way ANOVA was performed compared to 0.6% Pi with Dunnett’s multiple comparison test (B, C, E, F, G, H). When the samples were in normal distribution but not in homogeneity of variance, Welch’s ANOVA was performed (D). The samples not in normal distribution were analyzed with non-parametric Kruskal-Wallis test (A). (n = 7–10 per group). *P < 0.05, **P < 0.01, ***P < 0.001 compared to 0.6% Pi.
Fig 2
Fig 2. Regulation of calcium homeostasis following phosphorus supplementation.
(A-B) Serum levels of (A) calcium (Ca), and (B) PTH measured after 2 weeks of different dietary phosphorus intake. (C-D) Quantitative real-time RT-PCR for renal (C) cyp27b1 and (D) cyp24a1 expression. Data are expressed as fold change (2-ΔΔCt) relative to housekeeping gene Hprt. Samples were measured in duplicates. Data are represented as mean ± SD. All data were analyzed for normality with Shapiro-Wilk test and homogeneity of variance by Brown-Forsythe test. For samples with normal distribution with equal variance, one-way ANOVA with Dunnett’s multiple comparison test was performed (B, C). Samples with unequal variance were analyzed with Welch’s ANOVA (A, D). (n = 7–10 per group). *P < 0.05, **P < 0.01, ***P < 0.001 compared to 0.6% Pi.
Fig 3
Fig 3. Effect of dietary phosphorus overload on inflammation and iron homeostasis.
C57BL/6J male mice were fed a diet containing 0.6% inorganic phosphorus (Pi), 1.2% Pi, or 1.65% Pi for 2 weeks. Serum and tissue samples were collected at the end of the experiment. (A-C) Quantitative real-time RT-PCR for hepatic expression of (A) TNFα, (B) IL-6, and (C) hepcidin. (D-F) Serum levels of (D) hepcidin, (E) iron, and (F) transferrin saturation. (G-H) Protein expression of Ferroportin (FPN) in (G) duodenum and (H) spleen, shown in representative image of western blot (left) and quantification (right) in each panel. Proteins extracted from each tissue were analyzed by Western blot assay. Abundance of FPN protein was normalized with Actin. Data are represented as mean ± SD. All data were analyzed for normality with Shapiro-Wilk test and homogeneity of variance by Brown-Forsythe test. When the samples showed normal distribution, one-way ANOVA was performed (A, C, E, F, G). When the samples did not show homogeneity of variance, logarithmic transformation of data was performed and equivalence of variance was confirmed once again prior to one-way ANOVA (B, H). The samples not in homogeneity of variance (normal distribution) were analyzed with non-parametric Kruskal-Wallis test (D). (n = 6–8 per group). *P < 0.05, **P < 0.01, ***P < 0.001 compared to 0.6% Pi.
Fig 4
Fig 4. Tissue iron content following high phosphorus intake.
Tissue iron content was measured after 2 weeks of phosphorus overload and normalized to weight (mg) of dried tissue sample. Tissues were weighed at collection and their weight was normalized to total body weight of the animal and represented as percentage. (A) Kidney iron content, (B) kidney weight, (C) spleen iron content, and (D) spleen weight. Data are represented as mean ± SD. All data were analyzed for normality with Shapiro-Wilk test and homogeneity of variance by Brown-Forsythe test. Samples were in normal distribution with equal variance, and one-way ANOVA with Dunnett’s multiple comparison test was performed (A-D). (n = 7–10 per group). *P < 0.05, **P < 0.01, ***P < 0.001 compared to 0.6% Pi.
Fig 5
Fig 5. Effect of phosphorus overload on circulating red blood cell parameters and bone marrow erythroid progenitor cells.
C57BL/6J male mice were fed a diet containing 0.6% inorganic phosphorus (Pi), 1.2% Pi, or 1.65% Pi for 2 weeks. Whole blood was collected and analyzed by complete blood count (CBC) for circulating red blood cell parameters (A-C) and FACS for bone marrow erythroid progenitor cells (D-G). (A) Red Blood Cells (RBCs), (B) Hemoglobin (Hgb), (C) Hematocrit (Hct). (n = 7–10 per group). (D-G) Bone marrow cells were collected from femur and tibia and further quantified for erythroid progenitor cell populations by FACS analysis for (D) proerythroblasts (pro-E), (E) basophilic, (F) polychromatic, and (G) orthochromatic cells (n = 4 per group). (H) Neutrophil counts obtained from CBC (n = 6–7 per group). Data are represented as mean ± SD. All data were analyzed for normality with Shapiro-Wilk test and homogeneity of variance by Brown-Forsythe test. For samples with normal distribution with equal variance, one-way ANOVA with Dunnett’s multiple comparison test was performed (B, C, D, E, F). Samples with normal distribution and unequal variance were analyzed with Welch’s ANOVA (G, H). Samples not in normal distribution were analyzed with non-parametric Kruskal-Wallis test (A). *P < 0.05, **P < 0.01, ***P < 0.001 compared to 0.6% Pi.
Fig 6
Fig 6. Activation of hypoxia inducible factors and Epo signaling pathway by phosphorus supplementation.
C57BL/6J male mice were fed a diet containing 0.6% inorganic phosphorus (Pi), 1.2% Pi, or 1.65% Pi for 2 weeks. (A) Serum erythropoietin (EPO) levels measured by ELISA. (B-E) Quantitative real-time RT-PCR for expression of (B) renal Epo, (C) bone marrow Epo receptor (EpoR), (D) renal Hif-2α, and (E) bone marrow erythroferrone (Erfe). (F) Regression curve for correlation between bone marrow Erfe expression levels and serum FGF23 levels. (G) Quantitative real-time RT-PCR for splenic expression of heme oxygenase-1 (Hmox-1). Data are expressed as fold change (2-ΔΔCt) relative to housekeeping gene Hprt. Data are represented as mean ± SD. All data were analyzed for normality with Shapiro-Wilk test and homogeneity of variance by Brown-Forsythe test. For samples with normal distribution and equal variance, one-way ANOVA with Dunnett’s multiple comparison test was performed (C, D, G). Samples with unequal variance were analyzed with Welch’s ANOVA (A, B, E). For the correlation curve, we applied simple linear and simple logistic regression (F). (n = 7–10 per group). *P < 0.05, **P < 0.01, ***P < 0.001.
Fig 7
Fig 7. Low phosphorus diet increases red blood cell production through suppression of FGF23.
Eight-week old C57BL/6J male mice were fed a diet containing 0.02% inorganic phosphorus (LP) for 2 weeks and compared to C57BL/6J male mice fed normal phosphorus diet (0.6% Pi; CONT). (A-B) Serum concentration of (A) intact FGF23, and (B) C-terminal FGF23 after 2 weeks of phosphorus restriction. (C-E) Circulating red blood cell parameters. (C) Red Blood Cells (RBCs), (D) Hemoglobin (Hgb), (E) Hematocrit (Hct). (F) Colony forming unit assay. Bone marrow cells were isolated from femora and tibiae, cultured for 12 days on methylcellulose medium, and counted for erythroid progenitor cells, burst forming unit-erythroid (BFU-E). (G) Quantitative real-time RT-PCR for renal Epo expression. Data are expressed as fold change (2-ΔΔCt) relative to housekeeping gene Hprt. (H) Serum concentration of EPO. Samples were measured in duplicates. (I) Quantitative real-time RT-PCR for splenic Hmox expression. Data are expressed as fold change (2-ΔΔCt) relative to housekeeping gene Hprt. Data are represented as mean ± SD. (n = 7–10 per group for A, B, C, D, E, F, H, and I; n = 5–6 per group for G). All data were analyzed for normality with Shapiro-Wilk test and homogeneity of variance by F test. For samples with normal distribution, unpaired t test was performed compared to CONT (B, C, D, E, F, G, H). When the samples were in normal distribution but not in homogeneity of variance, the data were analyzed by Welch’s t test (A, I). *P < 0.05, **P < 0.01, ***P < 0.001 compared to CONT (control diet).
Fig 8
Fig 8. Effect of dietary phosphorus deficiency on iron homeostasis and inflammation.
Eight-week old C57BL/6J male mice were fed a diet containing 0.02% inorganic phosphorus (LP) for 2 weeks and compared to C57BL/6J male mice fed normal phosphorus diet (0.6% Pi; CONT). Serum and tissue samples were collected at the end of the experiment. (A-B) Serum levels of (A) iron and (B) transferrin saturation. (C) Quantitative real-time RT-PCR for duodenal expression of Dmt1. Data are expressed as fold change (2-ΔΔCt) relative to housekeeping gene Hprt. (D) Protein expression of Ferroportin (FPN) in total duodenum, shown in representative image of western blot and quantitative graph. Abundance of FPN protein was normalized with Actin. (E) Serum concentration of Ferritin. Samples were measured in duplicates. (F) Liver Ferritin protein measured by ELISA in liver lysates. (G) Quantitative real-time RT-PCR for liver expression of Ferritin H. Data are expressed as fold change (2-ΔΔCt) relative to housekeeping gene Hprt. Data are represented as mean ± SD. (n = 7–10 per group for A, B, E, F, G; n = 4 per group for C and D). All data were analyzed for normality with Shapiro-Wilk test and homogeneity of variance by F test. For samples with normal distribution, unpaired t test was performed compared to CONT (C, D, E, F, G). When the samples were in normal distribution but not in homogeneity of variance, the data were analyzed by Welch’s t test (A, B). *P < 0.05 and ***P < 0.001 compared to CONT (control diet).
Fig 9
Fig 9. Red blood cell production and iron homeostasis in hyp mice.
Analysis of hematological and iron parameters in eight-week-old male mice carrying a mutation in the Phex gene (hyp mice) compared to age and sex matched wild-type littermates (control). (A-C) Serum concentration of (A) Phosphorus, (B) intact FGF23, and (C) C-terminal FGF23. (D-F) Circulating red blood cell parameters. (D) Red Blood Cells (RBCs), (E) Hemoglobin (Hgb), (F) Hematocrit (Hct). (G-H) Flow cytometry analysis of bone marrow erythroid progenitor cells from hyp and wild-type (control) mice. Percent of (G) pro-erythroblasts (pro-E) stained positive for Ter119med and CD71high and (H) terminally differentiated erythroid cells stained positive for Ter119high and negative for CD71. (I) Colony forming unit assay. Bone marrow cells were isolated from femora and tibiae, cultured for 12 days on methylcellulose medium, and counted for erythroid progenitor cells, burst forming unit-erythroid (BFU-E). (J-L) Serum concentration of (J) EPO and (K) iron. (L) Liver iron content was measured by the ferrozine colorimetric assay and normalized to weight (mg) of dried tissue sample. Tissues were weighed at collection and their weight was normalized to total body weight of the animal and represented as percentage. Samples were measured in duplicates. Data are represented as mean ± SD. (n = 5–8 per group). All data were analyzed for normality with Shapiro-Wilk test and homogeneity of variance by F test. For samples with normal distribution, unpaired t test was performed compared to WT (B, C, D, E, G, H, I, J, K). When the samples were in normal distribution but not in homogeneity of variance, the data were analyzed by Welch’s t test (F, L). When samples were not normally distributed for parametric analysis, the data were analyzed by a non-parametric Mann-Whitney test (A). *P < 0.05, **P < 0.01, ***P < 0.001 compared to wild-type (WT).

References

    1. Berndt TJ, Schiavi S, and Kumar R. "Phosphatonins" and the regulation of phosphorus homeostasis. Am J Physiol Renal Physiol. 2005;289(6):F1170–82. doi: 10.1152/ajprenal.00072.2005 - DOI - PubMed
    1. Shaikh A, Berndt T, and Kumar R. Regulation of phosphate homeostasis by the phosphatonins and other novel mediators. Pediatr Nephrol. 2008;23(8):1203–10. doi: 10.1007/s00467-008-0751-z - DOI - PMC - PubMed
    1. Takeda E, Yamamoto H, Nashiki K, Sato T, Arai H, and Taketani Y. Inorganic phosphate homeostasis and the role of dietary phosphorus. J Cell Mol Med. 2004;8(2):191–200. doi: 10.1111/j.1582-4934.2004.tb00274.x - DOI - PMC - PubMed
    1. Kawamura H, Tanaka S, Ota Y, Endo S, Tani M, Ishitani M, et al.. Dietary intake of inorganic phosphorus has a stronger influence on vascular-endothelium function than organic phosphorus. J Clin Biochem Nutr. 2018;62(2):167–73. doi: 10.3164/jcbn.17-97 - DOI - PMC - PubMed
    1. Perwad F, Azam N, Zhang MY, Yamashita T, Tenenhouse HS, and Portale AA. Dietary and serum phosphorus regulate fibroblast growth factor 23 expression and 1,25-dihydroxyvitamin D metabolism in mice. Endocrinology. 2005;146(12):5358–64. doi: 10.1210/en.2005-0777 - DOI - PubMed