. 2024 Aug 13;121(33):e2411234121.
doi: 10.1073/pnas.2411234121. Epub 2024 Aug 6.

Dual role of neuroplastin in pancreatic β cells: Regulating insulin secretion and promoting islet inflammation

Affiliations

Dual role of neuroplastin in pancreatic β cells: Regulating insulin secretion and promoting islet inflammation

Rie Asada Kitamura et al. Proc Natl Acad Sci U S A. .

Abstract

Mesencephalic astrocyte-derived neurotrophic factor (MANF) is an endoplasmic reticulum (ER)-resident secretory protein that reduces inflammation and promotes proliferation in pancreatic β cells. Numerous studies have highlighted the potential of MANF as a therapeutic agent for diabetes mellitus (DM), making it essential to understand the mechanisms underlying MANF's functions. In our previous search for a molecule that mediates MANF signaling, we identified Neuroplastin (NPTN) as a binding partner of MANF that localizes on the cell surface. However, the roles of NPTN in pancreatic β cells remain unclear. In this study, we generated β cell-specific Nptn knockout (KO) mice and conducted metabolic characterization. NPTN deficiency improved glucose tolerance by increasing insulin secretion and β cell mass in the pancreas. Moreover, proliferation and mitochondrial numbers in β cells increased in Nptn KO islets. These phenotypes resulted from elevated cytosolic Ca2+ levels and subsequent activation of downstream molecules. Simultaneously, we demonstrated that NPTN induces the expression of proinflammatory cytokines via the TRAF6-NF-κB axis in β cells. Additionally, NPTN deficiency conferred resistance to streptozotocin-induced diabetic phenotypes. Finally, exogenous MANF treatment in islets or β cells led to similar phenotypes as those observed in NPTN-deficient models. These results indicate that NPTN plays important roles in the regulation of insulin secretion, proliferation, and mitochondrial quantity, as well as proinflammatory responses, which are antagonized by MANF treatment. Thus, targeting the MANF-NPTN interaction may lead to a novel treatment for improving β cell functions in DM.

Keywords: diabetes; endoplasmic reticulum; β cell.


Conflict of interest statement

Competing interests statement:F.U. is a Founder and President of CURE4WOLFRAM, Inc., and a Chair of the Scientific Advisory Board for Emerald Biotherapeutcs, Inc. F.U. is an inventor of three patents related to the treatment of Wolfram Syndrome, US 9,891,231 Soluble Manf in Pancreatic Beta Cell Disorders and US 10,441,574 and US 10,695,324 Treatment for Wolfram Syndrome and Other ER Stress Disorders.

Figures
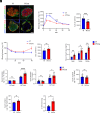
Fig. 1.
Fig. 1.
NPTN deficiency increases GSIS and β cell mass. (A) Representative immunofluorescence images of NPTN, insulin, and glucagon in islets from Nptnf/f or Nptnf/f; Ins1Cre mice. (Scale bar, 25 μm.) (B) (Left) IP-GTT with Nptnf/f or Nptnf/f; Ins1Cre male mice. (Right) AUCs of the IP-GTT (Nptnf/f: n = 9, Nptnf/f; Ins1Cre: n = 11, **P < 0.01, ***P < 0.001, and ****P < 0.0001 by the unpaired t-test). (C) (Left) IP-ITT with Nptnf/f or Nptnf/f; Ins1Cre male mice. (Right) AUCs of the IP-ITT (Nptnf/f: n = 4, Nptnf/f; Ins1Cre: n = 4). (D) Serum insulin levels following glucose injection in Nptnf/f or Nptnf/f; Ins1Cre male mice (Nptnf/f: n = 3, Nptnf/f; Ins1Cre: n = 7, *P < 0.05, **P < 0.01 by the unpaired t-test). (E) Static GSIS per islets (Left) and normalized to insulin content (Right) in primary islets from Nptnf/f or Nptnf/f; Ins1Cre mice (Nptnf/f: n = 10, Nptnf/f; Ins1Cre: n = 9, *P < 0.05 and ****P < 0.0001 by the unpaired t-test). (F) Insulin content in the islets used in (E). (G) Insulin content of the whole pancreas from Nptnf/f or Nptnf/f; Ins1Cre male mice (Nptnf/f: n = 4, Nptnf/f; Ins1Cre: n = 4, *P < 0.05 by the unpaired t-test). (H) β cell mass of the pancreas in Nptnf/f or Nptnf/f; Ins1Cre male mice (Nptnf/f: n = 3, Nptnf/f; Ins1Cre: n = 3, *P < 0.05 by the unpaired t-test). f/f: Nptnf/f, f/f:Cre: Nptnf/f; Ins1Cre, ns: not statistically significant.
Fig. 2.
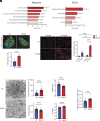
Fig. 2.
NPTN deficiency increases proliferation and mitochondrial numbers in β cells. (A) Reactome and KEGG enrichment analyses for pathways up-regulated in Nptnf/f; Ins1Creislets (Nptnf/f: n = 4, Nptnf/f; Ins1Cre: n = 4). (B) (Upper) Representative immunofluorescence images of insulin and Ki67 in pancreas from Nptnf/f or Nptnf/f; Ins1Cre mice. (Lower) A quantification of percentages of Ki67-positive β cells [Nptnf/f: n = 5 (76 islets), Nptnf/f; Ins1Cre: n = 6 (74 islets), ***P < 0.001 by the unpaired t-test]. (C) (Left) Representative immunofluorescence images of EdU and insulin in Nptnf/f or Nptnf/f; Ins1Cre islet cells cultured in the medium containing 2.8 mM or 16.7 mM glucose for 3 d. (Right) A quantification of percentages of EdU-positive β cells (Nptnf/f, 2.8 mM: n = 3, Nptnf/f, 16.7 mM: n = 3, Nptnf/f; Ins1Cre, 2.8 mM: n = 3, Nptnf/f; Ins1Cre, 16.7 mM: n = 3, **P < 0.01 and ***P < 0.001 by two-way ANOVA). (D) Representative EM images of β cells in Nptnf/f or Nptnf/f; Ins1Cre islets. (EH) A quantification of (E) mitochondrial number per cell (F) aspect ratio, (G) Feret’s diameter, and (H) circularity (Nptnf/f, n = 61 cells, Nptnf/f; Ins1Cre, n = 68 cells from three mice for each genotype. ****P < 0.0001 by the unpaired t-test). (I) Relative mitochondrial DNA (mtDNA) copy numbers normalized to nuclear DNA (nDNA) measured by qPCR analysis in islets from Nptnf/f or Nptnf/f; Ins1Cre mice (Nptnf/f, n = 8, Nptnf/f; Ins1Cre, n = 9, **P < 0.01 by the unpaired t-test). f/f: Nptnf/f, f/f:Cre: Nptnf/f; Ins1Cre, ns: not statistically significant.
Fig. 3.
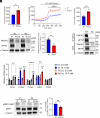
Fig. 3.
NPTN stabilizes PMCA2 by the protein–protein interaction to regulate cytosolic Ca2+ homeostasis in β cells. (AC) Cytosolic Ca2+ measurement with a calcium dye, Calbryte 520 AM. (A) Basal cytosolic Ca2+ levels in islet cells from Nptnf/f or Nptnf/f; Ins1Cre mice (Nptnf/f, n = 3, Nptnf/f; Ins1Cre, n = 3. *P < 0.05 by the unpaired t-test). (B) Dynamic cytosolic Ca2+ levels in response to glucose stimulation in islet cells from Nptnf/f or Nptnf/f; Ins1Cre mice (Nptnf/f, n = 5, Nptnf/f; Ins1Cre, n = 4. ****P < 0.0001 by two-way ANOVA). (C) Cytosolic Ca2+ levels in high glucose-treated islet cells from Nptnf/f or Nptnf/f; Ins1Cre mice (Nptnf/f, n = 5, Nptnf/f; Ins1Cre, n = 4. ***P < 0.001 by the unpaired t-test). (D) (Left) Representative blotting images of PMCA2, NPTN, and α-Tubulin in islets from Nptnf/f or Nptnf/f; Ins1Cre mice. (Right) A quantification of PMCA2 protein levels normalized with α-Tubulin (Nptnf/f, n = 3, Nptnf/f; Ins1Cre, n = 3, **P < 0.01 by the unpaired t-test). (E) Representative blotting images of PMCA2, NPTN, and α-Tubulin in IP and input samples using Nptn WT or KO INS-1 832/13 cells. (F) qPCR analysis of NFATc2 target genes related to proliferation in Nptnf/f or Nptnf/f; Ins1Cre islets cultured in the medium containing 2.8 mM or 16.7 mM glucose for 3 d. (Nptnf/f, 2.8 mM: n = 3, Nptnf/f, 16.7 mM: n = 3, Nptnf/f; Ins1Cre, 2.8 mM: n = 3, Nptnf/f; Ins1Cre, 16.7 mM: n = 4, ††††P < 0.0001 by two-way ANOVA compared to 2.8 mM for each genotype, **P < 0.01 and ****P < 0.0001 by two-way ANOVA). (G) (Left) Representative blotting images of pDRP1-S637, DRP1, and α-Tubulin in islets from Nptnf/f or Nptnf/f; Ins1Cre mice. (Right) A quantification pDRP1-S637 protein levels normalized with DRP1 (Nptnf/f, n = 3, Nptnf/f; Ins1Cre, n = 3, **P < 0.01 by the unpaired t-test). f/f: Nptnf/f, f/f:Cre: Nptnf/f; Ins1Cre, ns: not statistically significant.
Fig. 4.
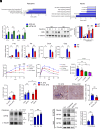
Fig. 4.
NPTN deficiency inhibits islet inflammation induced by cytokines via TRAF6–NFκB axis. (A) Reactome and KEGG enrichment analyses for pathways down-regulated in Nptnf/f; Ins1Creislets (Nptnf/f: n = 4, Nptnf/f; Ins1Cre: n = 4). (B) qPCR analysis of NF-κB target genes related to proinflammatory cytokines in INS-1 832/13 cells with gfp or Nptn overexpression (n = 4, *P < 0.05 by the unpaired t-test). (C) (Left) Representative blotting images of IκBα and α-Tubulin in Nptn WT or KO INS-1 832/13 cells treated with cytokine mix (5 ng/mL IL-1β + 100 ng/mL IFNγ) for indicated times. (Right) Fold changes of IkBα protein levels compared to 0 h. The protein levels were normalized to α-Tubulin (n = 3, **P < 0.01, ***P < 0.001, and ****P < 0.0001 by two-way ANOVA compared to 0 h for each genotype, ###P < 0.001 by two-way ANOVA). (D) qPCR analysis of NF-κB target genes related to proinflammatory cytokines in Nptn WT or KO INS-1 832/13 treated with or without cytokine mix for 6 h (n = 4, **P < 0.01 and ***P < 0.001 by two-way ANOVA). (E) Nonfasting blood glucose levels in Nptnf/f or Nptnf/f; Ins1Cre mice injected with STZ or buffer (Nptnf/f, STZ, n = 16, Nptnf/f; Ins1Cre, STZ, n = 16, Nptnf/f, Buffer, n = 7, Nptnf/f; Ins1Cre, Buffer, n = 10, **P < 0.01, ***P < 0.001, and ****P < 0.0001 by two-way ANOVA compared to Nptnf/f; Ins1Cre, STZ, † † † †P < 0.0001 by two-way ANOVA compared to Nptnf/f, Buffer, ##P < 0.01 by two-way ANOVA compared to Nptnf/f; Ins1Cre, Buffer). (F) (Left) IP-GTT performed 25 d after the first injection with STZ or buffer. (Right) AUCs of the IP-GTT (Nptnf/f, STZ, n = 13, Nptnf/f; Ins1Cre, STZ, n = 16, Nptnf/f, Buffer, n = 4, Nptnf/f; Ins1Cre, Buffer, n = 9, *P < 0.05, **P < 0.01, and ****P < 0.0001 by one-way ANOVA). (G) β cell mass of the pancreas in Nptnf/f or Nptnf/f; Ins1Cre mice injected with STZ at 28 d after the first injection (Nptnf/f, STZ, n = 3, Nptnf/f; Ins1Cre, STZ, n = 3, *P < 0.05 by the unpaired t-test). (H) Serum insulin levels following glucose injection in Nptnf/f or Nptnf/f; Ins1Cre mice injected with STZ at 28 d after the first injection (Nptnf/f, STZ, n = 7, Nptnf/f; Ins1Cre, STZ, n = 6, *P < 0.05 and **P < 0.01 by two-way ANOVA). (I) (Left) Representative immunohistochemistry images of the pancreas in Nptnf/f or Nptnf/f; Ins1Cre mice injected with STZ at 28 d after the first injection. (Scale bar, 50 μm.) (Right) A quantification of IBA1-positive are per islet (Nptnf/f, n = 12 islets from three mice Nptnf/f; Ins1Cre, n = 13 islets from three mice, **P < 0.01 by the unpaired t-test). (J) (Left) Representative blotting images of NPTN and α-Tubulin in INS-1 832/13 cells treated with cytokine mix for indicated times. (Right) A quantification of NPTN protein levels at high MW normalized to α-Tubulin (n = 3, **P < 0.01 by one-way ANOVA). (K) Representative blotting images of TRAF6, NPTN, and α-Tubulin in IP and input samples using Nptn WT or KO INS-1 832/13 cells treated with or without cytokine mix for 6 h. (Right) A quantification of TRAF6 protein levels precipitated with NPTN. The protein levels were normalized to precipitated NPTN protein levels (n = 3, **P < 0.01 by the unpaired t-test). OE: overexpression, f/f: Nptnf/f, f/f:Cre: Nptnf/f; Ins1Cre, ns: not statistically significant.
Fig. 5.
Fig. 5.
MANF antagonizes NPTN roles in inflammation and insulin secretion. (A) qPCR analysis of NF-κB target genes related to proinflammatory cytokines in Nptn WT INS-1 832/13 treated with or without cytokine mix (5 ng/mL IL-1β + 100 ng/mL IFNγ) and MANF (5 µg/mL) for 6 h (n = 4, *P < 0.05, **P < 0.01, and ****P < 0.0001 by one-way ANOVA). (B) Representative blotting images of TRAF6, NPTN, and α-Tubulin in IP and input samples using Nptn WT INS-1 832/13 cells treated with or without cytokine mix and MANF proteins for 6 h. (Right) A quantification of TRAF6 protein levels precipitated with NPTN. The protein levels were normalized to precipitated NPTN protein levels (n = 3, *P < 0.05 by one-way ANOVA). (C) Static GSIS per islets (Left) and normalized to insulin content (Right) in primary islets from Nptnf/f mice treated with or without MANF for 5 d (UT: n = 6, MANF: n = 7, *P < 0.05 by the unpaired t-test). (D) Insulin content in the islets used in (C). (E) (Left) Representative blotting images of PMCA2, NPTN, and α-Tubulin in islets from Nptnf/f mice treated with or without MANF for 5 d (Right) A quantification of PMCA2 and NPTN protein levels normalized with α-Tubulin (Nptnf/f, n = 3, Nptnf/f; Ins1Cre, n = 3, ***P < 0.001 by the unpaired t-test). UT: untreated, ns: not statistically significant.

References

    1. Burrack A. L., Martinov T., Fife B. T., T cell-mediated beta cell destruction: Autoimmunity and alloimmunity in the context of type 1 diabetes. Front. Endocrinol. (Lausanne) 8, 343 (2017). - PMC - PubMed
    1. Clark A. L., Urano F., Endoplasmic reticulum stress in beta cells and autoimmune diabetes. Curr. Opin. Immunol. 43, 60–66 (2016). - PMC - PubMed
    1. Lindahl M., Saarma M., Lindholm P., Unconventional neurotrophic factors CDNF and MANF: Structure, physiological functions and therapeutic potential. Neurobiol. Dis. 97, 90–102 (2017). - PubMed
    1. Tang Q., Li Y., He J., MANF: An emerging therapeutic target for metabolic diseases. Trends Endocrinol. Metab. 33, 236–246 (2022). - PubMed
    1. Mahadevan J., et al. , A soluble endoplasmic reticulum factor as regenerative therapy for Wolfram syndrome. Lab. Invest. 100, 1197–1207 (2020). - PMC - PubMed

MeSH terms

LinkOut - more resources