. 2025 Jan:111:105479.
doi: 10.1016/j.ebiom.2024.105479. Epub 2024 Dec 11.

Subunit protein CD40.SARS.CoV2 vaccine induces SARS-CoV-2-specific stem cell-like memory CD8+ T cells

Affiliations

Subunit protein CD40.SARS.CoV2 vaccine induces SARS-CoV-2-specific stem cell-like memory CD8+ T cells

Laury Nguema et al. EBioMedicine. 2025 Jan.

Abstract

Background: Ideally, vaccination should induce protective long-lived humoral and cellular immunity. Current licensed COVID-19 mRNA vaccines focused on the spike (S) region induce neutralizing antibodies that rapidly wane.

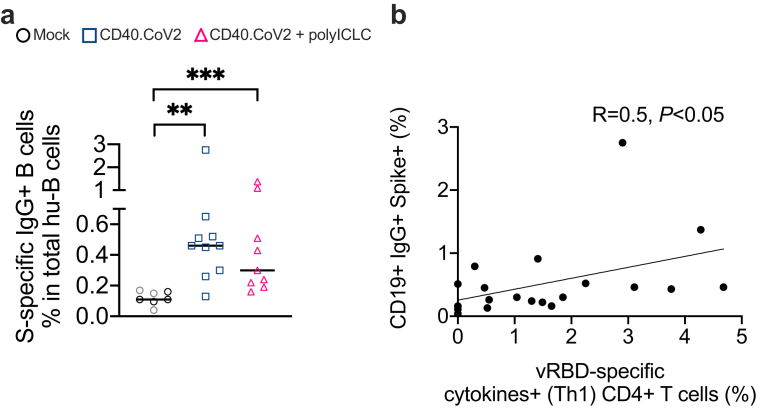
Methods: Herein, we show that a subunit vaccine (CD40.CoV2) targeting spike and nucleocapsid antigens to CD40-expressing cells elicits broad specific human (hu)Th1 CD4+ and CD8+ T cells in humanized mice.

Findings: CD40.CoV2 vaccination selectively enriched long-lived spike- and nucleocapsid-specific CD8+ progenitors with stem-cell-like memory (Tscm) properties, whereas mRNA BNT162b2 induced effector memory CD8+ T cells. CD8+ Tscm cells produced IFNγ and TNF upon antigenic restimulation and showed a high proliferation rate. We demonstrate that CD40 activation is specifically required for the generation of huCD8+ Tscm cells.

Interpretation: These results support the development of a CD40-vaccine platform capable of eliciting long-lasting T-cell immunity.

Funding: This work was supported by Inserm, Université Paris-Est Créteil, and the Investissements d'Avenir program, Vaccine Research Institute (VRI), managed by the ANR.

Keywords: COVID-19; Long-lasting T-cell immunity; Pre-clinical models; SARS-CoV-2; Vaccine.


Conflict of interest statement

Declaration of interests The authors SZ, GZ, MC, SC, and YL are named inventors on patent applications based on this work held by Inserm Transfert. The remaining authors declare no competing interests. Inserm Transfert provided a license for CD40-targeting vaccines to the biotech company LinKinVax.

Figures

Fig. 1
Fig. 1
Multiepitopic SARS-CoV-2 specific-human Th1 responses following in vivo CD40.CoV2 priming. (a) Design of the vaccination strategy. (b) AIM assays were performed on spleen cells using OLPs covering the full-length sequences of the vaccine (v)RBD, vS1, vS2, and vN antigens. Activation of SARS-CoV-2-specific human CD4+ T cells is shown as the percentage of AIM+ (OX40+ CD137+) cells within the human CD4+ subset after background subtraction. (c) Radar plots showing the proportion of antigen-specific AIM+ CD4+ T cells induced by the non-adjuvanted (blue line) or poly-ICLC-adjuvanted CD40.CoV2 vaccine (pink line). (d) Percentages of AIM+ CD4+ T cells for the total reactivity. (e) AIM+ CD4+ T-cell frequencies for the total reactivity between the negative control (NS) and antigen-specific stimulations. (f) Percentage of human CD4+ T cells producing cytokines (IFNγ and/or TNF and/or IL-2) in response to SARS-CoV-2 OLPs in spleen cells of HIS-mice after background subtraction. (g) Radar plots showing the proportion of SARS-CoV2-specific cytokines+ (Th1) CD4+ T cells induced by the non-adjuvanted (blue line) or poly-ICLC-adjuvanted CD40.CoV2 vaccine (pink line). (h) Percentages of cytokines+ (Th1) CD4+ T cells for the total reactivity. Data were analyzed using the Mann–Whitney test. Median and individual values from two independent experiments are shown. ∗p < 0.05, ∗∗p < 0.01, ∗∗∗p < 0.001. (i) Correlation between SARS-CoV-2 specific cytokines+ (Th1) CD4+ T cells (%) and AIM+ CD4+ T cells for the total reactivity (%). Statistical comparisons were performed using Spearman's correlation.
Fig. 2
Fig. 2
Relationships between CD4+T-cell and B-cell responses to CD40.CoV2 vaccination. (a) Percent of spike-IgG+ human B cells in HIS-mouse spleens. Data were analyzed using the Mann–Whitney test. Median and individual values from two independent experiments are shown. ∗∗p < 0.01, ∗∗∗p < 0.001. (b) Correlation between the percentage of vRBD-specific cytokines+ (Th1) CD4+ T cells and the percentage of spike-IgG+ B cells. Statistical comparisons were performed using Spearman's correlation.
Fig. 3
Fig. 3
Non-adjuvanted and poly-ICLC-adjuvanted CD40.CoV2 vaccine elicits polyepitopic CD8+T cells with a different pattern of antigen-dominance. (a) Percentages of cytokines-secreting CD8+ T cells for the total reactivity in response to SARS-CoV-2 OLPs in spleen cells of HIS-mice after background subtraction. Data were analyzed using the Mann–Whitney test. Median and individual values from two independent experiments are shown. ∗∗p < 0.01. (b) Proportion of cytokines-secreting CD8+ T cells specific to vRBD, vS1, vS2 and vN induced by the non-adjuvanted or poly-ICLC-adjuvanted CD40.CoV2 vaccine. (c) Correlation between SARS-CoV-2 specific cytokines+ CD4+ T cells (%) and cytokines-secreting CD8+ T cells (%) for the total reactivity. Statistical comparisons were performed using Spearman's correlation. (d) Examples of FACS plots of HLA-A∗0201-RBD multimer staining performed on HIS-mouse spleens, gated on human CD3+ T cells. The negative control for the RBD multimer staining was obtained by gating on mouse CD45+ cells. (e) Percentages of HLA-A∗0201-RBD multimer+ human CD8+ T cells in HIS-mouse spleens. Data were analyzed using the Mann–Whitney test. Median and individual values from two independent experiments are shown. ∗p < 0.05.
Fig. 4
Fig. 4
The CD40.CoV2 vaccine induces stem-cell memory T cells. (a) Examples of FACS plots of memory T-cell staining performed on HIS-mouse spleens, gated on human CD45+ cells. The negative control for the hCD95 and hCD45RA staining was obtained by gating on mouse CD45+ cells. (b) Percentage of CM and (c) Tscm cells among human CD4+ T cells. (d) Percentage of CM and (e) Tscm cells among human CD8+ T cells. Data were analyzed using the Mann–Whitney test. Median and individual values from two independent experiments are shown. ∗p < 0.05, ∗∗p < 0.01. (f) Examples of FACS plots of memory T-cell staining performed on HIS-mouse spleens, gated on human HLA-A∗0201-RBD multimer CD8+ T cells. (g) Proportion of CD8+ T-cell memory subsets among the human HLA-A∗0201-RBD multimer CD8+ T cells elicited by the CD40.CoV2 vaccine injected with (pink triangles) or without poly-ICLC (blue squares). (h) Percentage of HLA-A∗0201-RBD multimer CD8+ Tscm cells in HIS-mouse spleens. Data were analyzed using the Mann–Whitney test. Median and individual values from two independent experiments are shown. ∗∗p < 0.01, ∗∗∗p < 0.001.
Fig. 5
Fig. 5
Properties of CD8+Tscm cells induced by the CD40.CoV2 vaccine. (a) Examples of FACS plots of IFNγ- and TNF-secreting memory CD8+ T-cell staining performed on a HIS-mouse spleen from the CD40.CoV2+poly-ICLC group in response to SARS-CoV-2 N2 OLPs, gated on human CD8+ T cells. The negative control for the hTNF and hIFNγ staining was obtained by gating on mouse CD45+ cells. (b–c) Percentage of Tscm, CM, and EM CD8+ T cells secreting cytokines (IFNγ and/or TNF) in response to SARS-CoV-2 (b) vRBD, or (c) vN OLPs in the CD40.CoV2 (rectangle) and CD40.CoV2+poly-ICLC (triangle) groups one week after the last vaccination. Pairwise comparisons were performed using the Wilcoxon test. Median and individual values from two independent experiments are shown. ∗p < 0.05. (d) Examples of FACS plots of CFSE dilutions in a HIS-mouse spleen from the CD40.CoV2+poly-ICLC group after stimulation with 25 ng/mL IL-15 for nine days, gated on human CD8+ Tscm, CM, and EM cells. PD, percentage divided; PI, proliferation index. (e) Percentage of divided cells and (f) proliferation index of different memory CD8+ T-cell subsets after stimulation as in panel (d). Comparisons were performed using the Friedman test followed by the post-hoc Dunn–Bonferroni test. Median and individual values from two independent experiments are shown. ∗p < 0.05, ∗∗p < 0.01, ∗∗∗p < 0.001.
Fig. 6
Fig. 6
CD40 targeting is required for optimal induction of CD8+Tscm cells. (a) Proportion of CD8+ Tscm, CM, and EM cells among human CD8+ T cells in the spleens of HIS-mice one week after the last vaccination. The HIS-mice were vaccinated twice with the CD40.CoV2 vaccine alone, the CD40.CoV2 vaccine plus poly-ICLC, the Pfizer BNT162b2 mRNA vaccine, or IgG4.CoV2. Mock animals received two injections of PBS or poly-ICLC. The CD8+ Tscm and CD8+ EM cell induction was compared between the CD40.CoV2 group versus IgG4.CoV2 or BNT162b2 mRNA groups using the Mann–Whitney test with a Bonferroni correction. Median and individual values from two independent experiments are shown. ∗p < 0.05, ∗∗p < 0.01. (b) Proportion of Wuhan- and XBB.1.5-specific CD8+ Tscm cells (CD3+ CD8+ AIM+ CD62L+ CD44- CCR7+ CD95+ Sca-1+) with a non-exhausted or exhausted (PD-1+ TIGIT+) phenotype in the spleen of hCD40 transgenic mice one week after the last vaccination (the gating strategies are shown in Figure S2b and d). The hCD40 Tg mice received an injection of CD40.CoV2 adjuvanted with the poly-ICLC (10 μg of vaccine with 50 μg of poly-ICLC) or Comirnaty XBB.1.5 mRNA vaccine (1 μg) at day 0 and day 21. Spleen cells collected at day 28 were re-stimulated with Wuhan or XBB.1.5 RBD OLPs for 20 h. The frequencies of memory CD8+ T cell subsets were examined by flow cytometry among the specific AIM+ (CD25+ CD69+) CD8+ T cells (see the gating strategy in Figure S2b). (c) Proportion of Wuhan- or XBB.1.5 RBD-specific CD8+ EM and CM T cells in the hCD40 Tg mice. The CD40.CoV2 group versus controls or Comirnaty mRNA group were analyzed using the Mann–Whitney test. Geometric means ± SEM and individual values from two independent experiments are shown. ∗p < 0.05.
Fig. 7
Fig. 7
Slower proliferation of CD8+T cells after CD40.CoV2 vaccination. (a) Example of FACS plots of Ki67 staining of HIS-mouse spleens gated on human CD8+ T cells. (b) Percentage of Ki67+ CD8+ T cells among human CD8+ T cells. The CD40.CoV2 group versus BNT162b2 mRNA or IgG4.CoV2 groups were analyzed using the Mann–Whitney test. Median and individual values from two independent experiments are shown. ∗p < 0.05.

References

    1. Mathew D., Giles J.R., Baxter A.E., et al. Deep immune profiling of COVID-19 patients reveals distinct immunotypes with therapeutic implications. Science. 2020;369(6508) - PMC - PubMed
    1. Zhou D., Ren J., Fry E.E., Stuart D.I. Broadly neutralizing antibodies against COVID-19. Curr Opin Virol. 2023;61 - PMC - PubMed
    1. Hoffmann M., Kleine-Weber H., Schroeder S., et al. SARS-CoV-2 cell entry depends on ACE2 and TMPRSS2 and is blocked by a clinically proven protease inhibitor. Cell. 2020;181(2):271–280.e8. - PMC - PubMed
    1. Sekine T., Perez-Potti A., Rivera-Ballesteros O., et al. Robust T cell immunity in convalescent individuals with asymptomatic or mild COVID-19. Cell. 2020;183(1):158–168.e14. - PMC - PubMed
    1. Tan A.T., Linster M., Tan C.W., et al. Early induction of functional SARS-CoV-2-specific T cells associates with rapid viral clearance and mild disease in COVID-19 patients. Cell Rep. 2021;34(6) - PMC - PubMed