. 2025 Feb:79:103450.
doi: 10.1016/j.redox.2024.103450. Epub 2024 Dec 5.

Polysulfide and persulfide-mediated activation of the PERK-eIF2α-ATF4 pathway increases Sestrin2 expression and reduces methylglyoxal toxicity

Affiliations

Polysulfide and persulfide-mediated activation of the PERK-eIF2α-ATF4 pathway increases Sestrin2 expression and reduces methylglyoxal toxicity

Shin Koike et al. Redox Biol. 2025 Feb.

Abstract

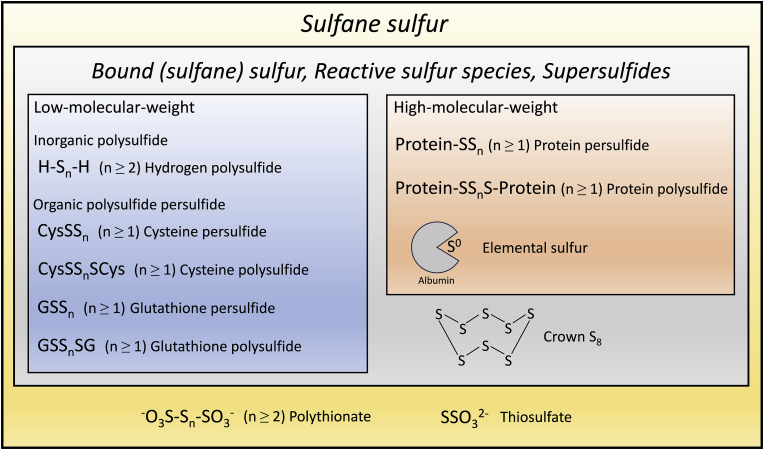
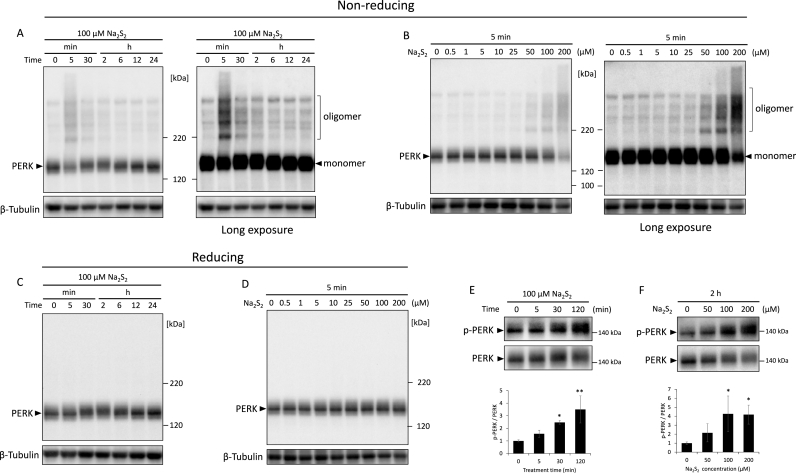
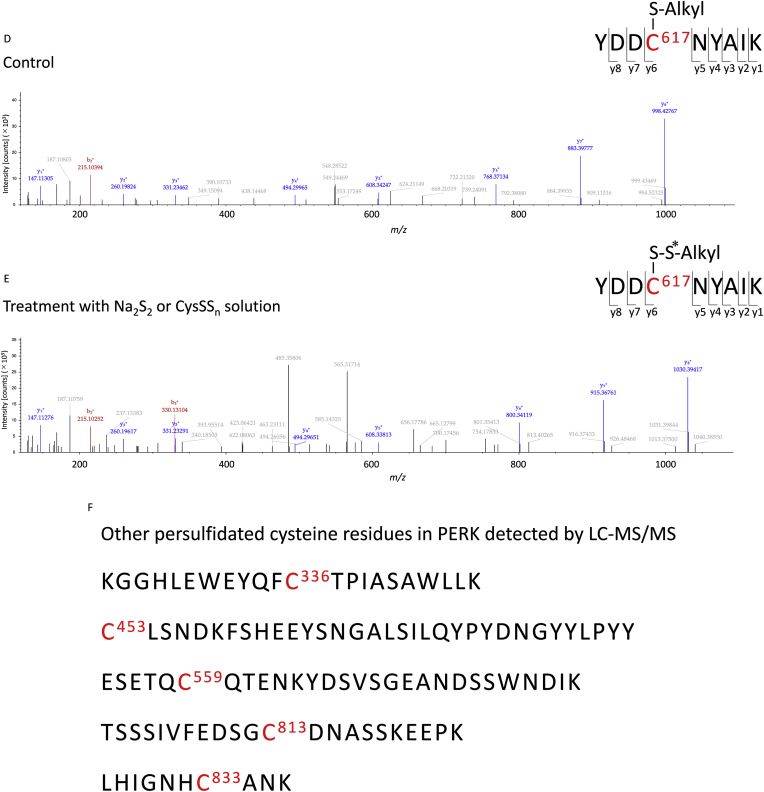
Unfolded protein response (UPR) is activated in cells under endoplasmic reticulum (ER) stress. One sensor protein involved in this response is PERK, which is activated through its redox-dependent oligomerization. Prolonged UPR activation is associated with the development and progression of various diseases, making it essential to understanding the redox regulation of PERK. Sulfane sulfur, such as polysulfides and persulfides, can modify the cysteine residues and regulate the function of various proteins. However, the regulatory mechanism and physiological effects of sulfane sulfur on the PERK-eIF2α-ATF4 pathway remain poorly understood. This study focuses on the persulfidation of PERK to elucidate the effects of polysulfides on the PERK-eIF2α-ATF4 pathway and investigate its cytoprotective mechanism. Here, we demonstrated that polysulfide treatment promoted the oligomerization of PERK and PTP1B in neuronal cells using western blotting under nonreducing conditions. We also observed that l-cysteine, a biological source of sulfane sulfur, promoted the oligomerization of PERK and the knockdown of CBS and 3-MST, two sulfane sulfur-producing enzymes, and reduced PERK oligomerization induced by l-cysteine treatment. Furthermore, the band shift assay and LC-MS/MS studies revealed that polysulfides and persulfides induce PTP1B and PERK persulfidation. Additionally, polysulfides promoted eIF2α phosphorylation and ATF4 accumulation in the nucleus, suggesting that polysulfides activate the PERK-eIF2α-ATF4 pathway in neuronal cells. Moreover, polysulfides protected neuronal cells from methylglyoxal-induced toxicity, and this protective effect was reduced when the expression of Sestrin2, regulated by ATF4 activity, was suppressed. This study identified a novel mechanism for the activation of the PERK-eIF2α-ATF4 pathway through persulfidation by polysulfides and persulfides. Interestingly, activation of this pathway overcame the toxicity of methylglyoxal in dependence on Sestrin2 expression. These findings deepen our understanding of neuronal diseases involving ER stress and UPR disturbance and may inspire new therapeutic strategies.

Keywords: Methylglyoxal; Persulfide; Polysulfide; Sestrin2; UPR pathway.


Conflict of interest statement

Declaration of competing interest The authors claim no conflict of interest.

Figures

Image 1
Graphical abstract
Fig. 1
Fig. 1
Definition of the sulfane sulfur species.
Fig. 2
Fig. 2
Polysulfides induce PERK oligomerization. (A) Cells were treated with 100 μM Na2S2 for the indicated time, and PERK levels were analyzed in the whole-cell lysate by western blotting under nonreducing conditions. The right panel displays long exposure to PVDF films. (B) Cells were treated with the indicated Na2S2 concentrations for 5 min, and PERK levels were analyzed in the whole-cell lysate by western blotting under nonreducing conditions. The right panel indicates long exposure to PVDF films. (C) Cells were treated with 100 μM Na2S2 for the indicated time, and PERK levels were analyzed in the whole-cell lysate by western blotting under reducing conditions. (D) Cells were treated with the indicated Na2S2 concentrations for 5 min, and PERK levels were analyzed in the whole-cell lysate by western blotting under reducing conditions. β-Tubulin was used as a loading control (bottom panel). (E) Cells were treated with 100 μM Na2S2 for the indicated time, and levels of p-PERK and PERK in the cytoplasmic fractions were analyzed by western blotting. (F) Cells were treated with the indicated Na2S2 concentrations for 2 h, and levels of p-PERK and PERK in cytosolic fractions were analyzed by western blotting. The p-PERK band densities were measured, and the ratio to PERK was calculated and expressed as the fold-change of the band levels relative to 0 min (E) or 0 μM (F) samples. All data are representative of at least three independent experiments.
Fig. 3
Fig. 3
Modifications of PTP1B induced by polysulfides. (A) Cells were treated with 100 μM Na2S2 for the indicated time, and PTP1B levels were analyzed in whole-cell lysates by western blotting under nonreducing conditions. (B) Cells were treated with 100 μM Na2S2 for the indicated time, and PTP1B levels were analyzed in whole-cell lysates by western blotting under reducing conditions. (C) Long exposure of PVDF films in A and B. (D) Cells were treated with the indicated Na2S2 concentrations for 5 min, and PTP1B levels were analyzed in whole-cell lysates by western blotting under nonreducing conditions. β-actin was used as a loading control (bottom panel). (E) Cells were treated with the indicated Na2S2 concentrations for 5 min, and PTP1B levels were analyzed in whole-cell lysates by western blotting under reducing conditions. β-actin was used as a loading control (bottom panel). (F) Long exposure to PVDF films in D and E. The densities of the PTP1B bands were measured. The ratio to β-actin was calculated and expressed as the fold-change of the band levels relative to the 0 min (A and B) or 0 μM (D and E) samples. Values indicate means ± S.D. Dunnett's test. ∗P < 0.05, ∗∗P < 0.01, and ∗∗∗P < 0.001. N.S, not significant. All data are representative of at least three independent experiments.
Fig. 4
Fig. 4
l-cysteine-induced PERK oligomerization is mediated by CBS and 3-MST. (A) Cells were treated with 2 mM l-cysteine for the indicated time, and PERK levels were analyzed in the whole-cell lysate by western blotting under nonreducing (A) or reducing (B) conditions. β-Tubulin was used as a loading control (bottom panel). (C) SH-SY5Y cells transfected with CBS, 3-MST, and CBS–3-MST (double knockout; dk) siRNA were treated with 2 mM l-cysteine for 6 h, and PERK levels were analyzed in the whole-cell lysates by western blotting. β-actin was used as a loading control (bottom panel). (D) SH-SY5Y cells transfected with CBS, 3-MST, and CBS–3-MST (dk) siRNA were treated with 2 mM l-cysteine for 6 h, and PERK levels were analyzed in the whole-cell lysate by western blotting under nonreducing conditions. The densities of CBS and 3-MST bands were measured, and the ratio to β-actin was calculated and expressed as the fold-change of the band levels relative to scrambled siRNA samples (A). The densities of PERK oligomer bands were measured, and the ratio to β-Tubulin was calculated and expressed as the fold-change of the band levels relative to 0 min (A) or scrambled siRNA treated with vehicle (D) samples. Values indicate means ± S.D. Dunnett's test. ∗P < 0.05, ∗∗P < 0.01, and ∗∗∗P < 0.001. All data are representative of at least three independent experiments.
Fig. 5
Fig. 5
Polysulfides disturb the redox balance of cysteine residues in proteins. (A–C) Cells were treated with 100 μM Na2S2 for the indicated time and labeled with PEG–PCMal on the cysteine residues. The levels of PERK (A and B) and PTP1B (C) in whole-cell lysates were analyzed by western blotting under nonreducing or reducing conditions.
Fig. 6
Fig. 6
LC–MS/MS analysis identified the persulfidation sites in the PERK protein. Recombinant PERK protein treated with DTT was reacted with vehicle (A and D), 100 μM Na2S2 (B and E), or CysSSn solution (C) for 5 min. The recombinant protein was alkylated with iodoacetamide and analyzed using LC–MS/MS after trypsin digestion. (A and D) Free cysteine residues (C598 and C617) are alkylated by iodoacetamide to a +54.75 kDa shift (-S-Alkyl). (B and E) A single sulfur added to a cysteine residue (C598 and C617) on the protein (persulfidation) results in a +90.5 kDa shift upon alkylation (-S-S∗-Alkyl). (C) Adding CysSS to a cysteine residue (C598) results in a +130.5 kDa shift (-S-S∗-S-Cys). Asterisks indicate sulfane sulfur. (E) Other persulfidated cysteine residues in the recombinant PERK protein after treatment with CysSSn solution.
Fig. 6
Fig. 6
LC–MS/MS analysis identified the persulfidation sites in the PERK protein. Recombinant PERK protein treated with DTT was reacted with vehicle (A and D), 100 μM Na2S2 (B and E), or CysSSn solution (C) for 5 min. The recombinant protein was alkylated with iodoacetamide and analyzed using LC–MS/MS after trypsin digestion. (A and D) Free cysteine residues (C598 and C617) are alkylated by iodoacetamide to a +54.75 kDa shift (-S-Alkyl). (B and E) A single sulfur added to a cysteine residue (C598 and C617) on the protein (persulfidation) results in a +90.5 kDa shift upon alkylation (-S-S∗-Alkyl). (C) Adding CysSS to a cysteine residue (C598) results in a +130.5 kDa shift (-S-S∗-S-Cys). Asterisks indicate sulfane sulfur. (E) Other persulfidated cysteine residues in the recombinant PERK protein after treatment with CysSSn solution.
Fig. 7
Fig. 7
LC–MS/MS analysis identified the persulfidation sites in the PTP1B protein. Recombinant PTP1B protein treated with DTT reacted with vehicle (A) or 100 μM Na2S2 (B). The recombinant protein was alkylated with iodoacetamide and analyzed using LC–MS/MS after trypsin digestion. (A) Free cysteine residues (C215) were alkylated by iodoacetamide to a +54.75 kDa shift (-S-Alkyl). (B) A single sulfur added to a cysteine residue (C215) on the protein (persulfidation) results in a +90.5 kDa shift upon alkylation (-S-S∗-Alkyl). Asterisks indicate sulfane sulfur.
Fig. 8
Fig. 8
Polysulfide-induced phosphorylation of eIF2α and nuclear accumulation of ATF4 are mediated by PERK phosphorylation in SH-SY5Y cells. (A) Cells were treated with 100 μM Na2S2 for the indicated time, and levels of p-eIF2α and eIF2α in the cytoplasmic fractions were analyzed by western blotting. (B) Cells were treated with the indicated Na2S2 concentrations for 2 h, and levels of p-eIF2α and eIF2α in cytosolic fractions were analyzed by western blotting. The p-eIF2α band densities were measured, and the ratio to eIF2α was calculated and expressed as the fold-change of the band levels relative to 0 h (A) or 0 μM (B) samples. (C) Cells were treated with 100 μM Na2S2 for the indicated time, and ATF4 levels in the nuclear fractions were analyzed by western blotting. LaminB1 was used as a nuclear loading control (bottom panel). (D) Cells were treated with the indicated Na2S2 concentrations for 2 h, and ATF4 levels in the nuclear fractions were analyzed by western blotting. LaminB1 was used as a nuclear loading control (bottom panel). The ATF4 band densities were measured, and the ratio to LaminB1 was calculated and expressed as the fold-change of the band levels relative to the 0 h (C) or 0 μM (D) samples. (E and F) SH-SY5Y cells transfected with siRNA were treated with 100 μM Na2S2 for 0.5 h (for cytoplasmic proteins) or 2 h (for nuclear proteins) and lysed to prepare the cytoplasmic and nuclear fractions, respectively. Western blotting was performed on the cytoplasmic or nuclear proteins using anti-PERK (E) or anti-ATF4 antibodies, respectively (F). β-actin and LaminB1 were used as loading controls for cytoplasmic and nuclear proteins, respectively. Protein levels were quantified by densitometry, normalized to the loading control (β-actin or LaminB1), and expressed as a fold of the protein level detected in si Ctrl-transfected (scrambled) cells. Values indicate means ± S.D. Dunnett's test (A–D). Tukey's test (E and F). ∗P < 0.05, ∗∗P < 0.01, and ∗∗∗P < 0.001. All data are representative of at least three independent experiments.
Fig. 9
Fig. 9
Polysulfides induce Sestrin2 expression through ATF4 activation. (A) Cells were treated with 100 μM Na2S2 for the indicated time, and Sestrin2 levels in the cytoplasmic fractions were analyzed by western blotting. (B) Cells were treated with the indicated Na2S2 concentrations for 6 h, and Sestrin2 levels in cytosolic fractions were analyzed by western blotting. Sestrin2 levels were quantified by densitometry, normalized to β-actin, and expressed as fold-change of band levels relative to 0 h (A) or 0 μM (B) samples. (C and D) SH-SY5Y cells transfected with ATF4 siRNA were treated with 100 μM Na2S2 for 2 h (for nuclear proteins) or 6 h (for cytoplasmic proteins) and lysed to prepare nuclear and cytoplasmic fractions, respectively. Western blotting of the nuclear fraction with anti-ATF4 and -Nrf2 antibodies (C) and the cytoplasmic fraction with anti-Sestrin2 antibodies (D). LaminB1 and β-actin are loading controls for the nuclear and cytoplasmic proteins, respectively. (E and F) SH-SY5Y cells transfected with Nrf2 siRNA were treated with 100 μM Na2S2 for 2 h (for nuclear proteins) or 6 h (for cytoplasmic proteins) and lysed to prepare the nuclear and cytoplasmic fractions, respectively. Western blotting of the nuclear fraction with anti-ATF4 and -Nrf2 antibodies (E) and the nuclear fraction with anti-Sestrin2 antibodies (F). The densities of ATF4, Nrf2, and Sestrin2 bands were measured, and the ratio to LaminB1 (C and E) or β-actin (D and F) was calculated and expressed as the fold-change of the band levels relative to scrambled siRNA treated with vehicle samples. Values indicate means ± S.D. Dunnett's test (A and B). Tukey's test (C–F). ∗P < 0.05, ∗∗P < 0.01, and ∗∗∗P < 0.001. N.S, not significant. All data are representative of at least three independent experiments.
Fig. 10
Fig. 10
Polysulfide-induced Sestrin2 protects SH-SY5Y cells from methylglyoxal toxicity. (A) SH-SY5Y cells transfected with Sestrin2 siRNA were treated with 100 μM Na2S2 for 6 h Sestrin2 levels in cytosolic fractions were analyzed by western blotting. Sestrin2 levels were quantified by densitometry, normalized to β-actin, and expressed as the fold-change of band levels relative to the vehicle (scramble) samples. (B) SH-SY5Y cells transfected with Sestrin2 siRNA were treated with the indicated methylglyoxal concentration for 24 h. (C) Cells were treated with 100 μM Na2S2 for 6 h, followed by the indicated methylglyoxal concentration for 24 h. (D) SH-SY5Y cells transfected with Sestrin2 siRNA were treated with 100 μM Na2S2 for 6 h, followed by 600 or 800 μM methylglyoxal for 24 h. Cell viability was evaluated by Hoechst/PI staining. Values indicate means ± S.D. Tukey's test. ∗P < 0.05, ∗∗P < 0.01, and ∗∗∗P < 0.001. N.S, not significant. All data are representative of at least three independent experiments. Ctr, Scramble; ND, Sestrtin2 knockdown.

Similar articles

Cited by

References

    1. Mori K. Tripartite management of unfolded proteins in the endoplasmic reticulum. Cell. 2000;101:451–454. doi: 10.1016/S0092-8674(00)80855-7. - DOI - PubMed
    1. Hetz C. The unfolded protein response: controlling cell fate decisions under ER stress and beyond. Nat. Rev. Mol. Cell Biol. 2012;13:89–102. doi: 10.1038/nrm3270. (2012) - DOI - PubMed
    1. Eletto D., Chevet E., Argon Y., Appenzeller-Herzog C. Redox controls UPR to control redox. J. Cell Sci. 2014;127:3649–3658. doi: 10.1242/jcs.153643. - DOI - PubMed
    1. Bertolotti A., Zhang Y., Hendershot L.M., Harding H.P., Ron D. Dynamic interaction of BiP and ER stress transducers in the unfolded-protein response. Nat. Cell Biol. 2000;2:326–332. - PubMed
    1. Harding H.P., Zhang Y., Ron D. Protein translation and folding are coupled by an endoplasmic-reticulum-resident kinase. Nature. 1999;397:271–274. - PubMed

Publication types

MeSH terms

LinkOut - more resources