. 2025 Apr;21(4):881-896.
doi: 10.1080/15548627.2024.2437908. Epub 2024 Dec 12.

Inhibition of the PI3K-AKT-MTORC1 axis reduces the burden of the m.3243A>G mtDNA mutation by promoting mitophagy and improving mitochondrial function

Affiliations

Inhibition of the PI3K-AKT-MTORC1 axis reduces the burden of the m.3243A>G mtDNA mutation by promoting mitophagy and improving mitochondrial function

Chih-Yao Chung et al. Autophagy. 2025 Apr.

Abstract

Mitochondrial DNA (mtDNA) encodes genes essential for oxidative phosphorylation. The m.3243A>G mutation causes severe disease, including myopathy, lactic acidosis and stroke-like episodes (MELAS) and is the most common pathogenic mtDNA mutation in humans. We have previously shown that the mutation is associated with constitutive activation of the PI3K-AKT-MTORC1 axis. Inhibition of this pathway in patient fibroblasts reduced the mutant load, rescued mitochondrial bioenergetic function and reduced glucose dependence. We have now investigated the mechanisms that select against the mutant mtDNA under these conditions. Basal macroautophagy/autophagy and lysosomal degradation of mitochondria were suppressed in the mutant cells. Pharmacological inhibition of any step of the PI3K-AKT-MTORC1 pathway activated mitophagy and progressively reduced m.3243A>G mutant load over weeks. Inhibition of autophagy with bafilomycin A1 or chloroquine prevented the reduction in mutant load, suggesting that mitophagy was necessary to remove the mutant mtDNA. Inhibition of the pathway was associated with metabolic remodeling - mitochondrial membrane potential and respiratory rate improved even before a measurable fall in mutant load and proved crucial for mitophagy. Thus, maladaptive activation of the PI3K-AKT-MTORC1 axis and impaired autophagy play a major role in shaping the presentation and progression of disease caused by the m.3243A>G mutation. Our findings highlight a potential therapeutic target for this otherwise intractable disease.Abbreviation: ΔΨm: mitochondrial membrane potential; 2DG: 2-deoxy-D-glucose; ANOVA: analysis of variance; ARMS-qPCR: amplification-refractory mutation system quantitative polymerase chain reaction; Baf A1: bafilomycin A1; BSA: bovine serum albumin; CQ: chloroquine; Cybrid: cytoplasmic hybrid; CYCS: cytochrome c, somatic; DCA: dichloroacetic acid; DMEM: Dulbecco's modified Eagle's medium; DMSO: dimethylsulfoxide; EGFP: enhanced green fluorescent protein; LC3B-I: carboxy terminus cleaved microtubule-associated protein 1 light chain 3 beta; LC3B-II: lipidated microtubule-associated protein 1 light chain 3 beta; LY: LY290042; MAP1LC3B/LC3B: microtubule associated protein 1 light chain 3 beta; MELAS: mitochondrial encephalomyopathy, lactic acidosis and stroke-like episodes; MFC: mitochondrial fragmentation count; mt-Keima: mitochondrial-targeted mKeima; mtDNA: mitochondrial DNA/mitochondrial genome; MTOR: mechanistic target of rapamycin kinase; MTORC1: MTOR complex 1; OA: oligomycin+antimycin A; OxPhos: oxidative phosphorylation; DPBS: Dulbecco's phosphate-buffered saline; PPARGC1A/PGC-1α: PPARG coactivator 1 alpha; PPARGC1B/PGC-1β: PPARG coactivator 1 beta; PI3K: phosphoinositide 3-kinase; PINK1: PTEN induced kinase 1; qPCR: quantitative polymerase chain reaction; RNA-seq: RNA sequencing; RP: rapamycin; SQSTM1/p62: sequestosome 1; TEM: transmission electron microscopy; WT: wild-type.

Keywords: PI3K-AKT-MTORC1; m.3243A>G; mitochondria; mitophagy; mtDNA mutations; nutrient signaling.


Conflict of interest statement

No potential conflict of interest was reported by the author(s).

Figures
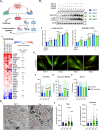
Figure 1.
Figure 1.
Chronically activated PI3K-AKT-MTORC1 axis in the m.3243A>G mutant cells is associated with impaired autophagy. (A) A scheme showing the regulation of autophagy and protein translation by the PI3K-AKT-MTORC1 pathway (i). Detailed analysis of the mRNA expression of multiple genes involved in the autophagy pathway in patient fibroblasts, showing consistent differences in a wide array of genes involved (ii). (B) Immunoblot of LC3B and SQSTM1 in patient fibroblasts (i) under basal, starvation (EBSS) or bafilomycin A1 (Baf A1, 100 nM) conditions (quantified in ii, n = 3–4 independent biological samples) also shows an accumulation of LC3B-II in the patient cells without an overall fold increase in autophagic flux that is the conversion of LC3B-I to LC3B-II. (C) Confocal imaging of live cells transfected with the autophagy reporter, mCherry-GFP-LC3B, as a measure of autophagic flux in patient fibroblasts (i and iii, n > 100 cells from three independent experiments). The numbers of mCherry and GFP+mCherry puncta under basal (ii), EBSS (iii) and the Baf A1 treatment (iv) were further quantified, showing an increase of GFP+mCherry puncta in patient fibroblasts under untreated and ebss-treated condition. Scale bar: 20 μm. (D) Representative TEM image of control and Pat 1 fibroblasts cytoplasmic area showing autophagosomal structure (blue arrowhead). Black arrowhead shows autolysosomal structures characterized by the presence of electron-dense lysosomal membranes and a large electron-lucent area, indicating degradation of intralumenal material. “L” denotes lysosomes characterized by spherical and electron-dense membrane folds. Mitochondria and nuclear envelope are shown as red and magenta-segmented areas, respectively (i). Scale bar: 1 μm. Quantification of autophagosomal area and number per square micron showed increased size and number in both Pat 1 and Pat 2 fibroblasts (ii). Plots represent the data from three independent experiments with n ≥ 30 TEM images. Data in (B-D) are represented as mean ± S.D and were analyzed by one-way ANOVA with Tukey’s multiple comparisons test (*p < 0.05, **p < 0.01, ***p < 0.001, ****p < 0.0001).
Figure 2.
Figure 2.
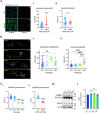
Lysosomal form and function are altered in cells carrying the m.3243A>G mutation. (A) Representative images of WT and mutant cybrid cells labelled for nucleus with Hoechst 33,342 and lysosomes with LysoTracker Green (i; scale bar: 5 μm). Binary images, as shown in (i), were used to quantify particle number and area for the measurement of mean lysosome numbers/cell (ii) and size/cell (iii). The plot represents the data from n = 50 cells from three independent experiments. (B) Binarized images of LysoTracker Green-labelled control and patient fibroblasts in (i) were measured to quantify lysosome numbers/cell (ii) and size/cell (iii). The plot represents the data from n = 50 cells from three independent experiments. Scale bar: 5 μm. (C) Lysosomal proteolytic activity was measured by DQ-BSA assay and showed that the activity was reduced both in the patient fibroblasts (i) and in the A549 cybrid cells (ii), compared to controls. The plot represents the data from three independent experiments. (D) CTSD immunoblot from cell lysates of control and patient fibroblasts showing precursor and mature forms (i). The ratio of CTSD’s precursor to mature form was measured from two independent experiments, and no significant change was observed (ii). Data are represented as mean ± S.D. and were analyzed by one-way ANOVA with Tukey’s multiple comparisons test for fibroblasts and by unpaired t test for cybrid cells (*p < 0.05, **p < 0.01, ***p < 0.001, ****p < 0.0001).
Figure 3.
Figure 3.
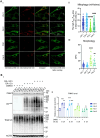
Mitophagy is impaired in cells carrying the m.3243A>G mutation. (A) Live cell imaging of mt-Keima expressing control and patient fibroblasts showing mitophagy status at 543 nm excitation. The overlay of mt-Keima emission at 458 nm and the ratio image shows the relative level of mitophagy events in control vs patient fibroblasts. The individual mitophagy events, as represented in ratio image (i), were quantified and plotted as the percentage of high F543:F458 ratio area to the total mitochondria area (ii), showing a significant reduction in “mitophagosome” maturation in patient fibroblasts (n ≥ 80–100 cells from six independent experiments; scale bar: 20 μm). Mitochondrial morphology was also quantified using the mitochondrial fragmentation count (MFC), confirming fragmented mitochondrial networks in the patient fibroblasts exhibited (iii). (B) Cell lysates from DMSO and oligomycin (1 μg/ml) and antimycin a (1 μM) treated control and patient fibroblasts were immunoblotted for PINK1, total ubiquitin and phospho-ubiquitin (Ser65) to assess PINK1 activation (i). PINK1 immunoblot from three independent experiments was analyzed to quantify the changes in its levels over time after drug treatment (ii). Data are represented as mean ± S.D. and were analyzed by one-way ANOVA with Tukey’s multiple comparisons test for fibroblasts (*p < 0.05, **p < 0.01, ***p < 0.001, ****p < 0.0001).
Figure 4.
Figure 4.
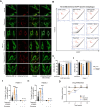
Autophagy activation following the inhibition of the PI3K-AKT-MTORC1 axis promotes mitophagy and reduces the m.3243A>G mutant load. (A) The mitophagy reporter (i), mt-Keima, was used to quantify mitophagy in patient fibroblasts treated with LY or RP. The mitochondrial area fraction engulfed in autolysosomes in both patient 1 (ii) and patient 2 (iii) were quantified and showed a significant increase in mitophagy in both patient cell lines when treated with RP ad LY (n = 82–95 cells), which was completely prevented by CQ treatment (n = 32–57 cells from five independent experiments; scale bar: 20 μm). (B) Analysis of A549 cybrid cells transfected with COX8-egfp-mCherry under various conditions (n = 3 independent biological samples for each condition) using flow cytometry showed an increase in the proportion of mitophagy-positive cells in response to LY, RP and OA-induced mitophagy while co-treatment with Baf A1 reversed the effect. (C) A549 cybrid cells (i) and Pat 1 fibroblasts (ii) were cultured with the inhibitors, RP and LY, as in all prior experiments but in combination with CQ (10 μM), showing that CQ completely prevented the decrease of mutant load in response to inhibition of the PI3K-AKT-MTORC1 pathway (n = 3–4 independent experiments). (D) Following the withdrawal of the drugs from Pat 1 fibroblasts previously treated with RP or LY (for 12 weeks), the mutant load of the treated cells reversed back to the level comparable to the untreated cells after 8 weeks. Data in (A and C-D) are represented as mean ± S.D. and were analyzed by one/two-way ANOVA with Tukey’s multiple comparisons test (*p < 0.05, **p < 0.01, ***p < 0.001, ****p < 0.0001).
Figure 5.
Figure 5.
The OxPhos function and mitochondrial fission are required to reduce mtDNA mutant load following inhibition of the PI3K-AKT-MTORC1 axis. (A-B) Representative images (A) showing short-term effects of inhibiting the PI3K-AKT-MTORC1 axis on ΔΨm (measured using TMRM 25 nM; scale bar: 20 μm) of cells carrying the m.3243A>G mutation. Quantification of the data is shown in (B). The ΔΨm (the upper panel) of the A549 cybrid cells (n = 10; the left panel) and Pat 1 fibroblasts (n = 5–6; the right panel) was significantly increased following treatment with RP or LY for 24 h. The MFC (the lower panel) confirmed that mitochondria became less fragmented after drug treatments. (C) Cell respiratory capacity of the A549 cybrid cells treated with LY or RP for 24 h was measured using the Seahorse XFe96 extracellular flux analyzer, showing a significant increase in basal oxygen consumption rate (OCR) after the short-term treatment (n = 15). (D) The A549 cybrid cells were cultured with the inhibitors RP and LY as in prior experiments. However, in combination with Mdivi-1 (25 μM) or oligomycin (5 nM), showing that Mdivi-1 or oligomycin prevented the decrease of mutant load in response to the inhibition of the PI3K-AKT-MTORC1 pathway (i; n = 3). The ΔΨm of A549 cybrid cells significantly increased after exposure to RP, LY or MK for 24 h. (E) Sustained treatment of cells over 6 weeks with DCA caused a progressive decrease in relative mutant mtDNA load in the A549 cybrid cells (i) and Pat 1 fibroblasts (ii), while cotreatment with 2DG reversed the effect of DCA on the mutant load in the cybrid cells. Data in (B-E) are represented as mean ± S.D. and were analyzed by one/two-way ANOVA with Tukey’s multiple comparisons test (*p < 0.05, **p < 0.01, ***p < 0.001, ****p < 0.0001).

References

    1. Chung C-Y, Valdebenito GE, Chacko AR, et al. Rewiring cell signalling pathways in pathogenic mtDNA mutations. Trends Cell Biol. 2022;32(5):391–405. doi: 10.1016/j.tcb.2021.10.005 - DOI - PubMed
    1. Gorman GS, Schaefer AM, Ng Y, et al. Prevalence of nuclear and mitochondrial DNA mutations related to adult mitochondrial disease. Ann Neurol. 2015;77(5):753–759. doi: 10.1002/ana.24362 - DOI - PMC - PubMed
    1. El-Hattab AW, Adesina AM, Jones J, et al. MELAS syndrome: clinical manifestations, pathogenesis, and treatment options. Mol Genet Metab. 2015;116(1):4–12. doi: 10.1016/j.ymgme.2015.06.004 - DOI - PubMed
    1. Manwaring N, Jones MM, Wang JJ, et al. Population prevalence of the MELAS A3243G mutation. Mitochondrion. 2007;7(3):230–233. doi: 10.1016/j.mito.2006.12.004 - DOI - PubMed
    1. Chung C-Y, Singh K, Kotiadis VN, et al. Constitutive activation of the PI3K-Akt-mTORC1 pathway sustains the m.3243 A > G mtDNA mutation. Nat Commun. 2021;12(1):6409. doi: 10.1038/s41467-021-26746-2 - DOI - PMC - PubMed

Publication types

MeSH terms

Substances