. 2024 Dec 12;8(3):e202403130.
doi: 10.26508/lsa.202403130. Print 2025 Mar.

FrozONE: quick cell nucleus enrichment for comprehensive proteomics analysis of frozen tissues

Affiliations

FrozONE: quick cell nucleus enrichment for comprehensive proteomics analysis of frozen tissues

Lukas A Huschet et al. Life Sci Alliance. .

Abstract

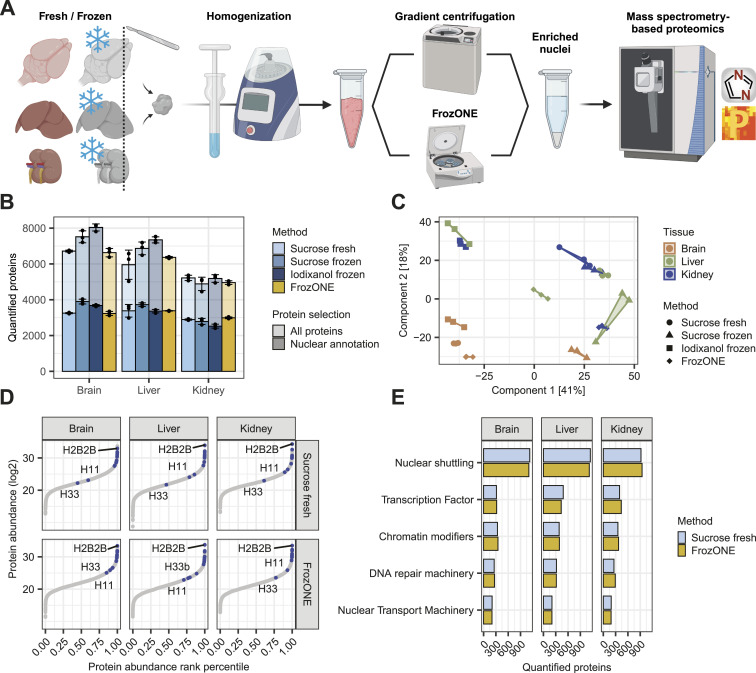
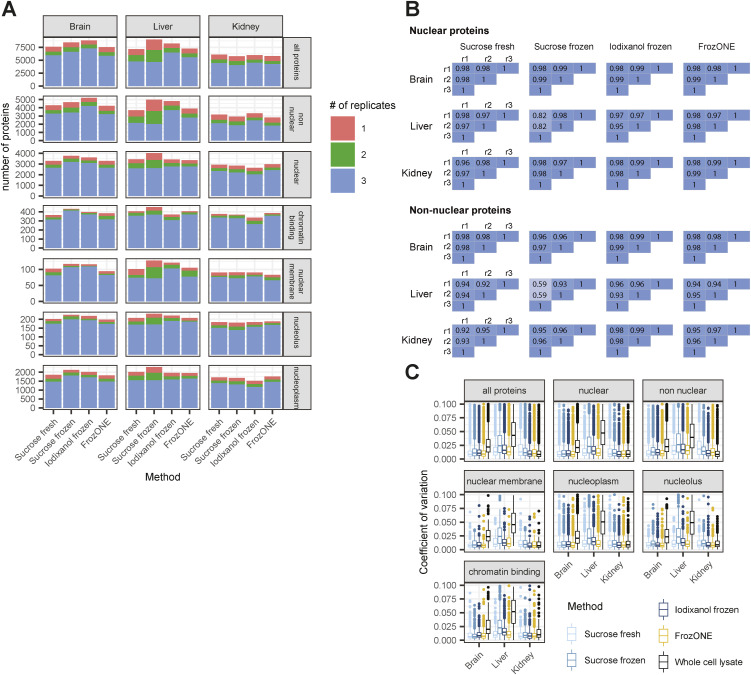
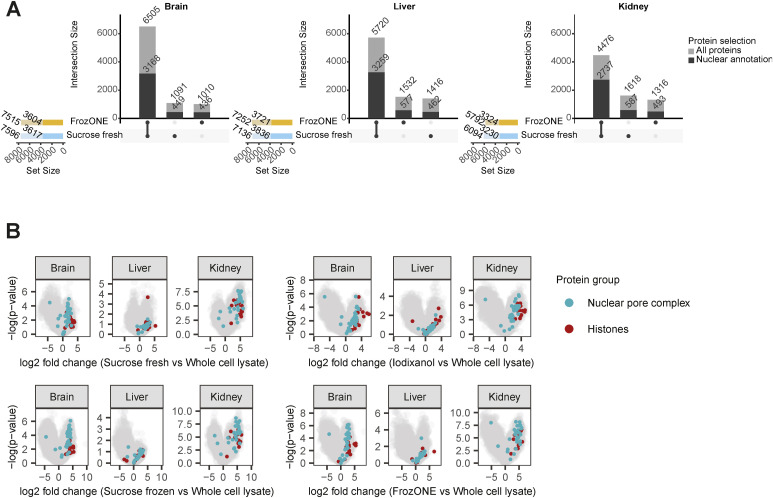
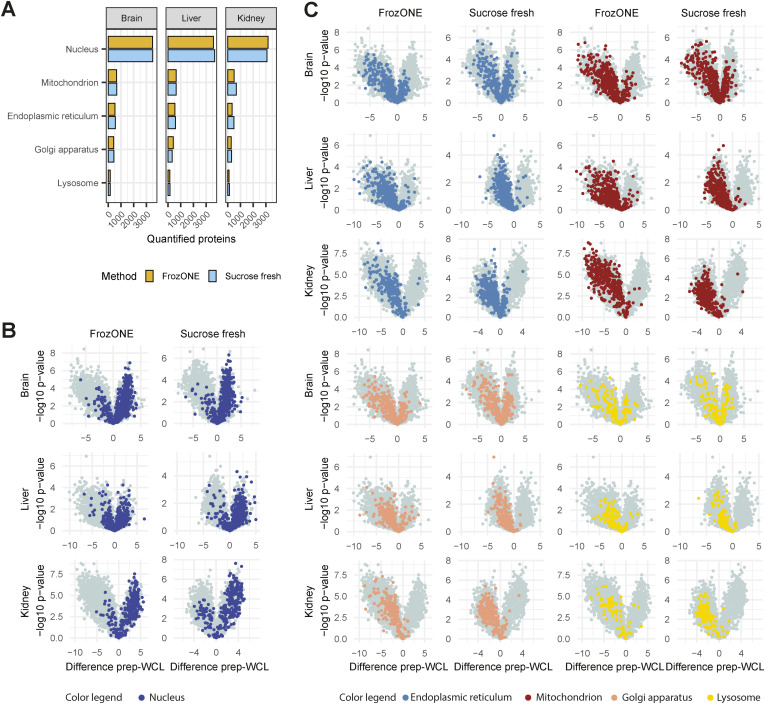
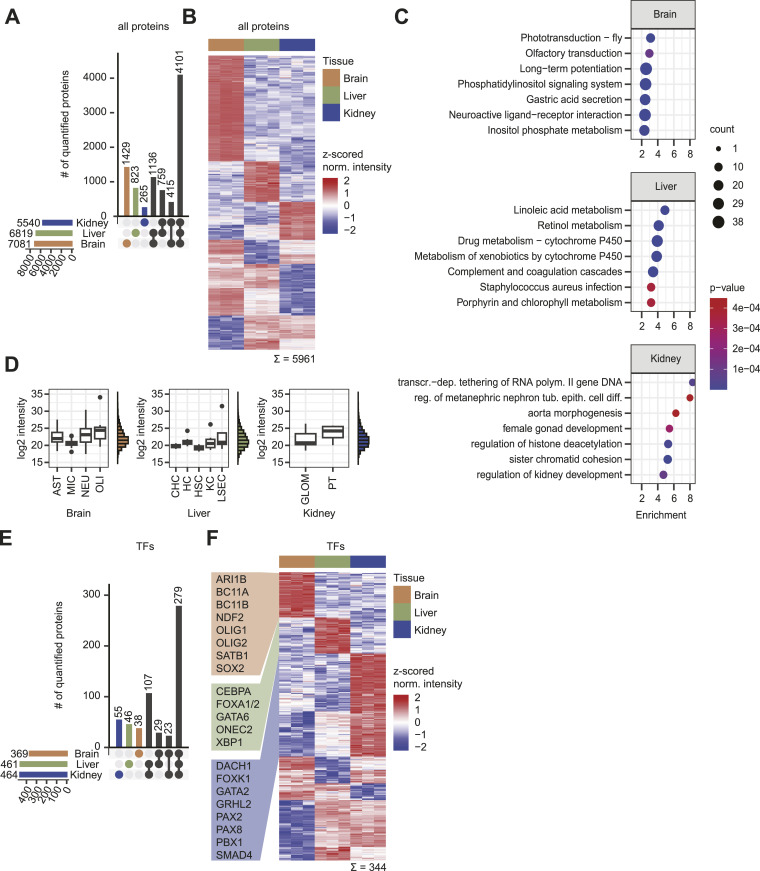
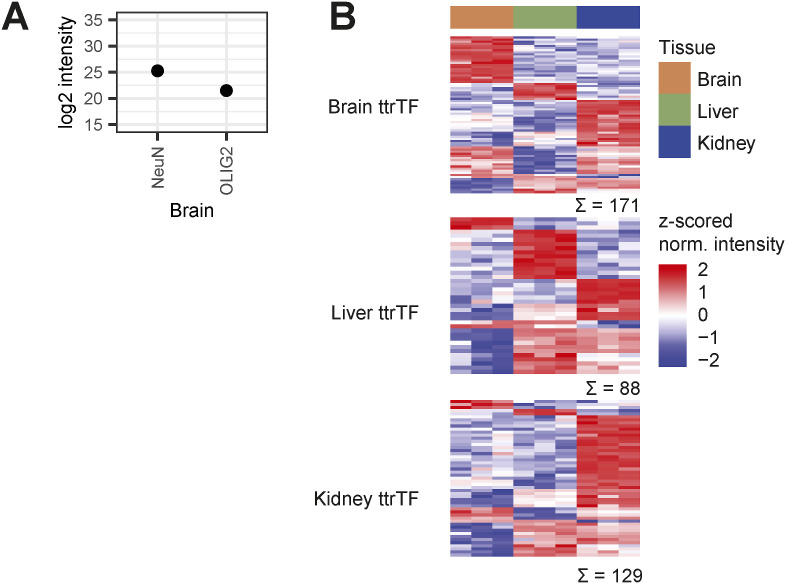
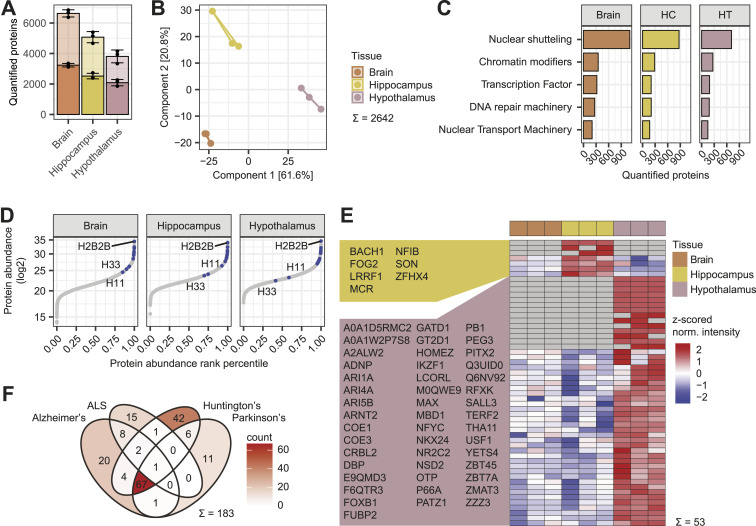
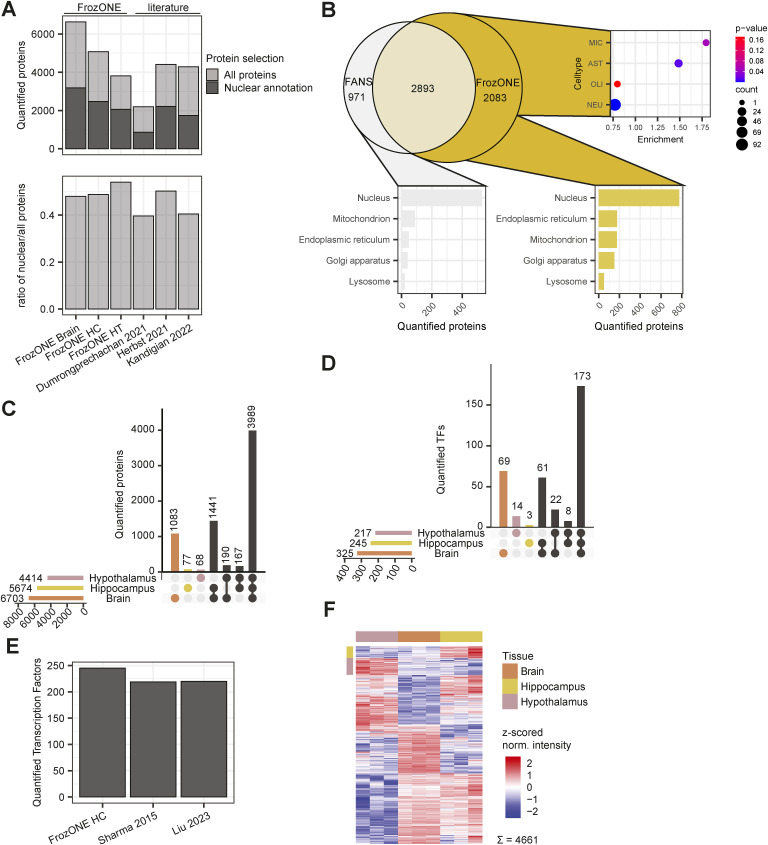
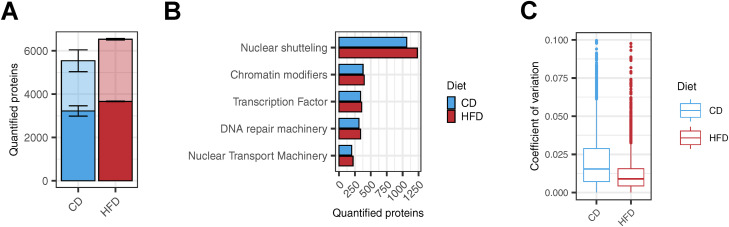
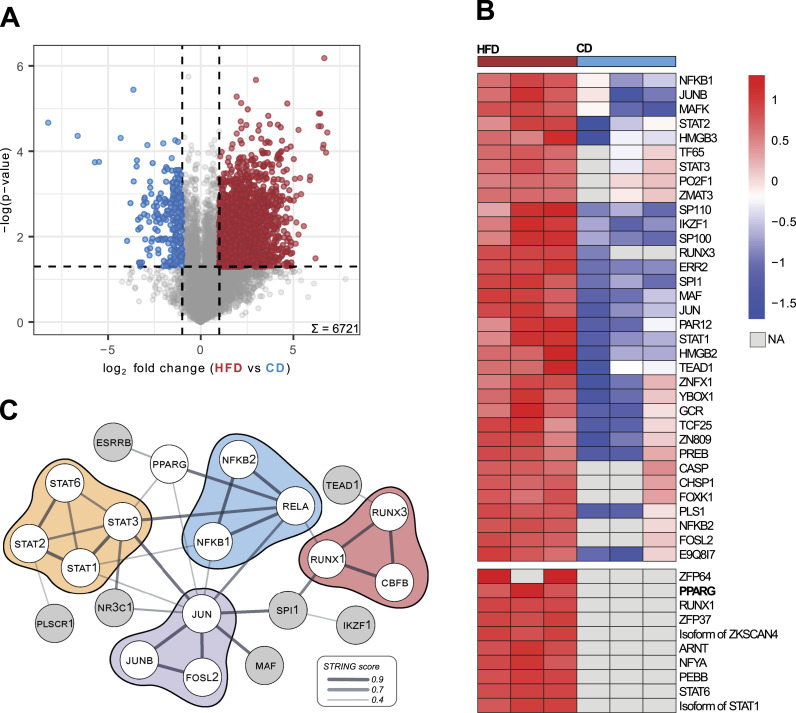
Subcellular fractionation allows for the investigation of compartmentalized processes in individual cellular organelles. Nuclear enrichment methods commonly employ the use of density gradients combined with ultracentrifugation for freshly isolated tissues. Although it is broadly used in combination with proteomics, this approach poses several challenges when it comes to scalability and applicability for frozen material. To overcome these limitations, we developed FrozONE (Frozen Organ Nucleus Enrichment), a nucleus enrichment and proteomics workflow for frozen tissues. By extensively benchmarking our workflow against alternative methods, we showed that FrozONE is a faster, simpler, and more scalable alternative to conventional ultracentrifugation methods. FrozONE allowed for the study, profiling, and classification of nuclear proteomes in different tissues with complex cellular heterogeneity, ensuring optimal nucleus enrichment from different cell types and quantitative resolution for low abundant proteins. In addition to its performance in healthy mouse tissues, FrozONE proved to be very efficient for the characterization of liver nuclear proteome alterations in a pathological condition, diet-induced nonalcoholic steatohepatitis.


Conflict of interest statement

The authors declare that they have no conflict of interest.

Figures

Figure 1.
Figure 1.. Comparative proteomics analysis of FrozONE and common nucleus enrichment methods in mouse tissues.
(A) Workflow of nucleus enrichment methods (see the Materials and Methods section for detail). (B) Barplot of the mean number of proteins quantified across at least two biological replicates in each tissue and method (n = 3). Light-colored bars denote total protein quantifications, whereas dark bars denote nuclear-annotated proteins (see the Materials and Methods section). Error bars indicate the SD. (C) Principal component analysis of protein intensities in biological replicates (n = 3) from each organ and nucleus enrichment method. (D) Scatter plot of protein abundance sorted by abundance rank percentile comparing FrozONE and sucrose ultracentrifugation with fresh tissue. Common histones between methods are labeled in blue. (E) Barplot of the mean number of proteins quantified across biological replicates (n = 3) in FrozONE and sucrose gradient with fresh tissue for important groups of nuclear proteins.
Figure S1.
Figure S1.. FrozONE provides robust and reproducible nuclear proteomes.
(A) Barplot showing the number of proteins quantified in 1, 2, or all replicates of every combination of main tissues and methods. The rows subdivide the proteins into all proteins, nuclear-annotated and non–nuclear-annotated proteins, and subnuclear GOCC categories. (B) Heatmap of Pearson’s correlations between biological triplicates within nucleus enrichment method and tissue of nuclear- and non–nuclear-annotated proteins. (C) Boxplot of coefficients of variation (CVs) of protein intensities in each method and tissue. (A) Same subdivision as in (A).
Figure S2.
Figure S2.. FrozONE and gold standard comparable nuclear proteome enrichment.
(A) Upset plot showing the overlap in protein identities between FrozONE and sucrose fresh quantifications in brain, liver, and kidney, subdivided into all proteins in light-colored bars and nuclear-annotated proteins in saturated bars. Total numbers of proteins obtained with each method in each tissue are indicated on the colored bar plot on the left side of the upset plots. (B) Volcano plots showing the result of a permutation-based t test comparing protein intensities across all biological replicates in the nucleus enrichment methods against the whole-cell lysate in each tissue.
Figure S3.
Figure S3.. FrozONE efficiently produces nuclear enriched proteomes.
(A) Barplot of the total number of proteins quantified within biological replicates (n = 3) in FrozONE or sucrose gradient with fresh tissue, annotated with different subcellular compartments (COMPARTMENTS database). For non-nuclear compartments, only proteins without the annotation “Nucleus” were used. (B, C) Volcano plots comparing protein intensities between FrozONE or sucrose fresh and whole-cell lysates for each tissue. (A) Fill colors represent the same annotations as in (A).
Figure 2.
Figure 2.. FrozONE allows resolution of mouse tissue–specific nuclear proteomes.
(A) Upset plot illustrating the distribution of protein quantifications between tissues of 8,928 proteins quantified in at least 2/3 replicates in at least one tissue. (B) Heatmap showing the z-scored label-free quantification of log2-transformed intensities of 5,961 proteins significant in an ANOVA (FDR = 0.001). (A, B, C) Top seven enrichment analysis results of tissue-up-regulated (B) and tissue-exclusive proteins (A). For brain and liver, KEGG terms, and for kidney, GOBP terms are shown. (D) Boxplots showing average log2 label-free quantification intensities of nuclear cell-type marker proteins for each tissue and histograms showing overall intensity distributions for each tissue. AST, astrocyte; MIC, microglia; Neu, neuron; OLI, oligodendrocyte; CHC, cholangiocyte; HC, hepatocyte; HSC, hepatic stellate cell; KC, Kupffer cell; LSEC, liver sinusoidal endothelial cell; GLOM, glomerulus; PT, proximal duct. (E) as A but filtered for transcription factors (TFs). (F) as B but filtered for TF. Marker TFs relevant for their tissue transcriptional machinery are indicated.
Figure S4.
Figure S4.. Cell type and tissue protein marker profiles.
(A) Normalized, log2-transformed intensities of neuron marker protein RFOX3 (NeuN) and oligodendrocyte marker protein OLIG2, averaged across three brain FrozONE replicates. (B) Heatmap showing the z-scored normalized log2-transformed intensities of proteins identified as brain, liver, or kidney tissue-type restricted TFs (ttrTFs; Zhou et al, 2017; Data ref: Zhou et al, 2017) in our FrozONE datasets for brain, liver, and kidney.
Figure 3.
Figure 3.. Spatial resolution of nuclear proteomes from distinct mouse brain areas.
(A) Barplot with the mean number of proteins quantified with FrozONE across three biological replicates from brain areas hippocampus (HC), hypothalamus (HT), and entire forebrain (Brain). Light-colored bars denote total protein quantifications, whereas dark bars denote nuclear-annotated proteins (see the Materials and Methods section). Error bars indicate the SD. (B) Principal component analysis of FrozONE proteomes from each brain area in three biological replicates. (C) Barplot of the mean numbers of proteins quantified across three biological replicates in the brain areas for important groups of nuclear proteins. (D) Scatter plot of protein abundance sorted by abundance rank percentile comparing the brain areas. Common histones between areas are labeled in blue. (E) Heatmap showing the z-scored normalized log2-transformed intensities of 53 HC and HT marker transcription factors (ANOVA-significant S0 = 0, FDR = 0.05 or exclusive). (F) Venn diagram showing the number of proteins quantified in the areas with KEGG pathway annotation for selected neurodevelopmental diseases.
Figure S5.
Figure S5.. Brain nuclear protein and transcription factor coverage.
(A) Barplot (top) showing the mean number of proteins quantified with FrozONE in each area, and with other nucleus enrichment methods in brain tissues in recent publications, using proximity labeling (Dumrongprechachan et al, 2021; Herbst et al, 2021) or differential centrifugation (Kandigian et al, 2022). Light-colored bars denote total protein quantifications, whereas dark bars denote nuclear-annotated proteins (see the Materials and Methods section). The barplot (bottom) showing the ratios of the number of nuclear over the number of total quantified proteins, using the same annotation and datasets. (B) Overlap of proteins quantified with FrozONE in hippocampus and with fluorescence-activated nucleus sorting using Sun1-GFP in hippocampus (top left), enrichment of cell-type markers (Sharma et al, 2015) among exclusive FrozONE quantified proteins (top right), and barplot of the number of exclusive FrozONE (bottom right) or fluorescence-activated nucleus sorting (bottom left) quantified proteins, annotated with different subcellular compartments (COMPARTMENTS database). For non-nuclear compartments, only proteins without the annotation “Nucleus” were used. (C) Upset plot illustrating the distribution of protein quantifications between brain areas, of 7,015 proteins quantified in at least 2/3 replicates in at least one area. (D) Upset plot illustrating the distribution of protein quantifications between brain areas, of 350 transcription factors (TFs) quantified in at least 2/3 replicates in at least one area. (E) Barplot showing the number of transcription factors quantified from hippocampus with FrozONE or from whole tissue hippocampal lysates in recent publications (Sharma et al, 2015; Liu et al, 2023). (F) Heatmap showing the z-scored normalized log2-transformed label-free quantification intensities of 4,661 proteins significant in an ANOVA (S0 = 0, FDR = 0.05). Row color bars indicate clusters for marker selection.
Figure S6.
Figure S6.. FrozONE robustly resolves fatty liver nuclear proteome.
(A) Barplot of the mean number of proteins quantified across three biological replicates in each condition. Light-colored bars denote total protein quantifications, whereas dark bars denote nuclear-annotated proteins (see the Materials and Methods section). Error bars indicate the SD. (B) Barplot of the mean number of proteins quantified across biological triplicates in CD and HFD for important groups of nuclear proteins. (C) Boxplot of coefficients of variation (CVs) of protein intensities in each condition.
Figure 4.
Figure 4.. High-fat diet rewires the nuclear proteome in the mouse liver.
(A) Volcano plot showing the result of a permutation-based t test comparing protein intensities across biological replicates (n = 3) in control (left) and high-fat diet (right). Colored points denote significantly up-regulated proteins with a −log (P-value) cutoff of = 1.3 (FDR = 0.05) and a fold change cutoff of log2 1 for each diet (CD, blue; HFD, red). (B) Heatmap of z-scored protein intensities of quantified transcription factors across biological replicates (n = 3) in CD (right) and HFD (left) with exclusively quantified TFs in HFD in the bottom part. (C) String physical subnetwork of up-regulated and exclusive transcription factors in HFD. The TF list was loaded into the STRING app in the Cytoscape platform with Mus musculus as a model species and physical network type, and with default search parameters (0.4 confidence cutoff). Singletons were not shown, and only the main network was shown. After network generation, manual arrangement of nodes was performed. STAT proteins were colored yellow; NFkB-related, blue; JUN-related, purple; and RUNX-related, red.
Figure S7.
Figure S7.. FrozONE quantification overlap with reference nuclear proteomes.
Upset plot showing the overlap of proteins quantified by FrozONE and proteins identified as nuclear in selected cell-wide subcellular proteomics datasets (see Table S1). For nonhuman studies, only proteins that could be matched to mouse homologue proteins are shown.

References

    1. Appel GB, Radhakrishnan J (2012) Glomerular disorders and nephrotic syndromes. In Goldman’s Cecil Medicine, 24th edn, pp 761–771. Philadelphia, PA: Elsevier Inc.
    1. Arias-Alvarado A, Aghayev M, Ilchenko S, Rachdaoui N, Lepp J, Tsai T-H, Zhang G-F, Previs S, Kasumov T (2021) Measuring acetyl-CoA and acetylated histone turnover in vivo: Effect of a high fat diet. Anal Biochem 615: 114067. 10.1016/j.ab.2020.114067 - DOI - PubMed
    1. Azimifar SB, Nagaraj N, Cox J, Mann M (2014) Cell-type-resolved quantitative proteomics of murine liver. Cell Metab 20: 1076–1087. 10.1016/j.cmet.2014.11.002 - DOI - PubMed
    1. Balzer MS, Rohacs T, Susztak K (2022) How many cell types are in the kidney and what do they do? Annu Rev Physiol 84: 507–531. 10.1146/annurev-physiol-052521-121841 - DOI - PMC - PubMed
    1. Barkovits K, Pacharra S, Pfeiffer K, Steinbach S, Eisenacher M, Marcus K, Uszkoreit J (2020) Reproducibility, specificity and accuracy of relative quantification using spectral library-based data-independent acquisition. Mol Cell Proteomics 19: 181–197. 10.1074/mcp.RA119.001714 - DOI - PMC - PubMed

LinkOut - more resources