. 2024 Dec 12;9(1):38.
doi: 10.1038/s41536-024-00377-9.

Early resistance rehabilitation improves functional regeneration following segmental bone defect injury

Affiliations

Early resistance rehabilitation improves functional regeneration following segmental bone defect injury

Kylie E Williams et al. NPJ Regen Med. .

Abstract

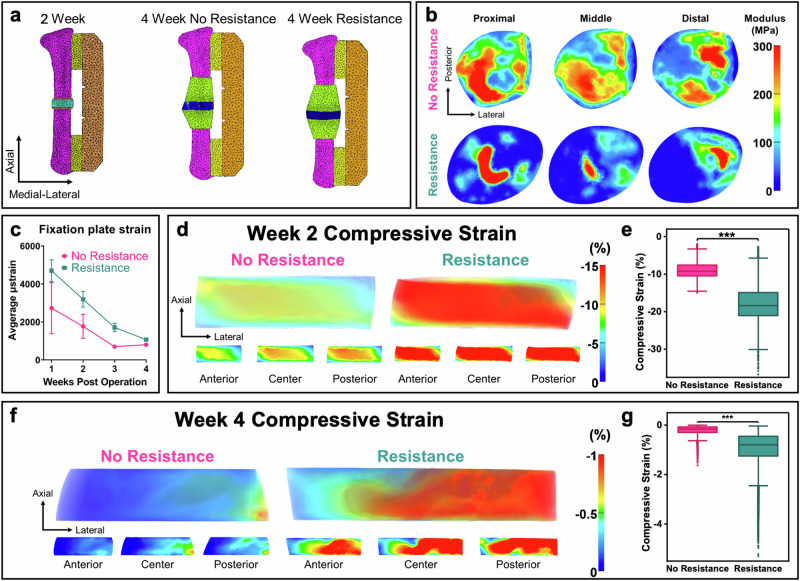
Many studies have explored different loading and rehabilitation strategies, yet rehabilitation intensity and its impact on the local strain environment and bone healing have largely not been investigated. This study combined implantable strain sensors and subject-specific finite element models in a 2 mm rodent segmental bone defect model. After injury animals were underwent high or low intensity rehabilitation. High intensity rehabilitation increased local strains within the regenerative niche by an average of 44% compared to the low intensity rehabilitation. Finite element modeling demonstrated that resistance rehabilitation significantly increased compressive strain by a factor of 2.0 at week 2 and 4.45 after 4 weeks of rehabilitation. Animals that underwent resistance running had the greatest bone volume and improved functional recovery with regenerated femurs that matched intact failure torque and torsional stiffness values. These results demonstrate the potential for early resistance rehabilitation to improve bone healing.


Conflict of interest statement

Competing interests: Robert Guldberg, Ghee Ong, and Salil Karipott have equity in Penderia Inc., a company that develops implantable orthopedic implants for clinical use. No other authors declare conflict of interests.

Figures

Fig. 1
Fig. 1. Resistance rehabilitation starting one-week post-injury improved bone healing.
a Schematic overview of pilot and follow up studies. b Rehabilitation implemented commercial running wheels (Scurry Rat Running Wheel, Lafayette Instruments®) equipped with counters and programmable breaks that can apply resistance and track individual subject’s running activity (number of rotations or distance). Resistance brake pads were modified in-house to apply more consistent friction along the lateral edge of the running wheel. c Bone volume within centered 1.5 mm of 2 mm defects after 8 weeks of recovery. *p = 0.0306, ordinary one-way Anova with Tukey’s multiple comparisons test. Mean ± standard error of the mean. d Contingency graph of week 8 bridging rates. p = 0.17, Chi-Square test. e, f In vivo representative radiographs and microCT reconstructions reveal early callus formation and consolidation for resistance rehabilitation group only. Scale bar is 1 mm. Triangles = pilot study, squares = follow up study, and circles = animals with sensors implantation from the follow up study. No statistical difference is seen across studies for bone volume results.
Fig. 2
Fig. 2. Representative histological analysis of regenerated bone at week 8.
a H&E (b) Goldner’s Trichrome (c) Picrosirius Red (d) Safranin O. Scale bar is 1 mm for all images.
Fig. 3
Fig. 3. Resistance rehabilitation led to improved mechanical strength of regenerated femurs that matched intact femurs.
a Failure torque of ex vivo femurs under 3°/sec ramp, **p = 0.0023 for sedentary defect versus resistance defect, mixed-effects analysis with Tukey’s multiple comparisons. Mean ± standard error. b Torsional stiffness was assessed as the slope of the linear region of the torque-rotation curve. **p = 0.0013 for sedentary defect versus resistance defect, mixed-effects analysis with Tukey’s multiple comparisons. Mean ± standard error. c, d Ex vivo polar moment of inertia calculated over 3 mm mid-diaphysis region depicted in microCT reconstructions cross-section. *p = 0.0213, two-tailed unpaired t-test. Mean ± standard error of the mean. Squares = follow up study, and circles = animals with sensors implantation from the follow up study. No statistical difference is seen between surgical conditions.
Fig. 4
Fig. 4. Resistance rehabilitation did not impact weekly running wheel activity levels, but rehabilitation may improve mechanical allodynia.
a Weekly running wheel activity averaged across animals throughout all weeks of activity revealed no significant difference between rehabilitation groups, multiple unpaired t-tests. b Longitudinal von Frey demonstrates the impact of injury and subsequent healing on hindlimb mechanical allodynia. Baseline denotes values for rodents prior to undergoing surgery. Significant effects of time p = 0.0006 and combinatorial time and rehabilitation condition p = 0.0350, mixed effects. # denotes significant effects between timepoints; both groups had increased pain sensitivity at week 3 compared to baseline, p = 0.0018; * denotes significant effects between groups at week 8; the no resistance rehabilitation regimen reduced pain levels at week 8 compared to sedentary, p = 0.0224, mixed effects with Tukey’s multiple comparisons test. ce Longitudinal gait analysis depicts hindlimb functionality over time. Data displayed as weight- and velocity- independent residuals of naïve Sprague-Dawley females (c, d). Week 0 denotes baseline values for rodents undergoing surgery. Significant effects over time were observed for (c) left hind duty factor p = 0.0140, d hind temporal imbalance p = 0.0020, and (e) hind spatial symmetry, p = 0.0018. Shared letters indicate no overall difference between timepoints; different letters denote significant overall differences between timepoints, p < 0.05, mixed effects with Tukey’s multiple comparisons test. No significant effects were observed between groups at week 8. Triangles = pilot study. Error bars represent standard error of the mean for all graphs.
Fig. 5
Fig. 5. Rehabilitation intensity modulates defect-level strain distributions.
a Finite element meshes used to evaluate transfer of loads during ambulation between the fixation plates and defects for individual animals. b Transverse plane slices show the spatial distribution of the Young’s modulus for the week 4 models. The no resistance defect displayed intermediate tissue differentiation throughout while the resistance defect only displayed tissue maturation near the intact femur. c Longitudinal graph of the fixation plate strain as a function of rehabilitation time. The strain decreased as healing progressed, but resistance was associated with higher strains across all weeks. Mean ± standard error. d, e 2 week post injury results. d Finite element predictions of 3rd principal (compressive) strain for defect regions are presented in the transverse plane with transparent renderings and slice plots. Strains at 2 week post injury formed a diagonal band between the proximal-medial and distal-lateral regions of the defect. Resistance led to an increase by a factor of 2.0 in the average compressive strain. e Resistance rehabilitation resulted in significantly higher predictions of mean compressive strain within the defect at week 2. ***: p < 0.001, Mann–Whitney U test. Error bars represent 1.5 × inter-quartile range (IQR). f, g 4 week post injury results. f Finite element predictions of 3rd principal strain at 4 weeks post injury. Strain is concentrated on the lateral and central regions of the defects. Resistance led to a greater than 4-fold increase in the average strain. g Resistance rehabilitation resulted in significantly higher predictions of mean compressive strain within the defect at week 4. ***p < 0.001, Mann-Whitney U test. Error bars represent 1.5 × IQR.

Update of

Similar articles

Cited by

References

    1. Calori, G. M., Mazza, E., Colombo, M., Ripamonti, C. & Tagliabue, L. Treatment of long bone non-unions with polytherapy: Indications and clinical results. Injury42, 587–590 (2011). - PubMed
    1. Keating, J. F., Simpson, A. H. R. W. & Robinson, C. M. The management of fractures with bone loss. J. Bone Jt. Surg. Br.87-B, 142–150 (2005). - PubMed
    1. Hoit, G., Bonyun, M. & Nauth, A. Hardware considerations in infection and nonunion management. OTA Int3, e055 (2020). - PMC - PubMed
    1. Houben, I. B., Raaben, M., Van Basten Batenburg, M. & Blokhuis, T. J. Delay in weight bearing in surgically treated tibial shaft fractures is associated with impaired healing: a cohort analysis of 166 tibial fractures. Eur. J. Orthop. Surg. Traumatol.28, 1429–1436 (2018). - PMC - PubMed
    1. Hurkmans, H. L. et al. The difference between actual and prescribed weight bearing of total hip patients with a trochanteric osteotomy: long-term vertical force measurements inside and outside the hospital. Arch. Phys. Med. Rehabilitation88, 200–206 (2007). - PubMed

LinkOut - more resources